| Param | Original file | Final file |
|---|---|---|
| Filename | modeM0/AS1A07_148T02_9000003728_25606cztM0_level2.evt | modeM0/AS1A07_148T02_9000003728_25606cztM0_level2_quad_clean.evt |
| Size (bytes) | 535,622,400 | 77,083,200 |
| Size | 510.8 MB | 73.5 MB |
| Events in quadrant A | 4,311,277 | 487,076 |
| Events in quadrant B | 3,422,853 | 505,226 |
| Events in quadrant C | 3,365,819 | 466,281 |
| Events in quadrant D | 4,702,332 | 443,319 |
| Mode M9 | |||
|---|---|---|---|
| Quadrant | BADHDUFLAG | Total packets | Discarded packets |
| A | 0 | 18 | 0 |
| B | 0 | 19 | 0 |
| C | 0 | 19 | 0 |
| D | 0 | 19 | 0 |
| Mode M0 | |||
|---|---|---|---|
| Quadrant | BADHDUFLAG | Total packets | Discarded packets |
| A | 0 | 17249 | 0 |
| B | 0 | 13667 | 0 |
| C | 0 | 13494 | 0 |
| D | 0 | 18164 | 0 |
| Quadrant | Total seconds | Saturated seconds | Saturation percentage |
|---|---|---|---|
| A | 6198 | 50 | 0.806712% |
| B | 6198 | 54 | 0.871249% |
| C | 6198 | 87 | 1.403679% |
| D | 6198 | 151 | 2.436270% |
Noise dominated data is calculated using 1-second bins in cleaned event files. If a bin has >2000 counts, and if more than 50% of those come from <1% of pixels, then it is considered to be noise-dominated and hence unusable.
| Quadrant | # 1 sec bins | Bins with >0 counts | Bins with >2000 counts | High rate bins dominated by noise | Noise dominated (total time) | Noise dominated (detector-on time) | Marked lightcurve |
|---|---|---|---|---|---|---|---|
| A | 7563 | 6200 | 1 | 1 | 0.01% | 0.02% | 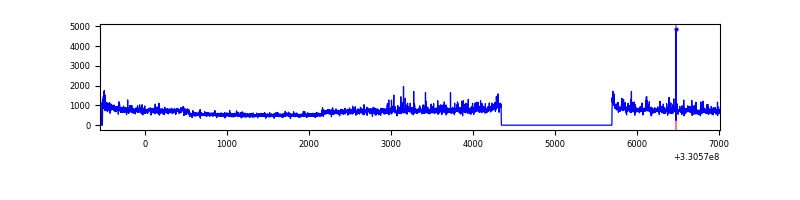 |
| B | 7563 | 6200 | 2 | 2 | 0.03% | 0.03% | 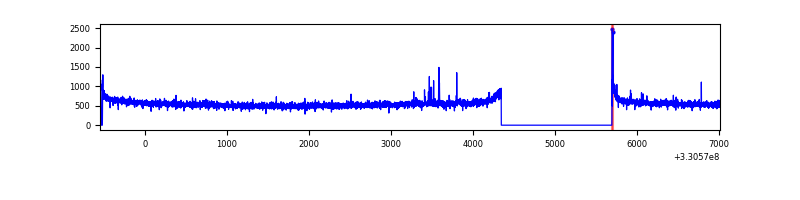 |
| C | 7563 | 6200 | 0 | 0 | 0.00% | 0.00% | 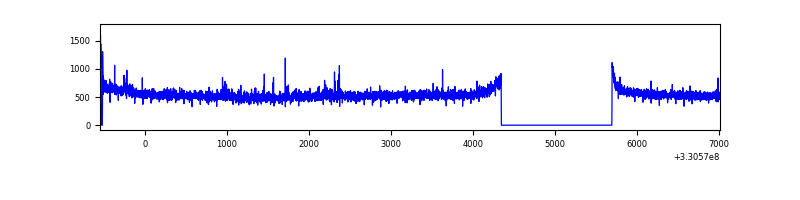 |
| D | 7563 | 6200 | 101 | 101 | 1.34% | 1.63% | 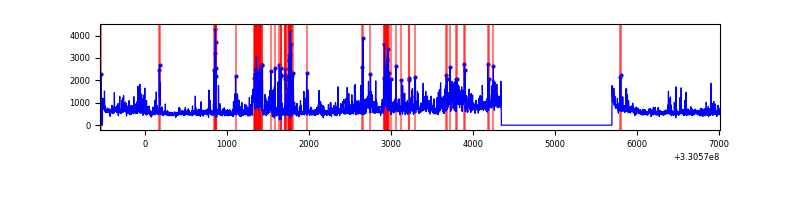 |
Top three noisy pixels from each quadrant. If the there are fewer than three noisy pixels in the level2.evt file, extra rows are filled as -1
| Pixel properties | Quadrant properties | ||||||
|---|---|---|---|---|---|---|---|
| Quadrant | DetID | PixID | Counts | Sigma | Mean | Median | Sigma |
| A | 8 | 192 | 906746 | 5335.78 | 859 | 847 | 169.8 |
| A | 6 | 16 | 71274 | 414.82 | 859 | 847 | 169.8 |
| A | 9 | 130 | 17561 | 98.45 | 859 | 847 | 169.8 |
| B | 0 | 219 | 21187 | 125.82 | 862 | 845 | 161.7 |
| B | 12 | 111 | 18463 | 108.97 | 862 | 845 | 161.7 |
| B | 11 | 111 | 16610 | 97.51 | 862 | 845 | 161.7 |
| C | 14 | 238 | 133830 | 704.23 | 815 | 824 | 188.9 |
| C | 3 | 233 | 48677 | 253.37 | 815 | 824 | 188.9 |
| C | 2 | 16 | 7025 | 32.83 | 815 | 824 | 188.9 |
| D | 1 | 52 | 1320974 | 6764.66 | 809 | 788 | 195.2 |
| D | 8 | 195 | 153912 | 784.61 | 809 | 788 | 195.2 |
| D | 7 | 238 | 80246 | 407.14 | 809 | 788 | 195.2 |
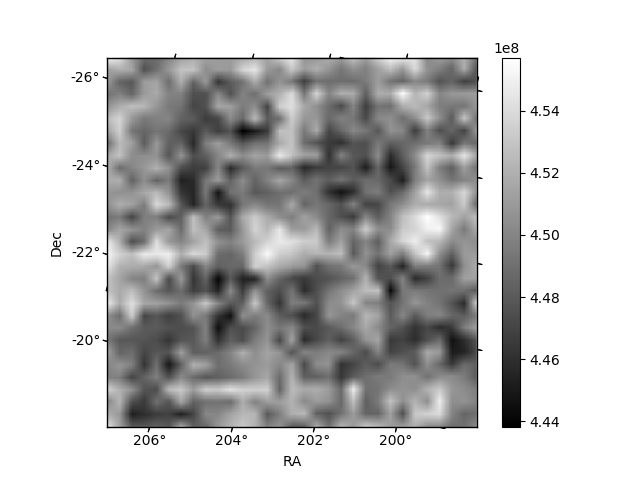
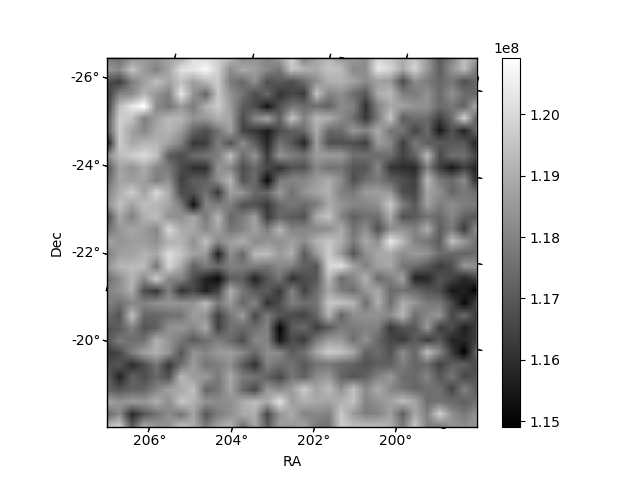
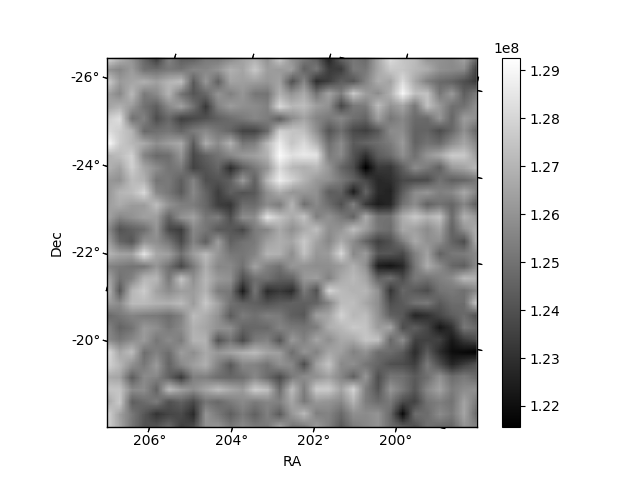
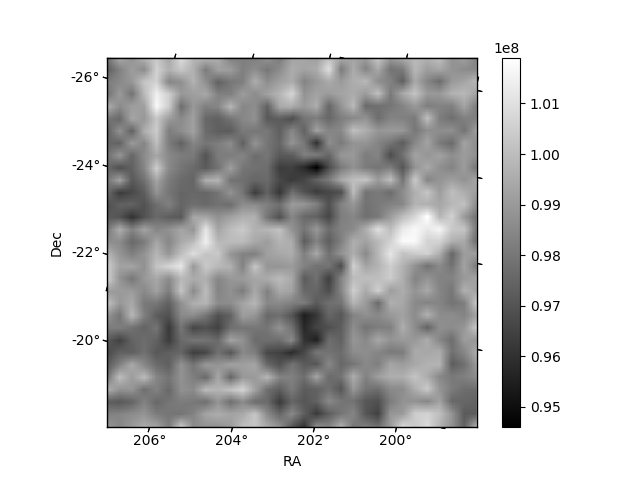
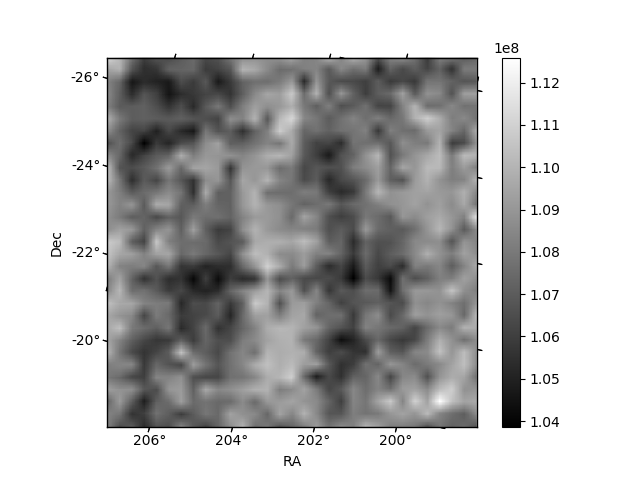
Histogram calculated using DETX and DETY for each event in the final _common_clean file
| Quadrant A | 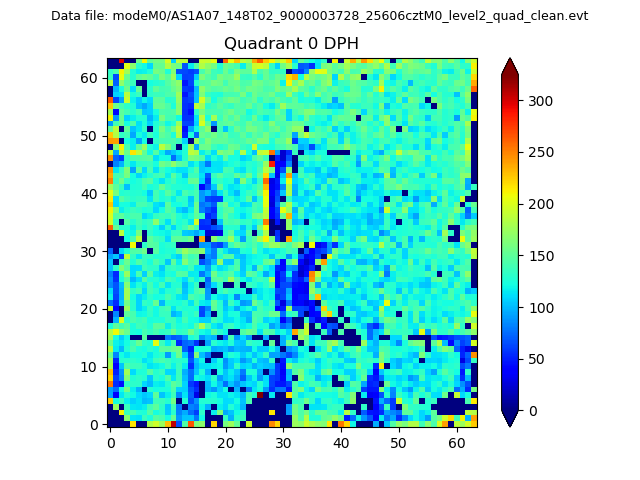 |
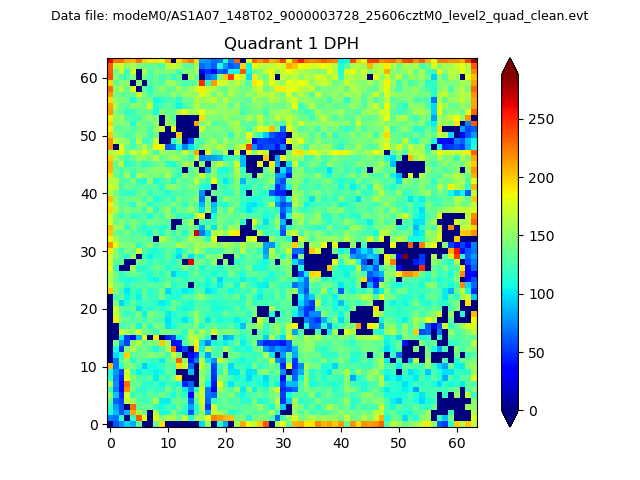 |
Quadrant B |
|---|---|---|---|
| Quadrant D | 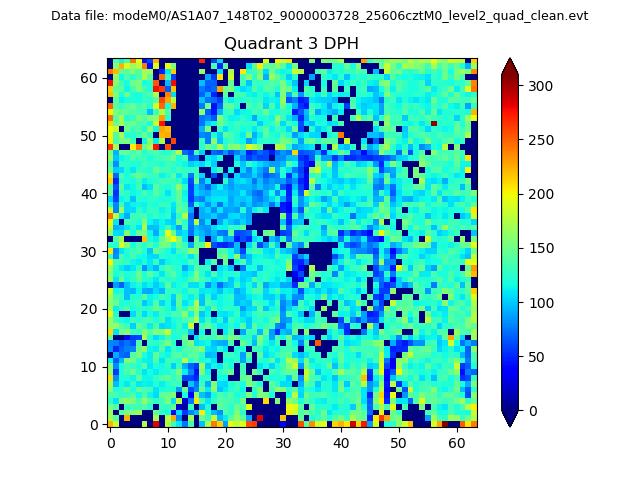 |
 |
Quadrant C |
| Plot type | Count rate plots | Images |
|---|---|---|
| Comparison with Poisson distribution Blue bars denote a histogram of data divided into 1 sec bins. Red curve is a Poisson curve with rate = median count rate of data. |
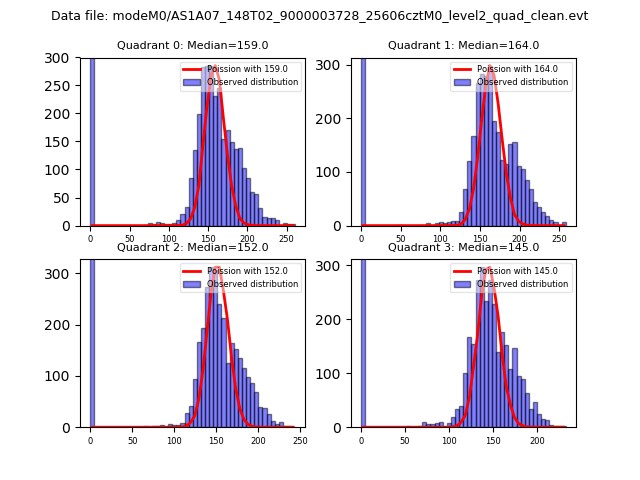 |
 |
| Quadrant-wise count rates Data is divided into 100 sec bins |
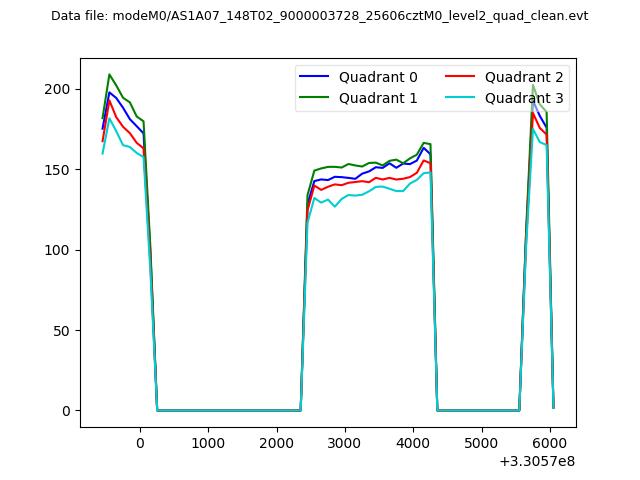 |
|
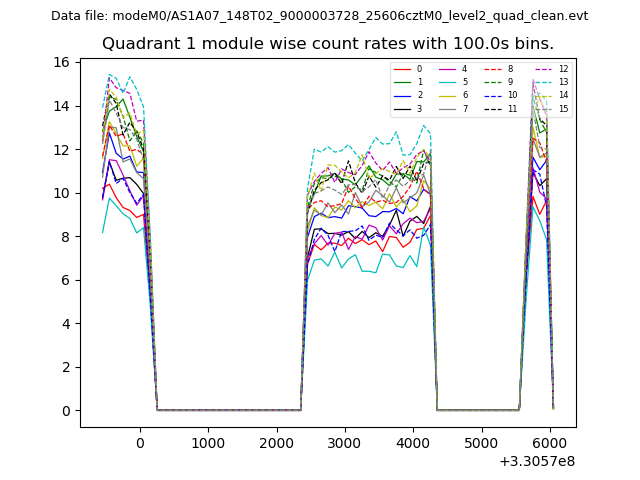
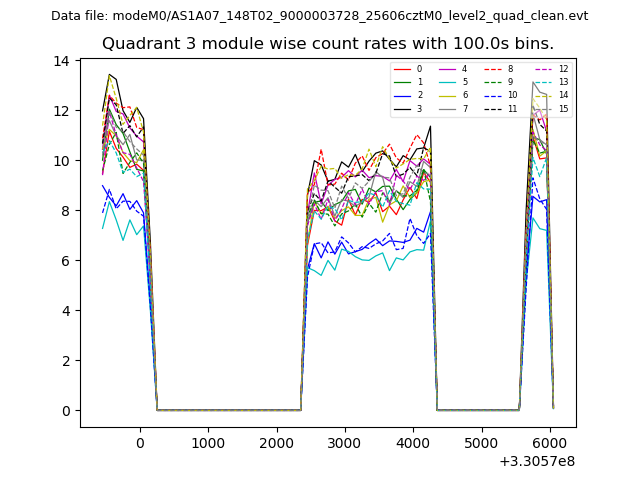
| Module-wise count rates for Quadrant A Data is divided into 100 sec bins |
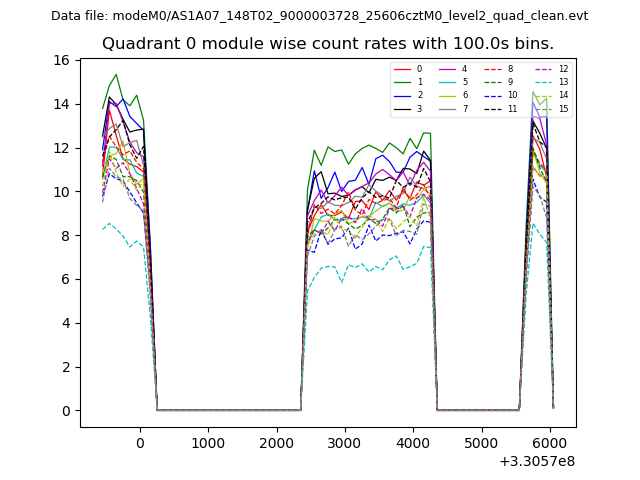 |
 |
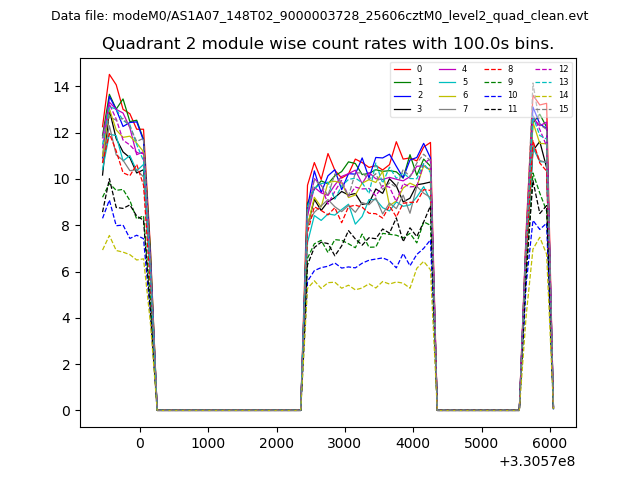
| Module-wise count rates for Quadrant B Data is divided into 100 sec bins |
 |
 |
| Module-wise count rates for Quadrant C Data is divided into 100 sec bins |
 |
 |
| Module-wise count rates for Quadrant D Data is divided into 100 sec bins |
 |
 |
| Parameter | Plot |
|---|---|
| CZT HV Monitor | 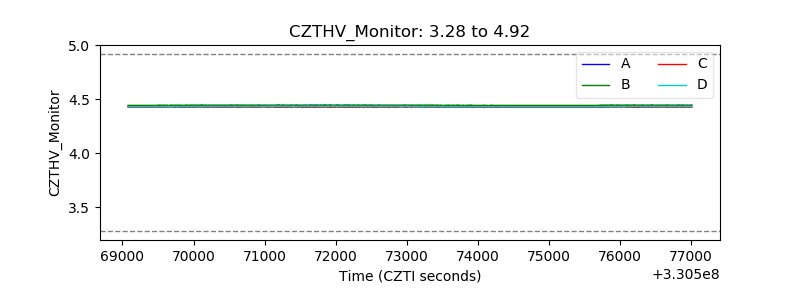 |
| D_VDD | 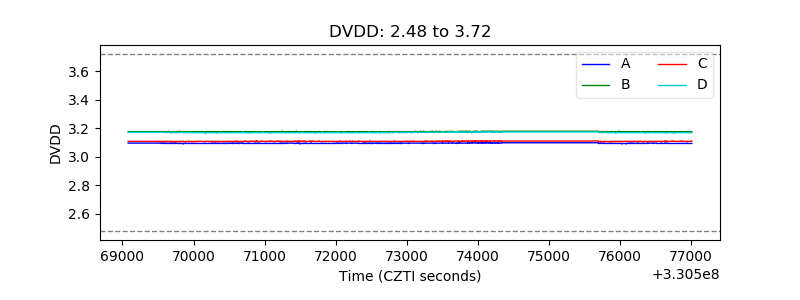 |
| Temperature 1 | 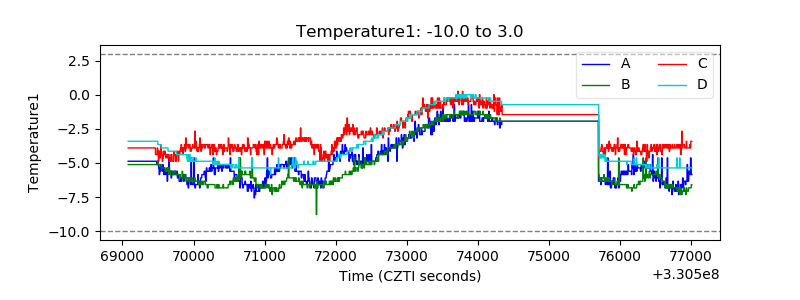 |
| Veto HV Monitor | 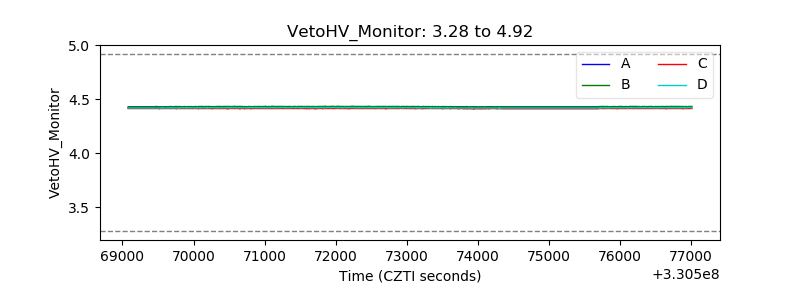 |
| Veto LLD | 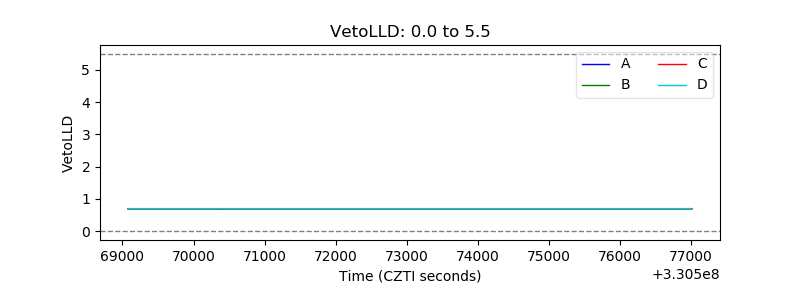 |
| Alpha Counter |  |
| _CPM_Rate | 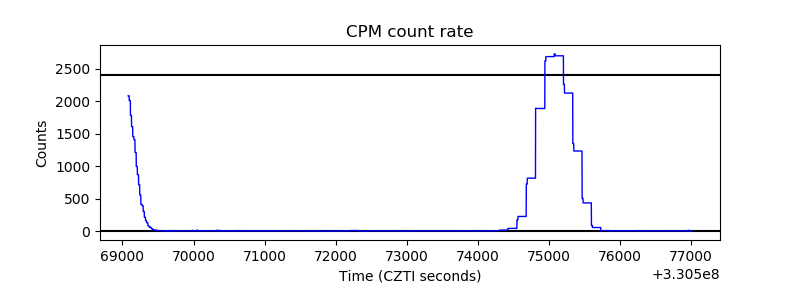 |
| CZT Counter | 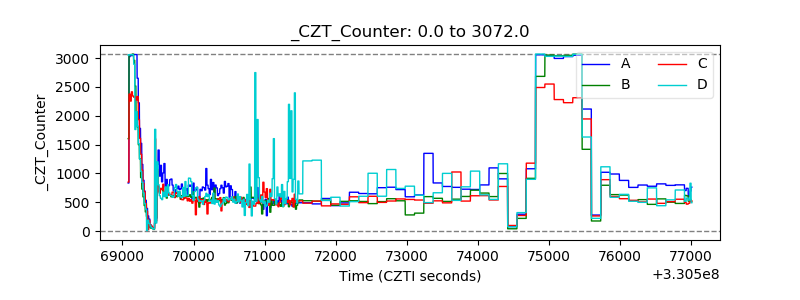 |
| +2.5 Volts monitor |  |
| +5 Volts monitor |  |
| _ROLL_ROT | 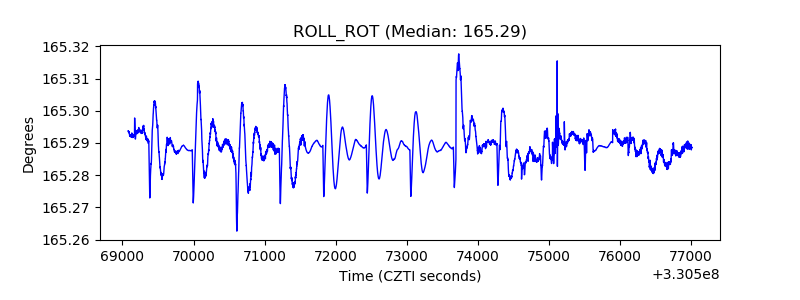 |
| _Roll_DEC | 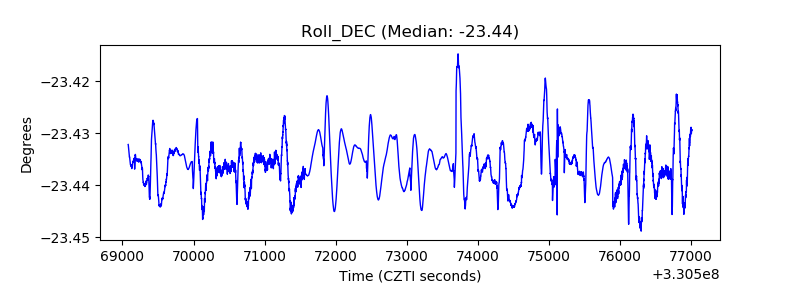 |
| _Roll_RA | 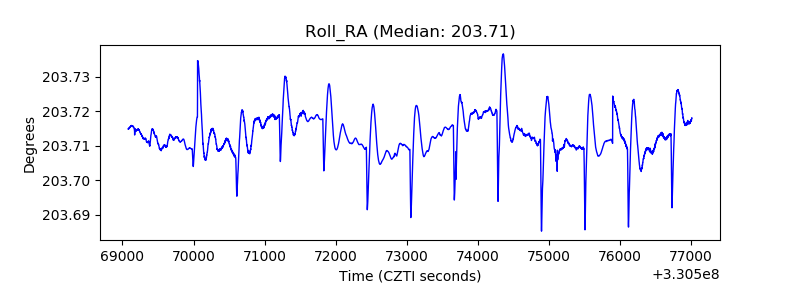 |
| Veto Counter | 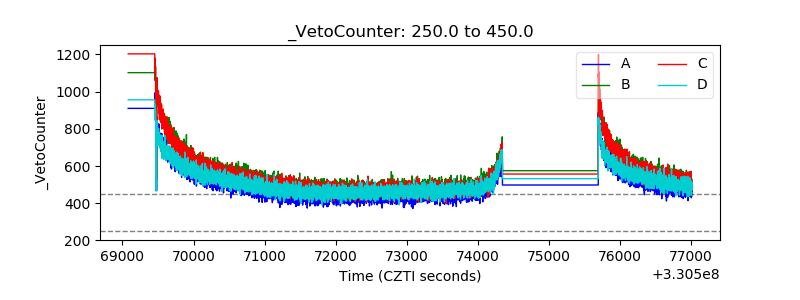 |