| Param | Original file | Final file |
|---|---|---|
| Filename | modeM0/AS1A07_148T02_9000003728_25607cztM0_level2.evt | modeM0/AS1A07_148T02_9000003728_25607cztM0_level2_quad_clean.evt |
| Size (bytes) | 566,101,440 | 68,126,400 |
| Size | 539.9 MB | 65.0 MB |
| Events in quadrant A | 4,884,976 | 408,953 |
| Events in quadrant B | 3,591,408 | 422,510 |
| Events in quadrant C | 3,474,237 | 394,411 |
| Events in quadrant D | 4,748,064 | 377,312 |
| Mode M9 | |||
|---|---|---|---|
| Quadrant | BADHDUFLAG | Total packets | Discarded packets |
| A | 0 | 21 | 0 |
| B | 0 | 22 | 0 |
| C | 0 | 22 | 0 |
| D | 0 | 22 | 0 |
| Mode M0 | |||
|---|---|---|---|
| Quadrant | BADHDUFLAG | Total packets | Discarded packets |
| A | 0 | 19919 | 0 |
| B | 0 | 14310 | 0 |
| C | 0 | 13928 | 0 |
| D | 0 | 18539 | 0 |
| Quadrant | Total seconds | Saturated seconds | Saturation percentage |
|---|---|---|---|
| A | 6588 | 62 | 0.941105% |
| B | 6588 | 33 | 0.500911% |
| C | 6588 | 69 | 1.047359% |
| D | 6588 | 145 | 2.200971% |
Noise dominated data is calculated using 1-second bins in cleaned event files. If a bin has >2000 counts, and if more than 50% of those come from <1% of pixels, then it is considered to be noise-dominated and hence unusable.
| Quadrant | # 1 sec bins | Bins with >0 counts | Bins with >2000 counts | High rate bins dominated by noise | Noise dominated (total time) | Noise dominated (detector-on time) | Marked lightcurve |
|---|---|---|---|---|---|---|---|
| A | 7888 | 6589 | 9 | 9 | 0.11% | 0.14% | 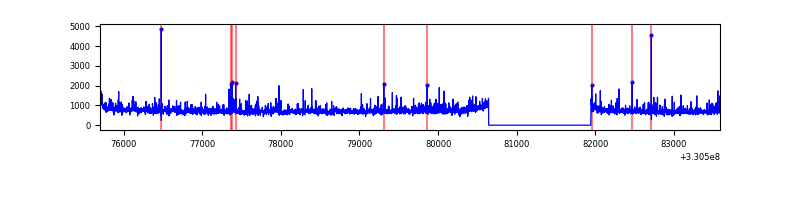 |
| B | 7888 | 6589 | 2 | 2 | 0.03% | 0.03% | 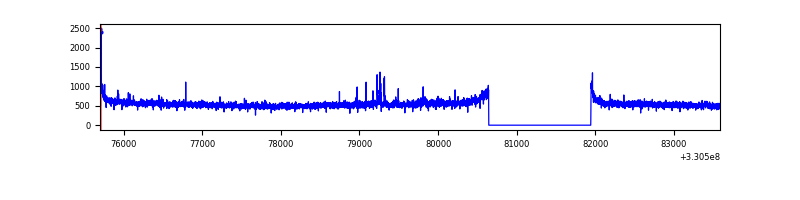 |
| C | 7888 | 6589 | 6 | 6 | 0.08% | 0.09% | 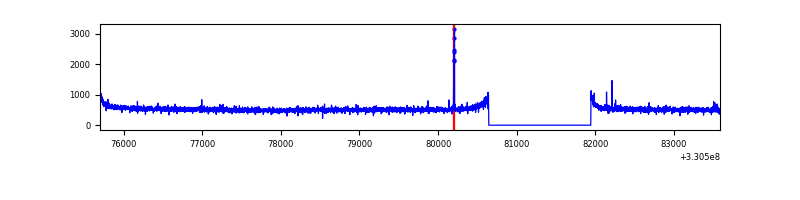 |
| D | 7888 | 6589 | 71 | 71 | 0.90% | 1.08% | 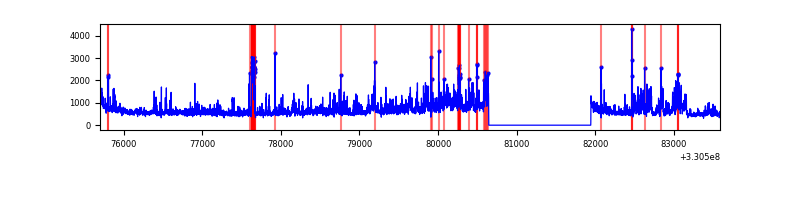 |
Top three noisy pixels from each quadrant. If the there are fewer than three noisy pixels in the level2.evt file, extra rows are filled as -1
| Pixel properties | Quadrant properties | ||||||
|---|---|---|---|---|---|---|---|
| Quadrant | DetID | PixID | Counts | Sigma | Mean | Median | Sigma |
| A | 8 | 192 | 1284432 | 7265.56 | 889 | 876 | 176.7 |
| A | 6 | 16 | 148784 | 837.23 | 889 | 876 | 176.7 |
| A | 0 | 13 | 24996 | 136.53 | 889 | 876 | 176.7 |
| B | 0 | 219 | 58456 | 346.99 | 890 | 871 | 166.0 |
| B | 0 | 190 | 20003 | 115.28 | 890 | 871 | 166.0 |
| B | 12 | 111 | 19626 | 113.01 | 890 | 871 | 166.0 |
| C | 14 | 238 | 136570 | 692.04 | 848 | 856 | 196.1 |
| C | 0 | 207 | 21344 | 104.47 | 848 | 856 | 196.1 |
| C | 3 | 233 | 10097 | 47.12 | 848 | 856 | 196.1 |
| D | 1 | 52 | 1304348 | 6347.97 | 847 | 826 | 205.3 |
| D | 8 | 195 | 142004 | 687.52 | 847 | 826 | 205.3 |
| D | 13 | 174 | 41883 | 199.94 | 847 | 826 | 205.3 |
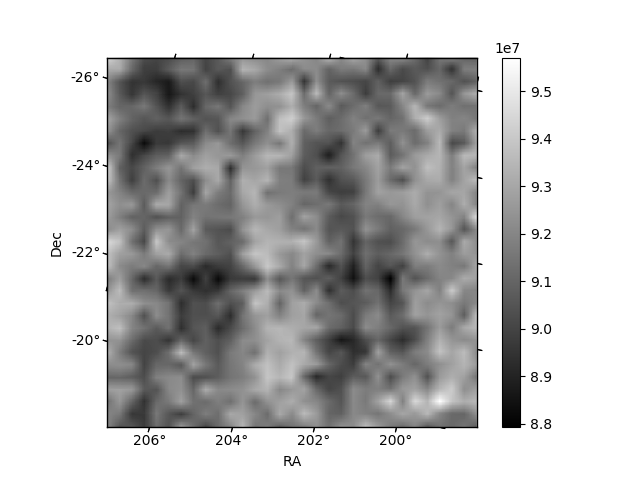
Histogram calculated using DETX and DETY for each event in the final _common_clean file
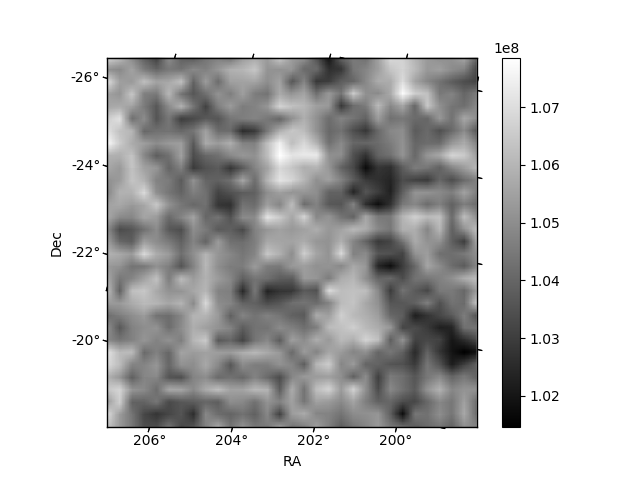
| Quadrant A | 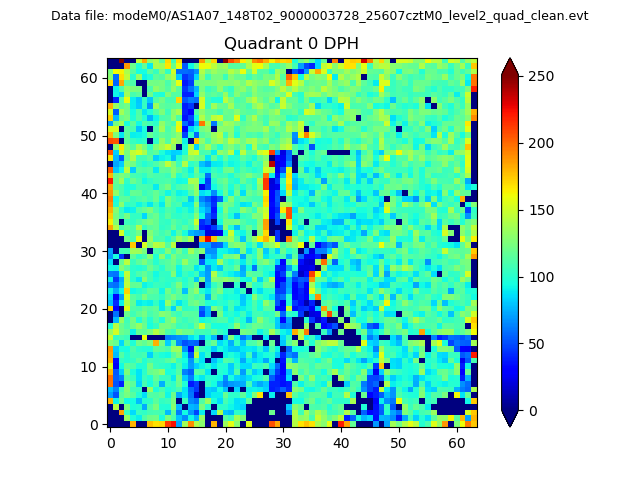 |
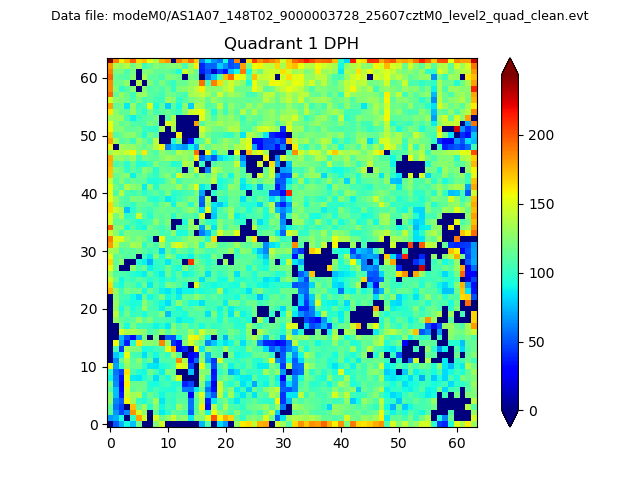 |
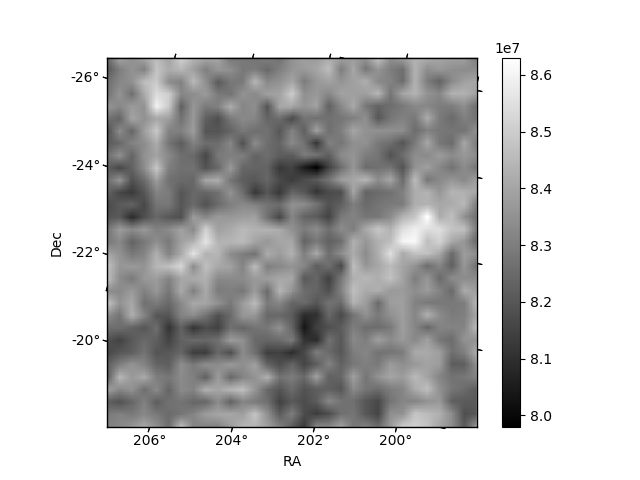
Quadrant B |
|---|---|---|---|
| Quadrant D | 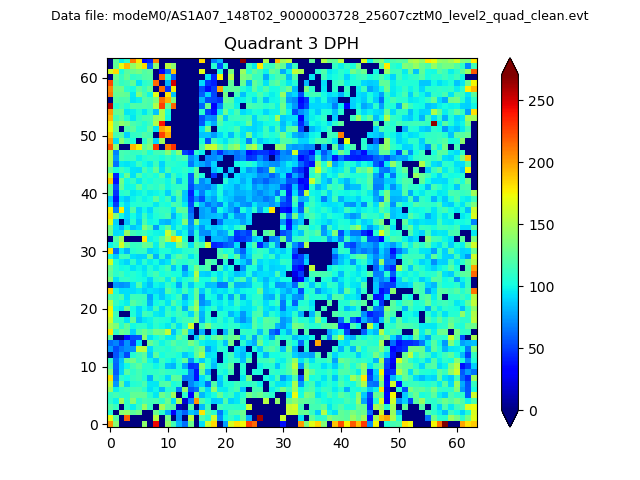 |
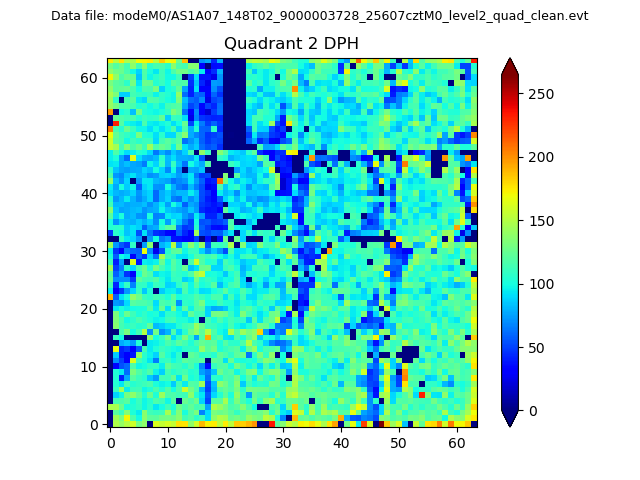 |
Quadrant C |
| Plot type | Count rate plots | Images |
|---|---|---|
| Comparison with Poisson distribution Blue bars denote a histogram of data divided into 1 sec bins. Red curve is a Poisson curve with rate = median count rate of data. |
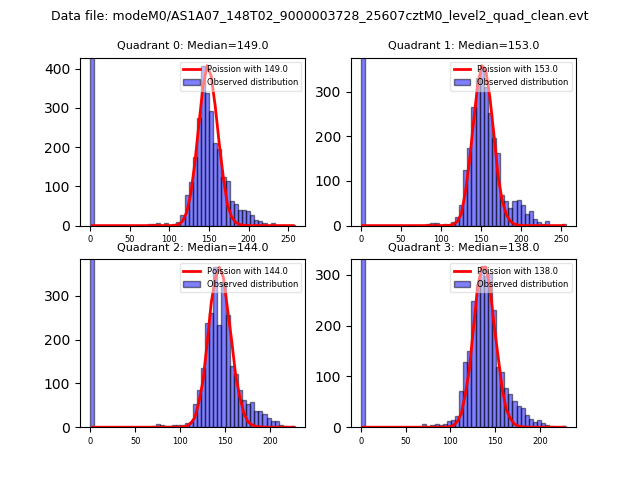 |
 |
| Quadrant-wise count rates Data is divided into 100 sec bins |
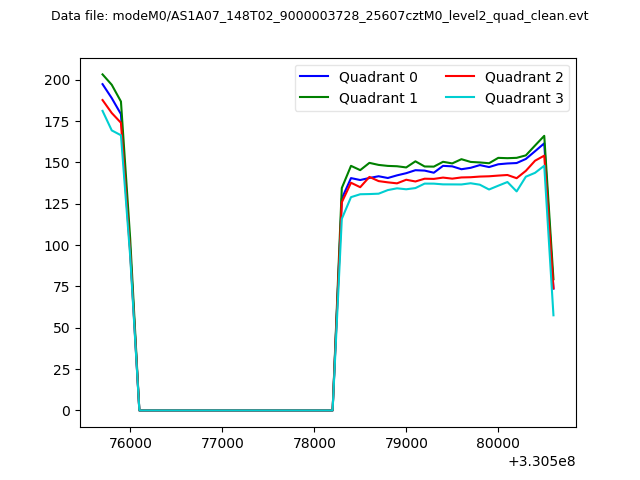 |
|
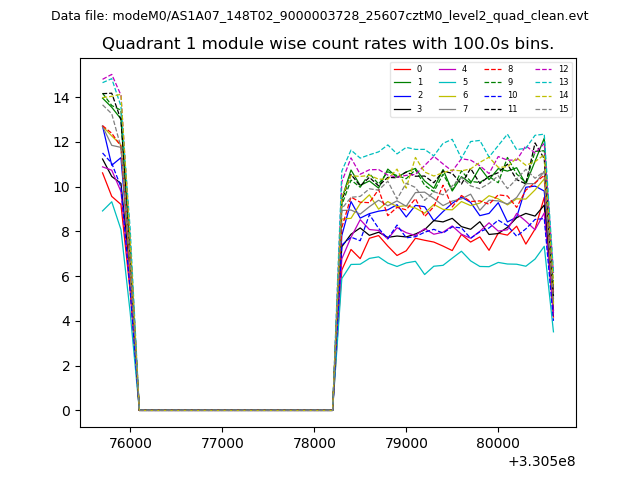
| Module-wise count rates for Quadrant A Data is divided into 100 sec bins |
 |
 |
| Module-wise count rates for Quadrant B Data is divided into 100 sec bins |
 |
 |
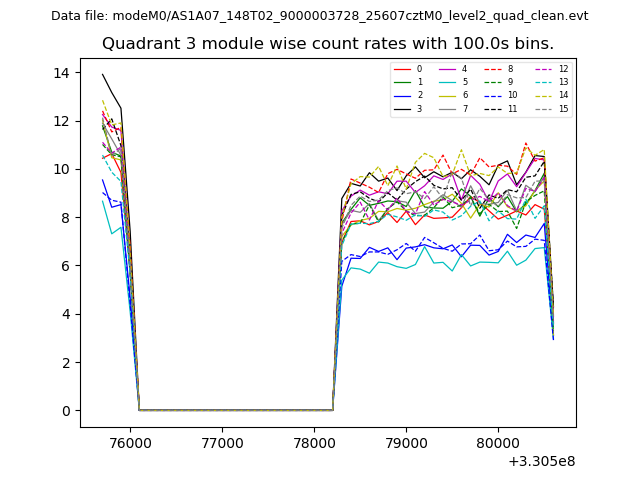
| Module-wise count rates for Quadrant C Data is divided into 100 sec bins |
 |
 |
| Module-wise count rates for Quadrant D Data is divided into 100 sec bins |
 |
 |
| Parameter | Plot |
|---|---|
| CZT HV Monitor |  |
| D_VDD |  |
| Temperature 1 | 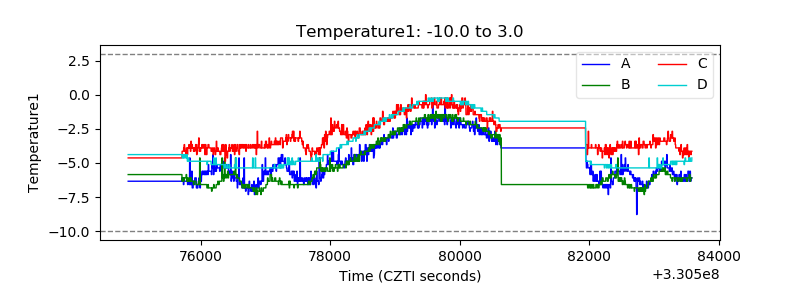 |
| Veto HV Monitor | 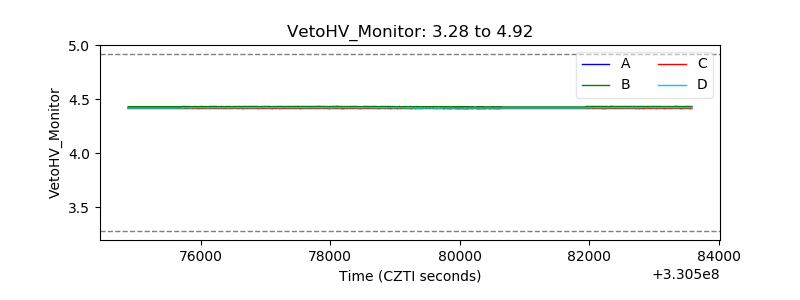 |
| Veto LLD | 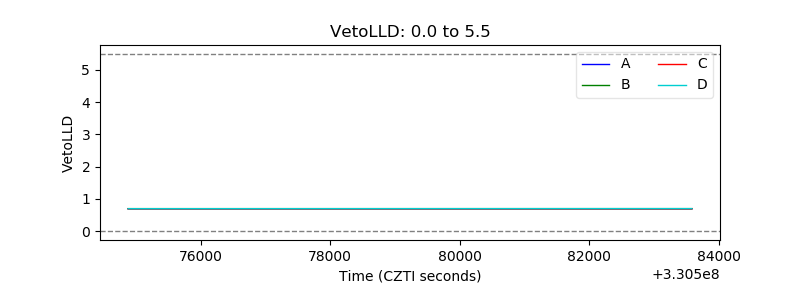 |
| Alpha Counter | 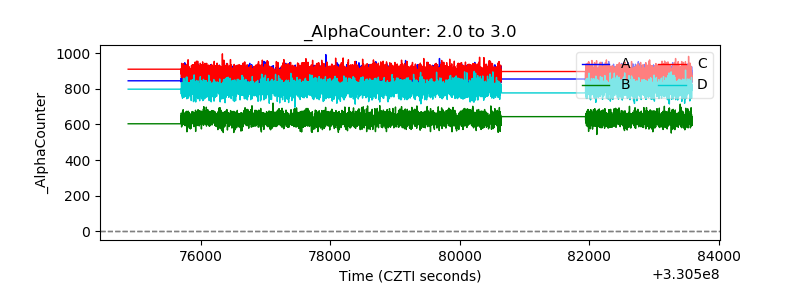 |
| _CPM_Rate | 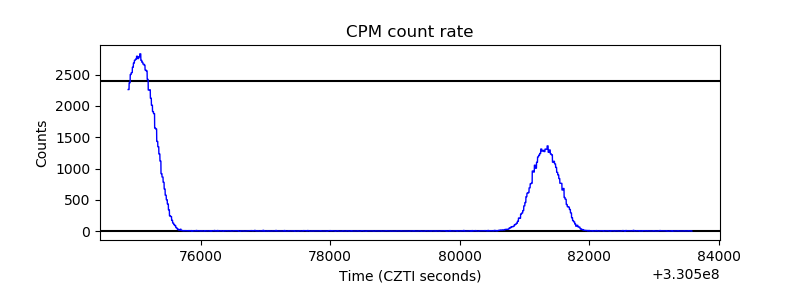 |
| CZT Counter | 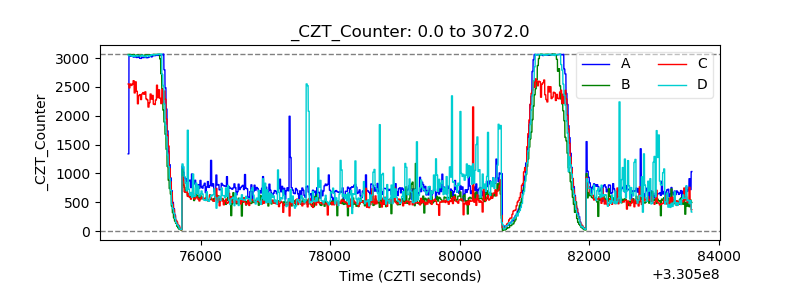 |
| +2.5 Volts monitor |  |
| +5 Volts monitor |  |
| _ROLL_ROT | 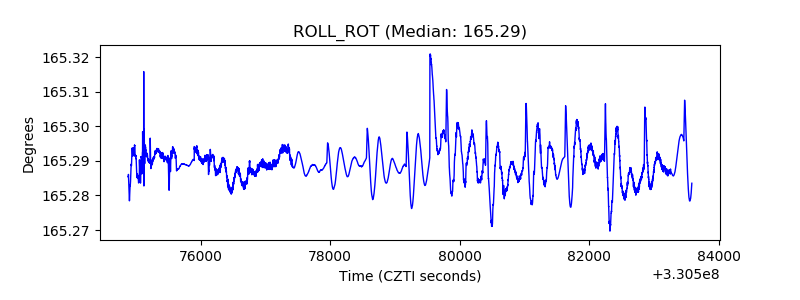 |
| _Roll_DEC | 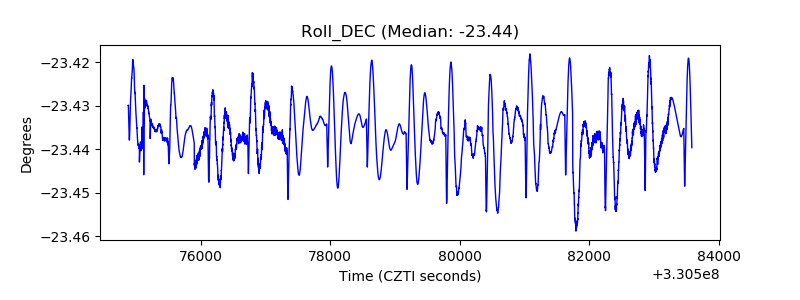 |
| _Roll_RA | 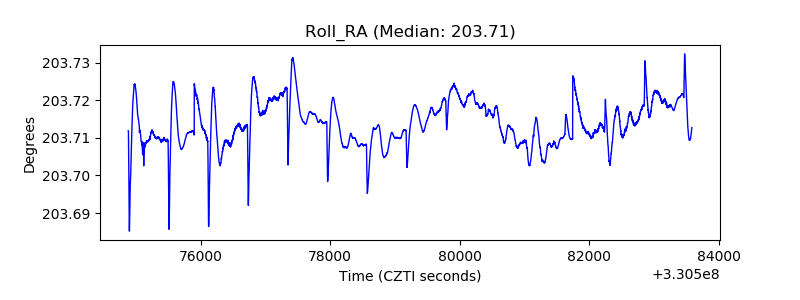 |
| Veto Counter |  |