| Param | Original file | Final file |
|---|---|---|
| Filename | modeM0/AS1A07_148T02_9000003728_25608cztM0_level2.evt | modeM0/AS1A07_148T02_9000003728_25608cztM0_level2_quad_clean.evt |
| Size (bytes) | 561,703,680 | 71,029,440 |
| Size | 535.7 MB | 67.7 MB |
| Events in quadrant A | 4,829,421 | 426,070 |
| Events in quadrant B | 3,639,125 | 436,636 |
| Events in quadrant C | 3,511,787 | 410,351 |
| Events in quadrant D | 4,566,123 | 399,405 |
| Mode M9 | |||
|---|---|---|---|
| Quadrant | BADHDUFLAG | Total packets | Discarded packets |
| A | 0 | 13 | 0 |
| B | 0 | 14 | 0 |
| C | 0 | 14 | 0 |
| D | 0 | 14 | 0 |
| Mode M0 | |||
|---|---|---|---|
| Quadrant | BADHDUFLAG | Total packets | Discarded packets |
| A | 0 | 20148 | 0 |
| B | 0 | 14532 | 0 |
| C | 0 | 14327 | 0 |
| D | 0 | 18051 | 0 |
| Quadrant | Total seconds | Saturated seconds | Saturation percentage |
|---|---|---|---|
| A | 6859 | 98 | 1.428780% |
| B | 6859 | 91 | 1.326724% |
| C | 6859 | 125 | 1.822423% |
| D | 6859 | 123 | 1.793264% |
Noise dominated data is calculated using 1-second bins in cleaned event files. If a bin has >2000 counts, and if more than 50% of those come from <1% of pixels, then it is considered to be noise-dominated and hence unusable.
| Quadrant | # 1 sec bins | Bins with >0 counts | Bins with >2000 counts | High rate bins dominated by noise | Noise dominated (total time) | Noise dominated (detector-on time) | Marked lightcurve |
|---|---|---|---|---|---|---|---|
| A | 7860 | 6860 | 3 | 3 | 0.04% | 0.04% | 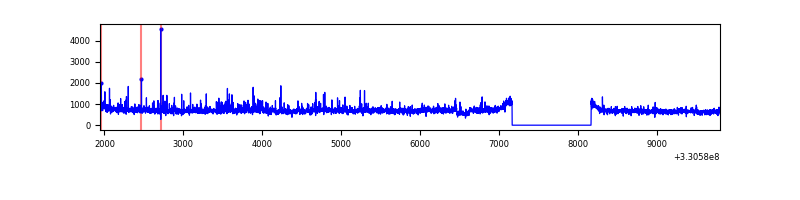 |
| B | 7860 | 6860 | 0 | 0 | 0.00% | 0.00% | 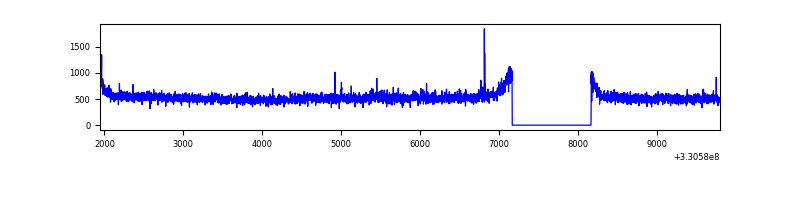 |
| C | 7860 | 6859 | 0 | 0 | 0.00% | 0.00% | 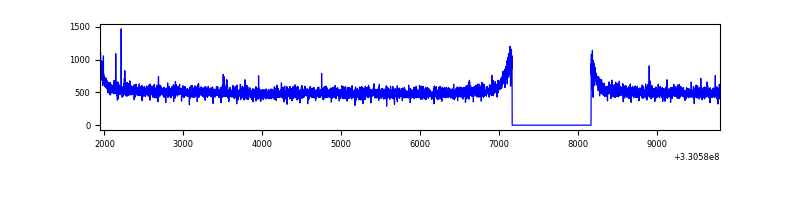 |
| D | 7860 | 6860 | 48 | 48 | 0.61% | 0.70% | 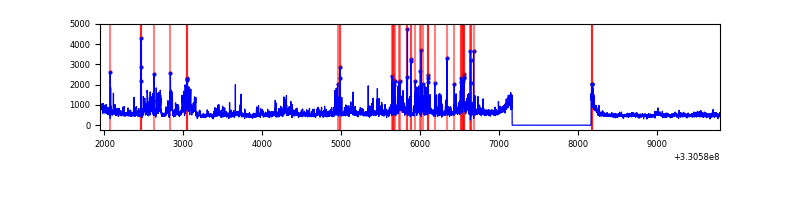 |
Top three noisy pixels from each quadrant. If the there are fewer than three noisy pixels in the level2.evt file, extra rows are filled as -1
| Pixel properties | Quadrant properties | ||||||
|---|---|---|---|---|---|---|---|
| Quadrant | DetID | PixID | Counts | Sigma | Mean | Median | Sigma |
| A | 8 | 192 | 1230742 | 6834.43 | 898 | 884 | 180.0 |
| A | 6 | 16 | 89793 | 494.07 | 898 | 884 | 180.0 |
| A | 0 | 13 | 48042 | 262.06 | 898 | 884 | 180.0 |
| B | 0 | 219 | 77965 | 454.2 | 897 | 878 | 169.7 |
| B | 12 | 111 | 20880 | 117.85 | 897 | 878 | 169.7 |
| B | 0 | 245 | 20386 | 114.94 | 897 | 878 | 169.7 |
| C | 14 | 238 | 137761 | 676.53 | 859 | 865 | 202.4 |
| C | 3 | 233 | 26586 | 127.11 | 859 | 865 | 202.4 |
| C | 13 | 61 | 5972 | 25.24 | 859 | 865 | 202.4 |
| D | 1 | 52 | 731546 | 3464.74 | 863 | 838 | 210.9 |
| D | 12 | 2 | 178227 | 841.11 | 863 | 838 | 210.9 |
| D | 8 | 195 | 166127 | 783.74 | 863 | 838 | 210.9 |
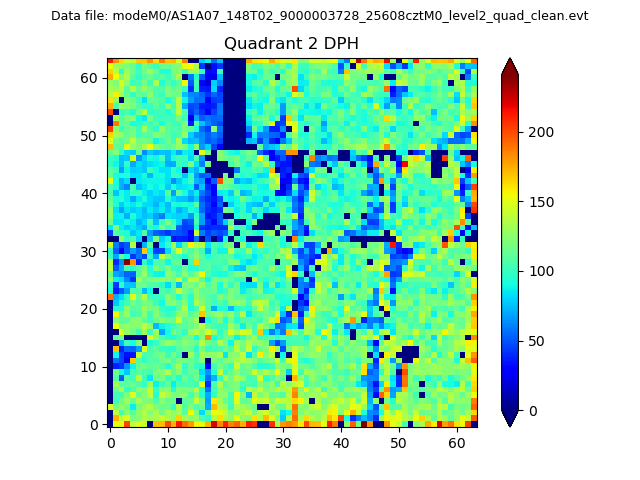
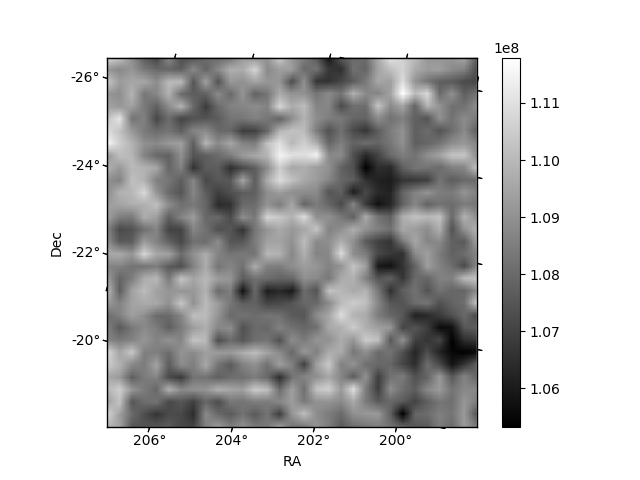
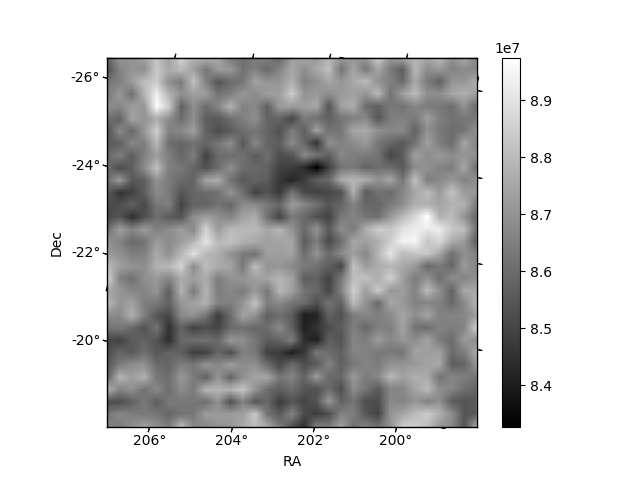
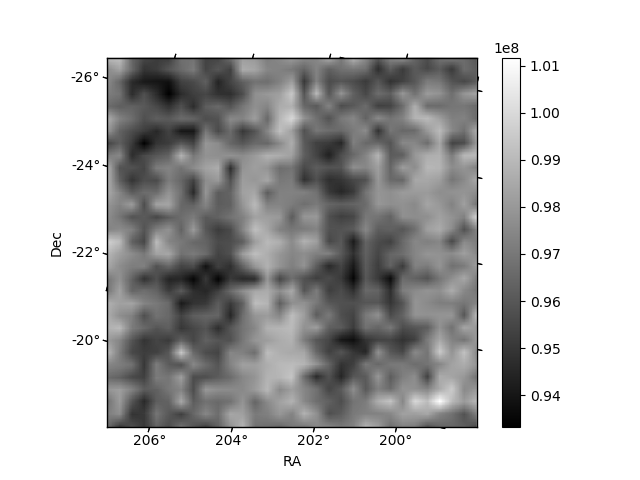
Histogram calculated using DETX and DETY for each event in the final _common_clean file
| Quadrant A | 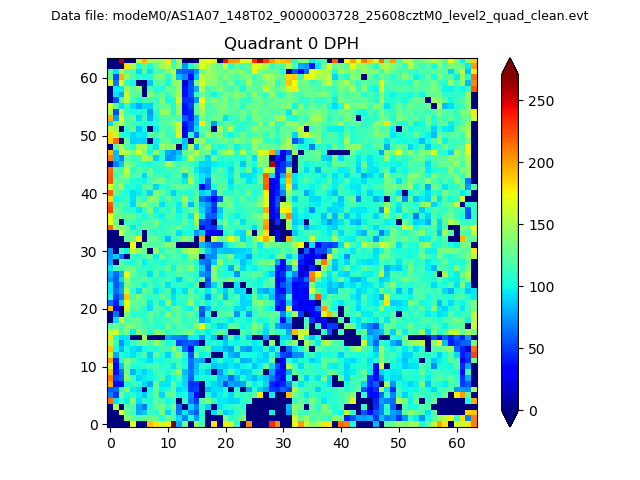 |
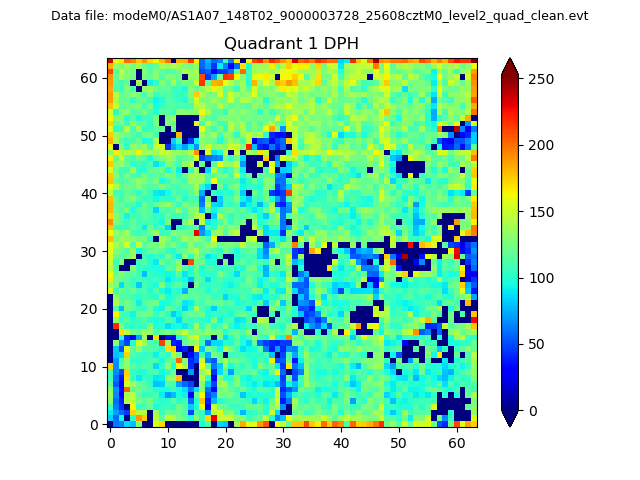 |
Quadrant B |
|---|---|---|---|
| Quadrant D | 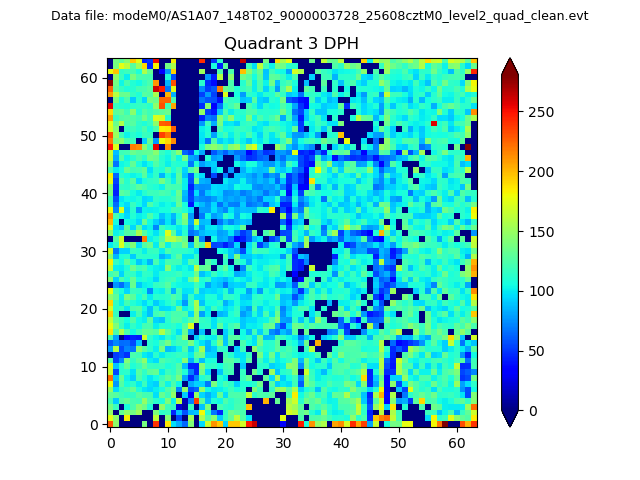 |
 |
Quadrant C |
| Plot type | Count rate plots | Images |
|---|---|---|
| Comparison with Poisson distribution Blue bars denote a histogram of data divided into 1 sec bins. Red curve is a Poisson curve with rate = median count rate of data. |
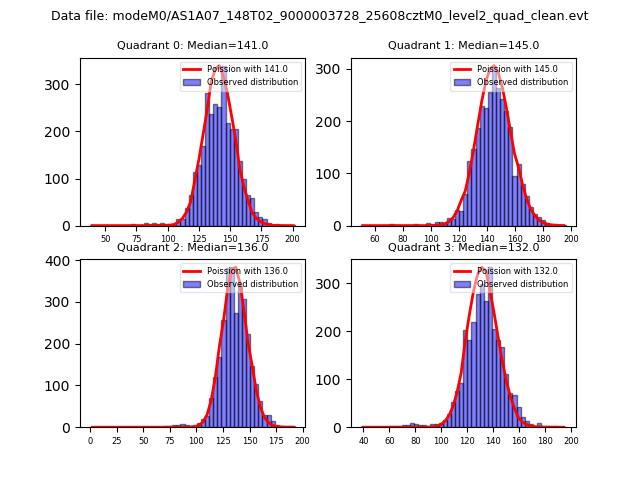 |
 |
| Quadrant-wise count rates Data is divided into 100 sec bins |
 |
|
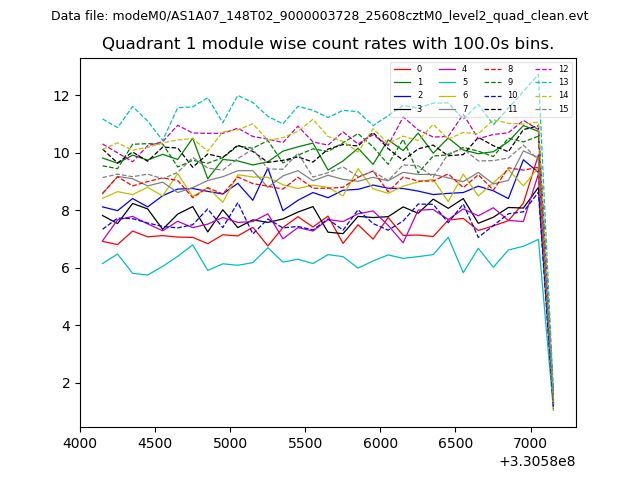
| Module-wise count rates for Quadrant A Data is divided into 100 sec bins |
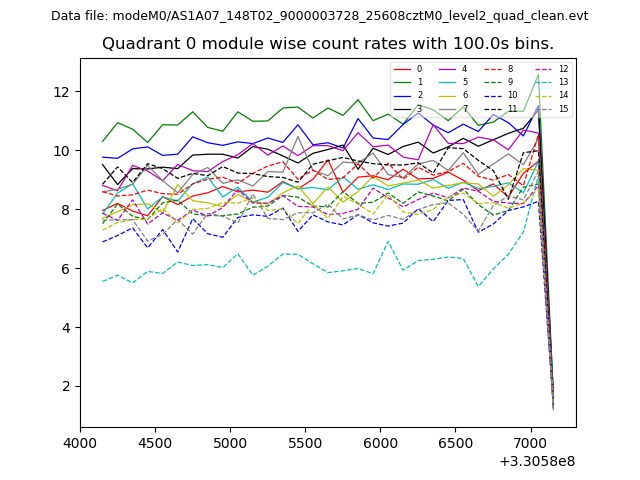 |
 |
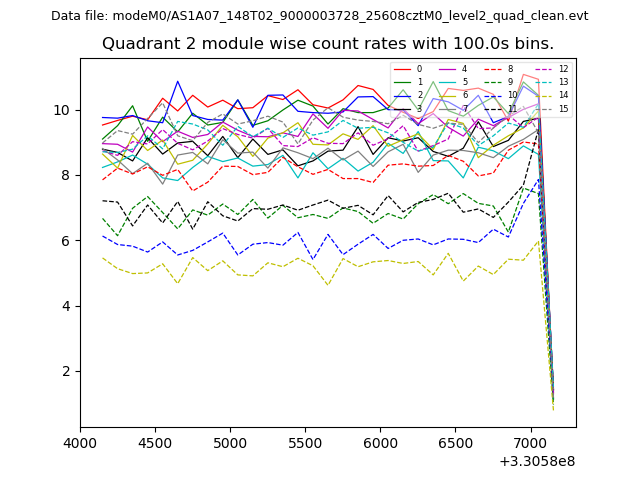
| Module-wise count rates for Quadrant B Data is divided into 100 sec bins |
 |
 |
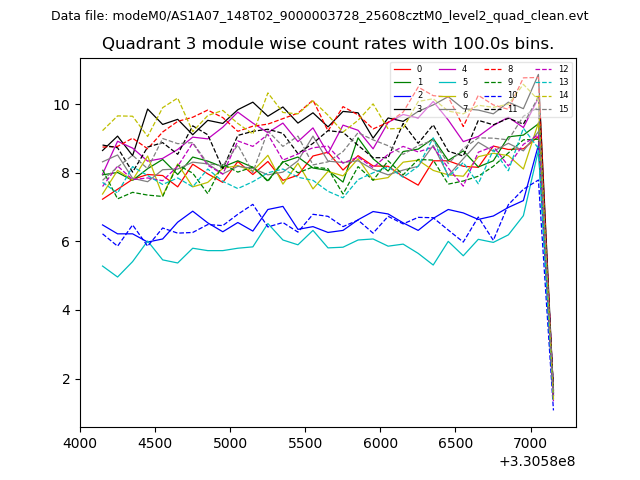
| Module-wise count rates for Quadrant C Data is divided into 100 sec bins |
 |
 |
| Module-wise count rates for Quadrant D Data is divided into 100 sec bins |
 |
 |
| Parameter | Plot |
|---|---|
| CZT HV Monitor | 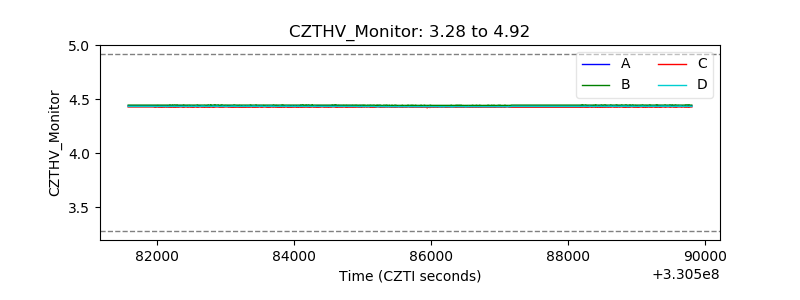 |
| D_VDD | 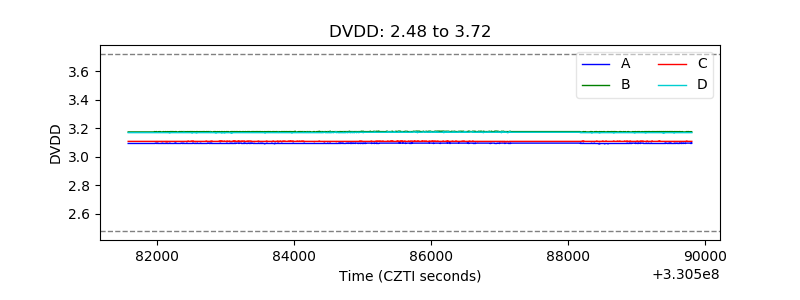 |
| Temperature 1 | 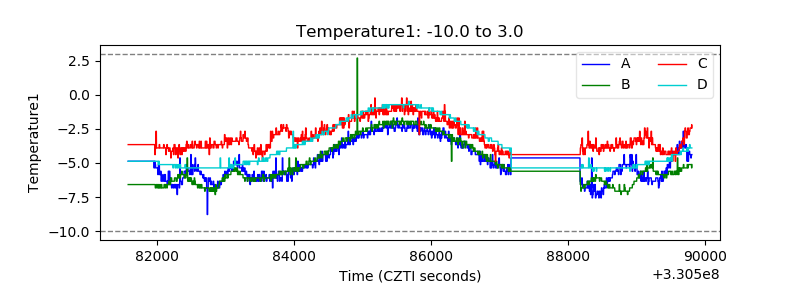 |
| Veto HV Monitor | 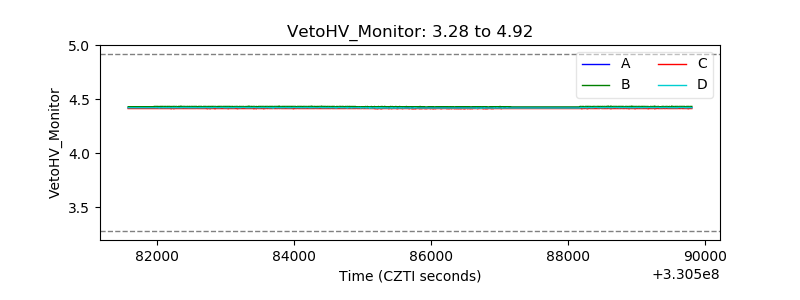 |
| Veto LLD | 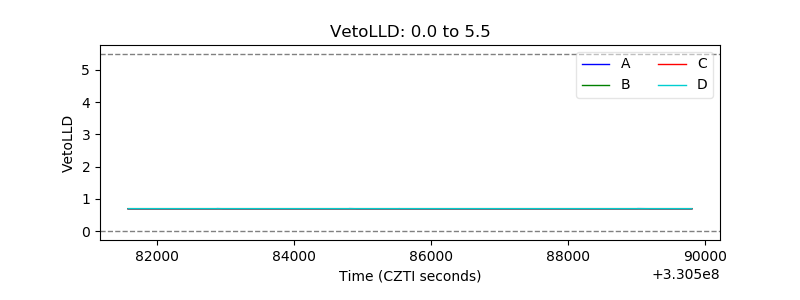 |
| Alpha Counter | 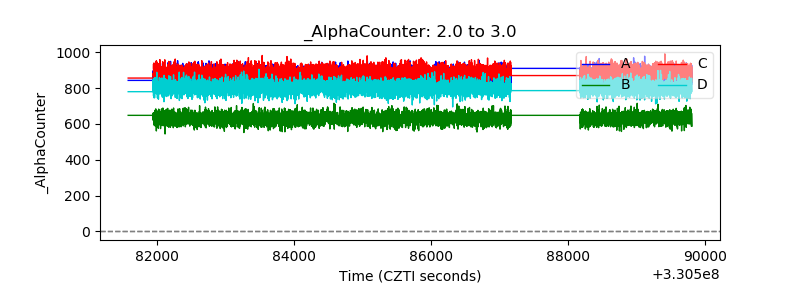 |
| _CPM_Rate | 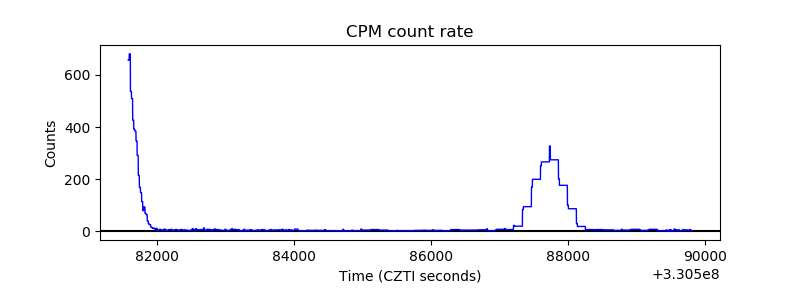 |
| CZT Counter | 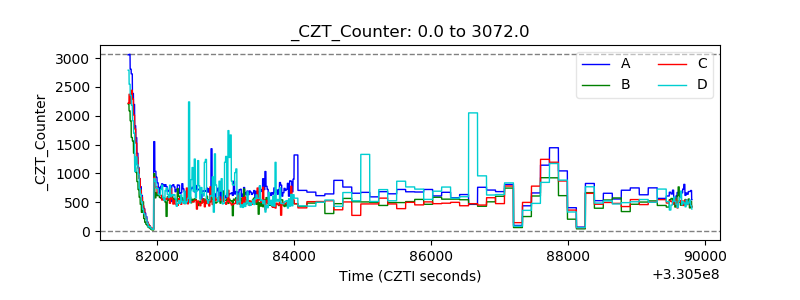 |
| +2.5 Volts monitor |  |
| +5 Volts monitor |  |
| _ROLL_ROT | 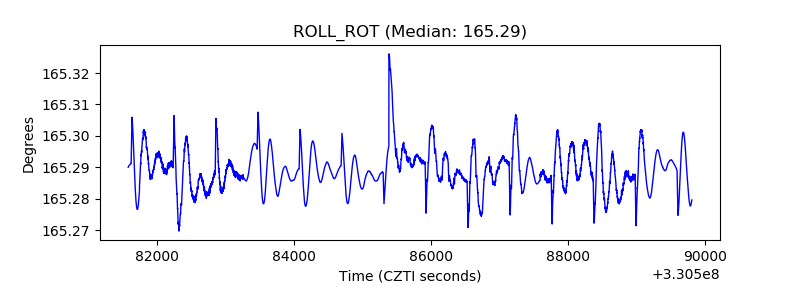 |
| _Roll_DEC | 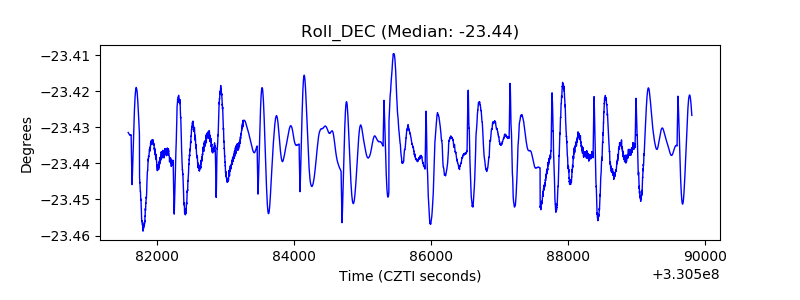 |
| _Roll_RA | 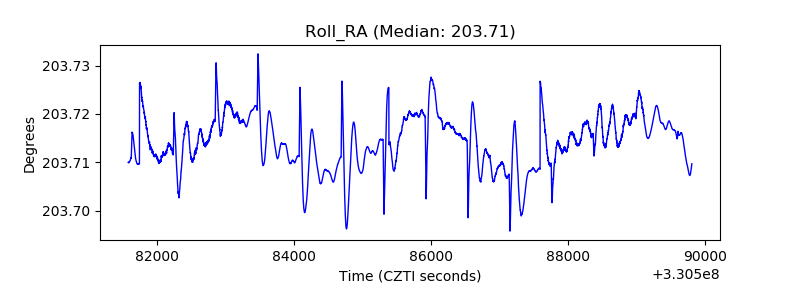 |
| Veto Counter | 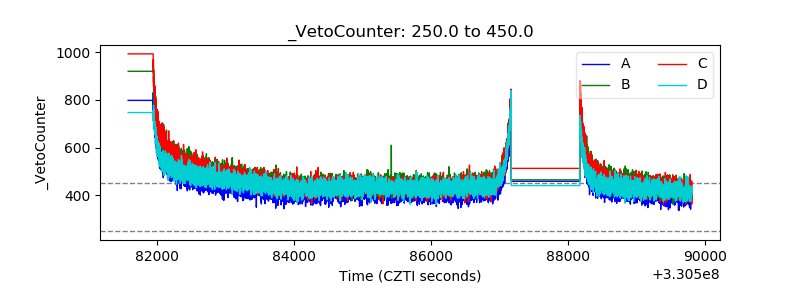 |