| Param | Original file | Final file |
|---|---|---|
| Filename | modeM0/AS1A07_148T02_9000003728_25610cztM0_level2.evt | modeM0/AS1A07_148T02_9000003728_25610cztM0_level2_quad_clean.evt |
| Size (bytes) | 655,565,760 | 95,022,720 |
| Size | 625.2 MB | 90.6 MB |
| Events in quadrant A | 5,541,189 | 585,507 |
| Events in quadrant B | 4,280,874 | 599,131 |
| Events in quadrant C | 4,197,297 | 565,176 |
| Events in quadrant D | 5,268,103 | 547,425 |
| Mode M9 | |||
|---|---|---|---|
| Quadrant | BADHDUFLAG | Total packets | Discarded packets |
| A | 0 | 6 | 0 |
| B | 0 | 6 | 0 |
| C | 0 | 6 | 0 |
| D | 0 | 6 | 0 |
| Mode M0 | |||
|---|---|---|---|
| Quadrant | BADHDUFLAG | Total packets | Discarded packets |
| A | 0 | 22460 | 0 |
| B | 0 | 17687 | 0 |
| C | 0 | 17626 | 0 |
| D | 0 | 20772 | 0 |
| Quadrant | Total seconds | Saturated seconds | Saturation percentage |
|---|---|---|---|
| A | 8349 | 573 | 6.863097% |
| B | 8349 | 447 | 5.353935% |
| C | 8349 | 471 | 5.641394% |
| D | 8349 | 595 | 7.126602% |
Noise dominated data is calculated using 1-second bins in cleaned event files. If a bin has >2000 counts, and if more than 50% of those come from <1% of pixels, then it is considered to be noise-dominated and hence unusable.
| Quadrant | # 1 sec bins | Bins with >0 counts | Bins with >2000 counts | High rate bins dominated by noise | Noise dominated (total time) | Noise dominated (detector-on time) | Marked lightcurve |
|---|---|---|---|---|---|---|---|
| A | 9029 | 8352 | 71 | 71 | 0.79% | 0.85% | 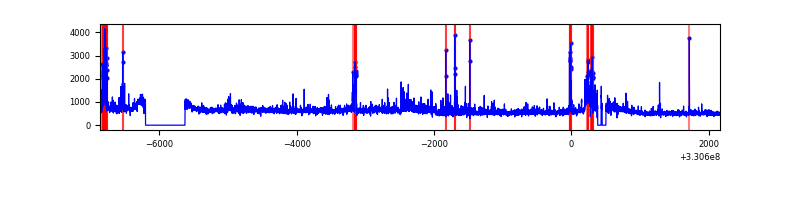 |
| B | 9029 | 8352 | 2 | 2 | 0.02% | 0.02% | 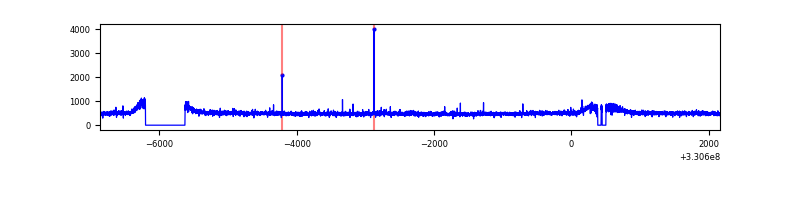 |
| C | 9029 | 8352 | 0 | 0 | 0.00% | 0.00% | 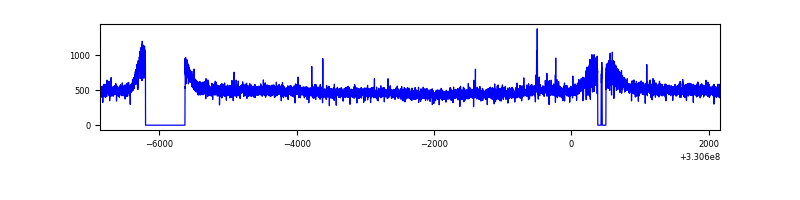 |
| D | 9029 | 8352 | 215 | 215 | 2.38% | 2.57% | 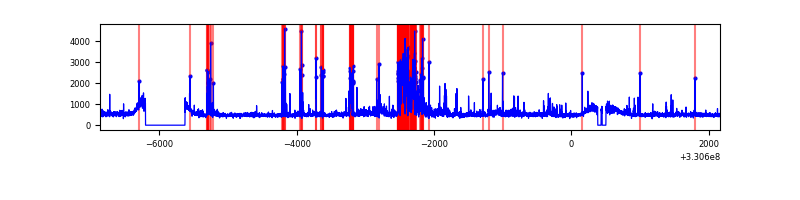 |
Top three noisy pixels from each quadrant. If the there are fewer than three noisy pixels in the level2.evt file, extra rows are filled as -1
| Pixel properties | Quadrant properties | ||||||
|---|---|---|---|---|---|---|---|
| Quadrant | DetID | PixID | Counts | Sigma | Mean | Median | Sigma |
| A | 8 | 192 | 891697 | 4154.73 | 1064 | 1041 | 214.4 |
| A | 0 | 13 | 382685 | 1780.29 | 1064 | 1041 | 214.4 |
| A | 6 | 16 | 80962 | 372.82 | 1064 | 1041 | 214.4 |
| B | 0 | 219 | 47899 | 225.32 | 1071 | 1041 | 208.0 |
| B | 12 | 111 | 26053 | 120.27 | 1071 | 1041 | 208.0 |
| B | 11 | 111 | 23647 | 108.7 | 1071 | 1041 | 208.0 |
| C | 14 | 238 | 161625 | 659.67 | 1030 | 1035 | 243.4 |
| C | 3 | 233 | 23668 | 92.97 | 1030 | 1035 | 243.4 |
| C | 13 | 61 | 7002 | 24.51 | 1030 | 1035 | 243.4 |
| D | 1 | 52 | 913109 | 3593.94 | 1041 | 1009 | 253.8 |
| D | 8 | 195 | 192195 | 753.33 | 1041 | 1009 | 253.8 |
| D | 13 | 174 | 137706 | 538.63 | 1041 | 1009 | 253.8 |
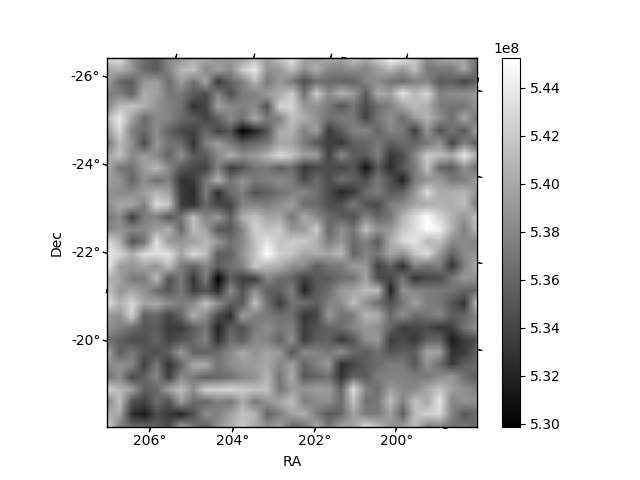
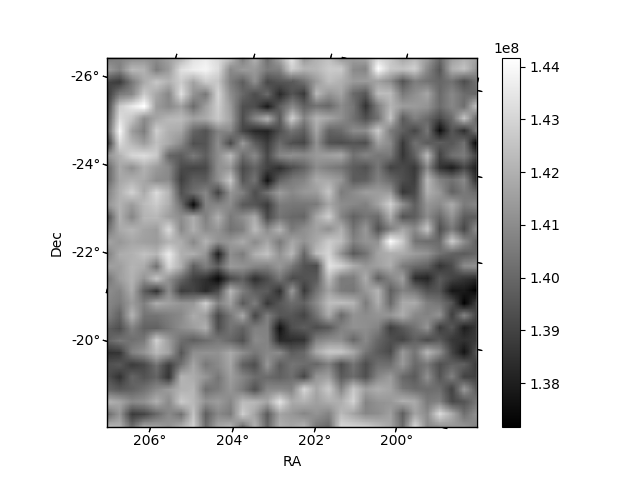
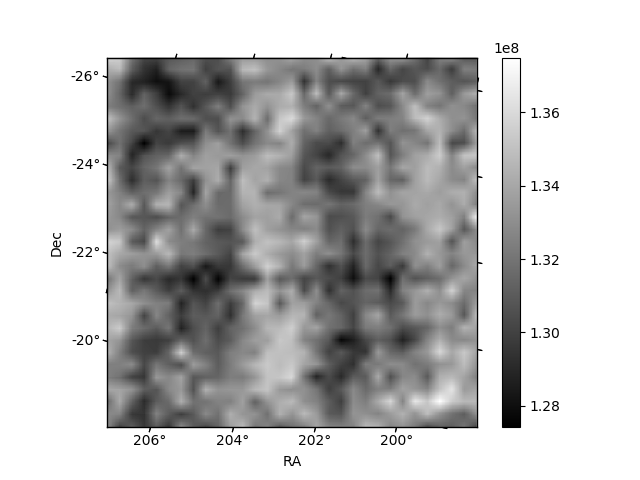
Histogram calculated using DETX and DETY for each event in the final _common_clean file
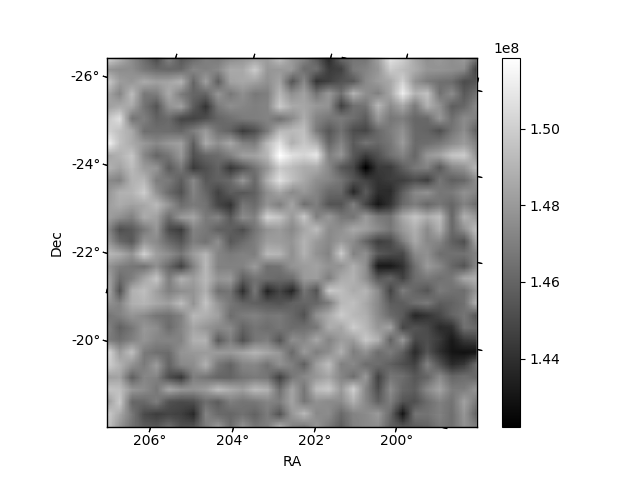
| Quadrant A | 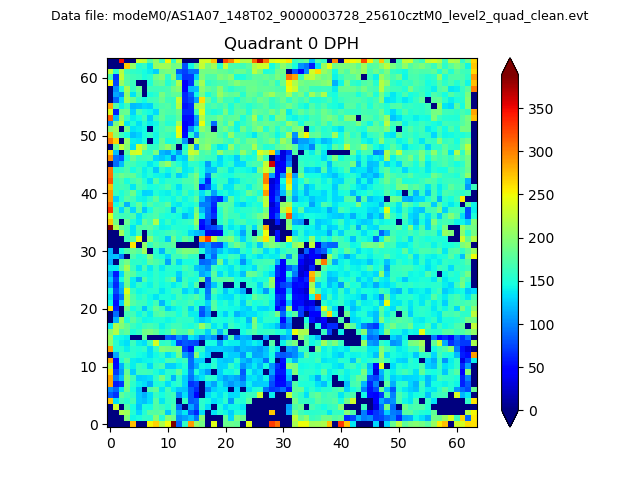 |
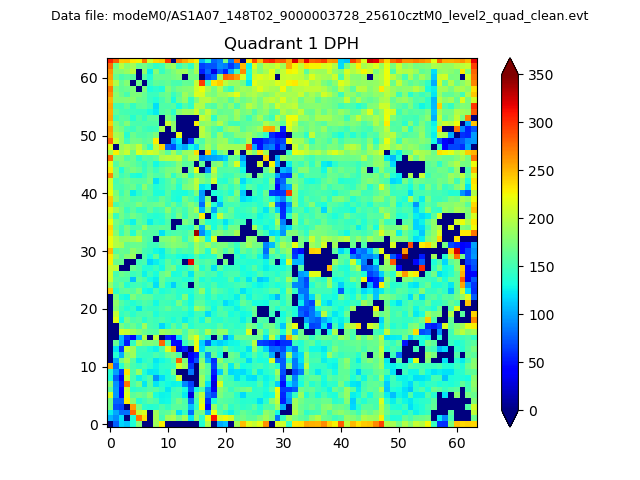 |
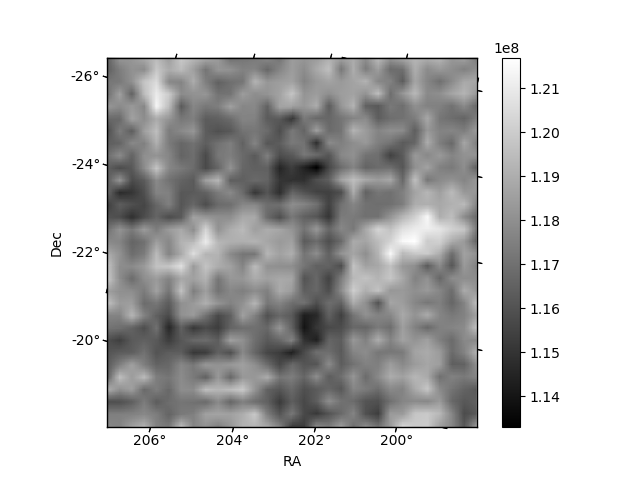
Quadrant B |
|---|---|---|---|
| Quadrant D |  |
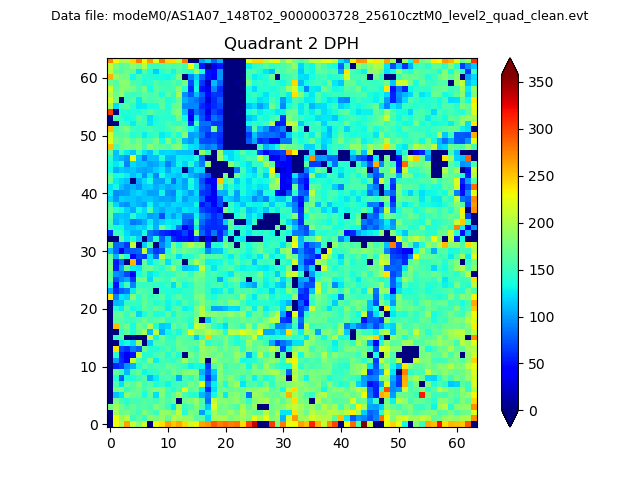 |
Quadrant C |
| Plot type | Count rate plots | Images |
|---|---|---|
| Comparison with Poisson distribution Blue bars denote a histogram of data divided into 1 sec bins. Red curve is a Poisson curve with rate = median count rate of data. |
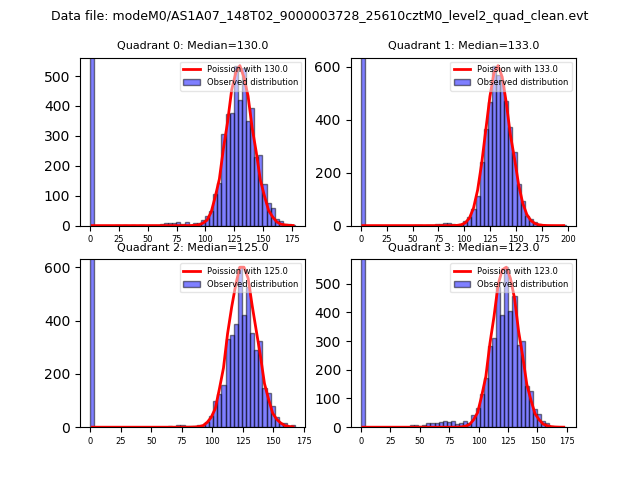 |
 |
| Quadrant-wise count rates Data is divided into 100 sec bins |
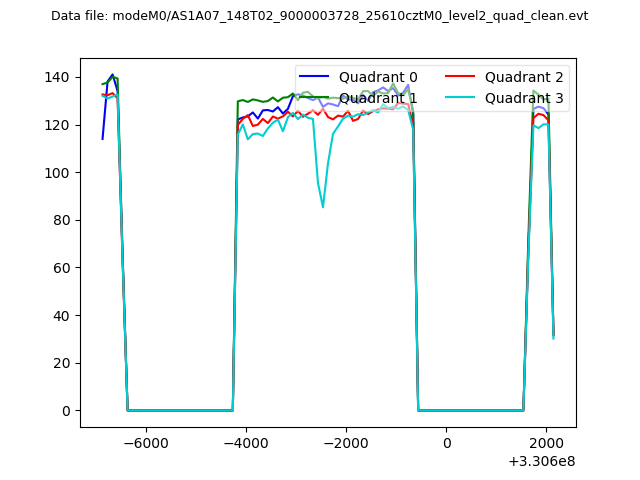 |
|
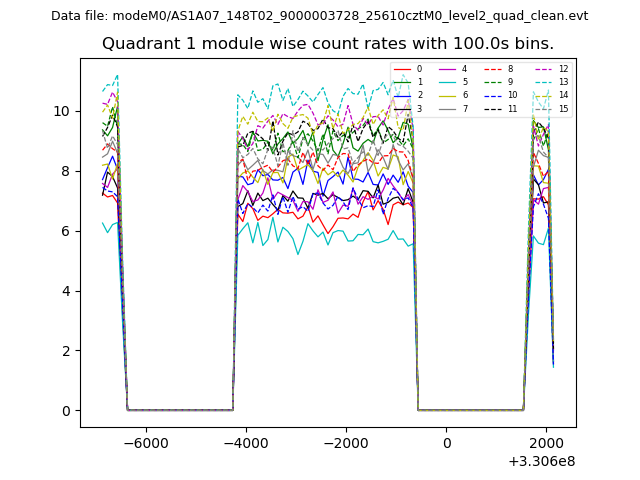
| Module-wise count rates for Quadrant A Data is divided into 100 sec bins |
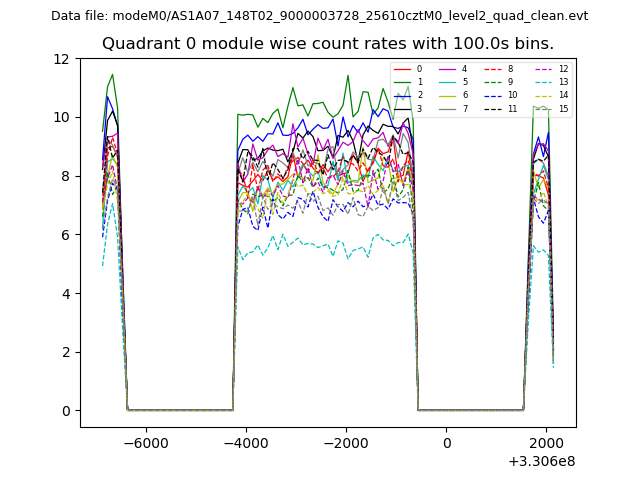 |
 |
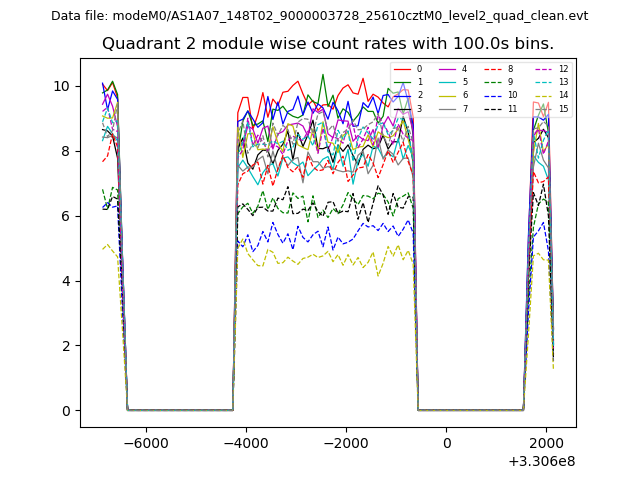
| Module-wise count rates for Quadrant B Data is divided into 100 sec bins |
 |
 |
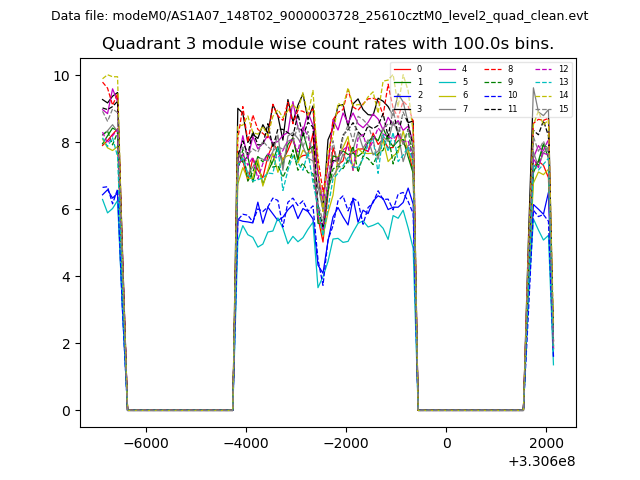
| Module-wise count rates for Quadrant C Data is divided into 100 sec bins |
 |
 |
| Module-wise count rates for Quadrant D Data is divided into 100 sec bins |
 |
 |
| Parameter | Plot |
|---|---|
| CZT HV Monitor | 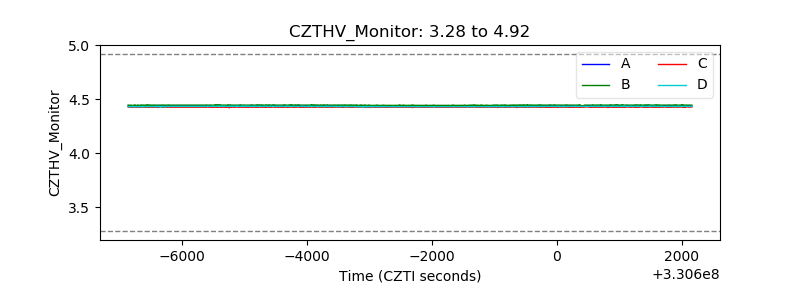 |
| D_VDD | 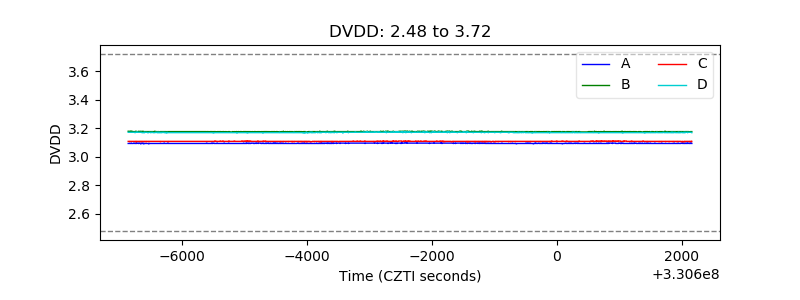 |
| Temperature 1 | 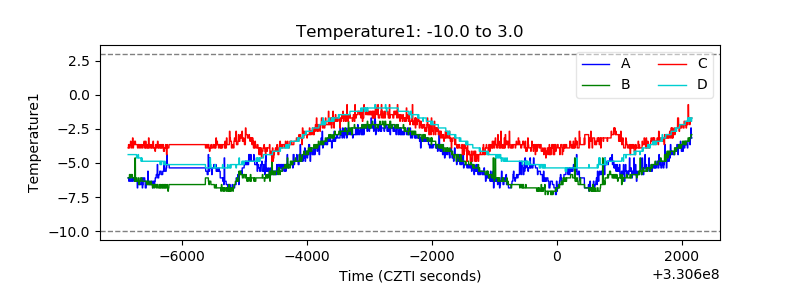 |
| Veto HV Monitor | 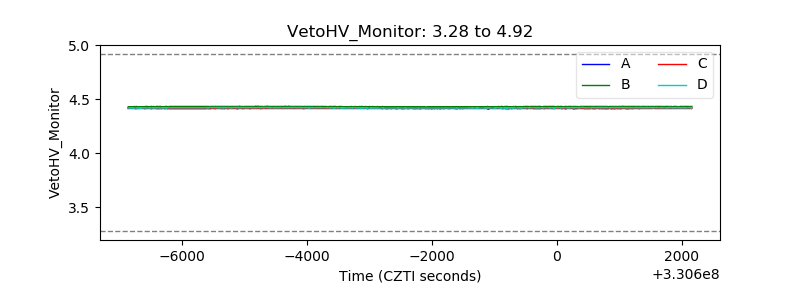 |
| Veto LLD | 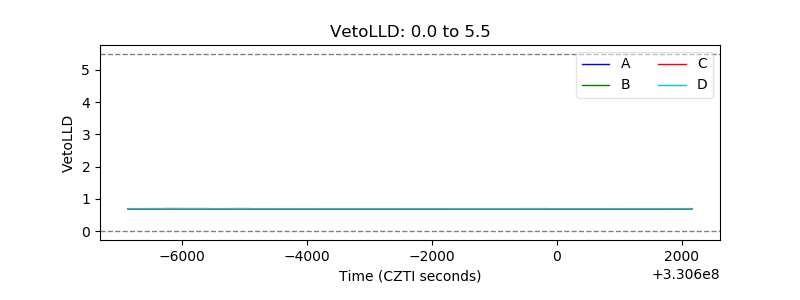 |
| Alpha Counter | 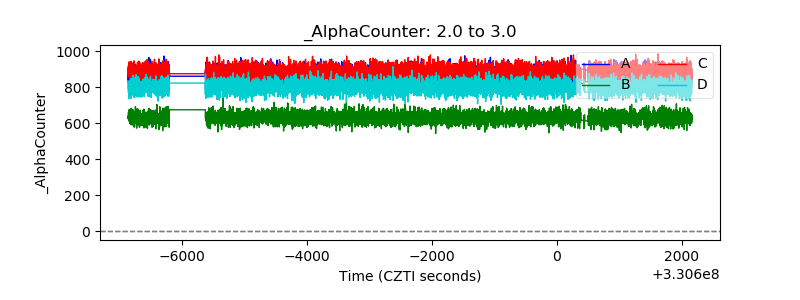 |
| _CPM_Rate | 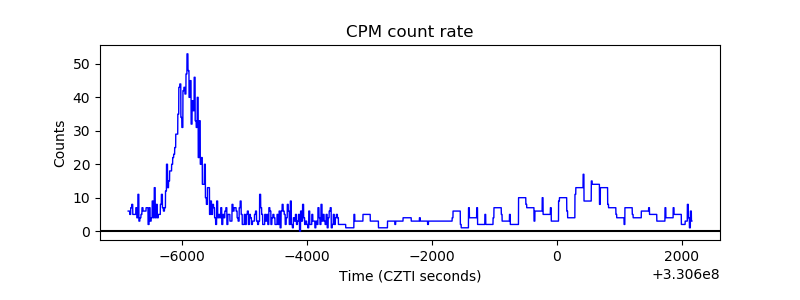 |
| CZT Counter | 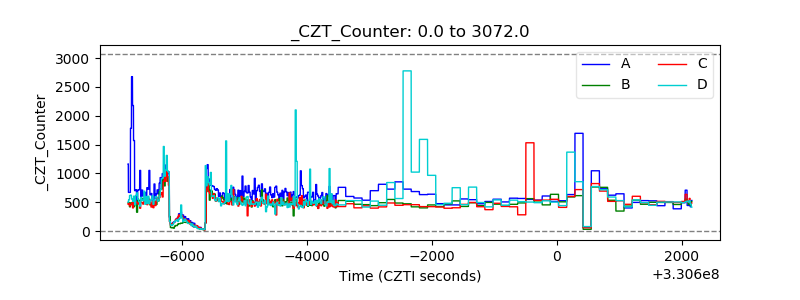 |
| +2.5 Volts monitor |  |
| +5 Volts monitor |  |
| _ROLL_ROT | 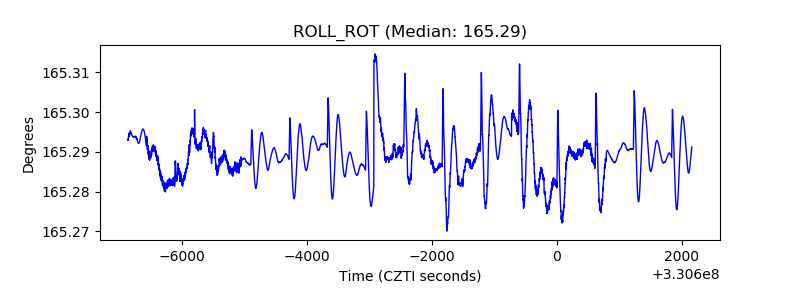 |
| _Roll_DEC | 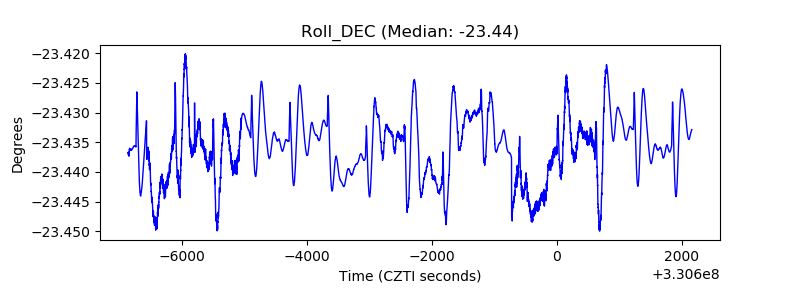 |
| _Roll_RA | 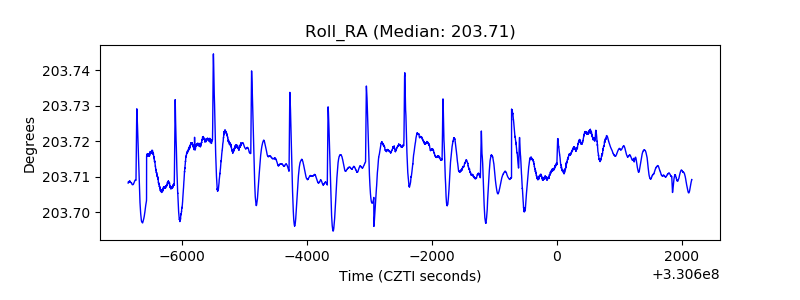 |
| Veto Counter | 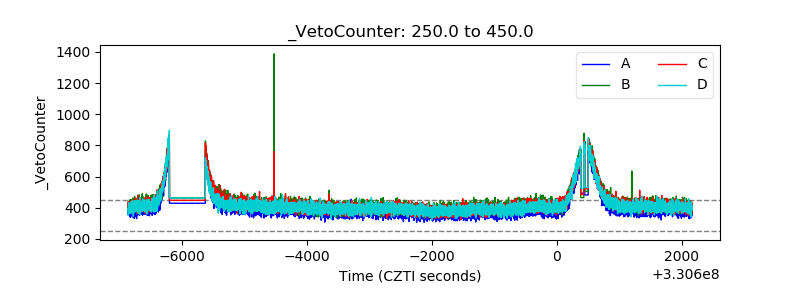 |