| Param | Original file | Final file |
|---|---|---|
| Filename | modeM0/AS1A07_148T02_9000003728_25611cztM0_level2.evt | modeM0/AS1A07_148T02_9000003728_25611cztM0_level2_quad_clean.evt |
| Size (bytes) | 555,042,240 | 94,504,320 |
| Size | 529.3 MB | 90.1 MB |
| Events in quadrant A | 4,095,892 | 594,915 |
| Events in quadrant B | 3,920,179 | 601,914 |
| Events in quadrant C | 3,785,644 | 569,405 |
| Events in quadrant D | 4,482,423 | 557,667 |
| Mode M9 | |||
|---|---|---|---|
| Quadrant | BADHDUFLAG | Total packets | Discarded packets |
| A | 0 | 3 | 0 |
| B | 0 | 3 | 0 |
| C | 0 | 3 | 0 |
| D | 0 | 3 | 0 |
| Mode M0 | |||
|---|---|---|---|
| Quadrant | BADHDUFLAG | Total packets | Discarded packets |
| A | 0 | 16756 | 0 |
| B | 0 | 16259 | 0 |
| C | 0 | 16065 | 0 |
| D | 0 | 17919 | 0 |
| Quadrant | Total seconds | Saturated seconds | Saturation percentage |
|---|---|---|---|
| A | 7739 | 281 | 3.630960% |
| B | 7739 | 268 | 3.462980% |
| C | 7739 | 288 | 3.721411% |
| D | 7739 | 266 | 3.437137% |
Noise dominated data is calculated using 1-second bins in cleaned event files. If a bin has >2000 counts, and if more than 50% of those come from <1% of pixels, then it is considered to be noise-dominated and hence unusable.
| Quadrant | # 1 sec bins | Bins with >0 counts | Bins with >2000 counts | High rate bins dominated by noise | Noise dominated (total time) | Noise dominated (detector-on time) | Marked lightcurve |
|---|---|---|---|---|---|---|---|
| A | 8019 | 7740 | 20 | 20 | 0.25% | 0.26% | 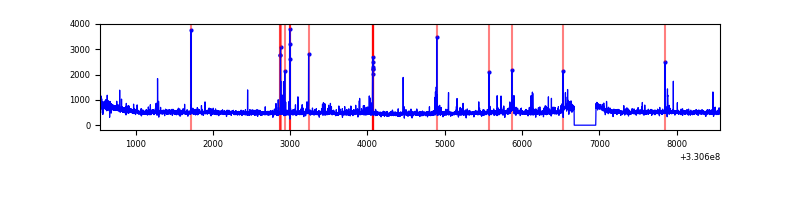 |
| B | 8019 | 7740 | 1 | 1 | 0.01% | 0.01% | 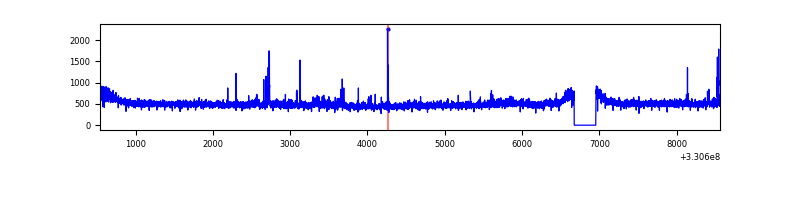 |
| C | 8019 | 7740 | 0 | 0 | 0.00% | 0.00% | 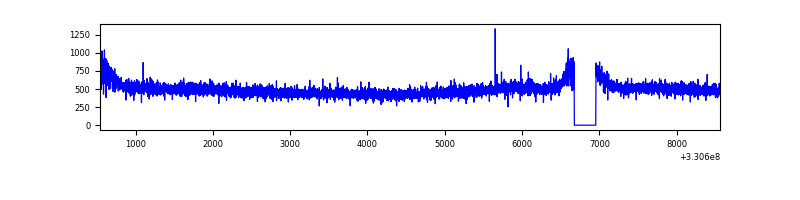 |
| D | 8019 | 7740 | 55 | 55 | 0.69% | 0.71% | 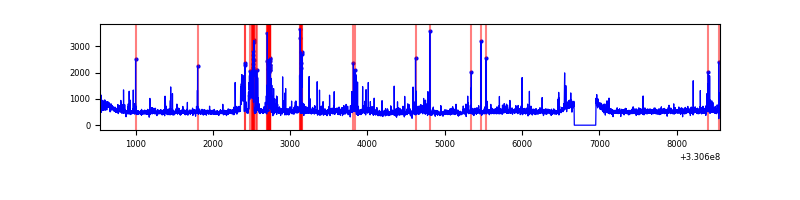 |
Top three noisy pixels from each quadrant. If the there are fewer than three noisy pixels in the level2.evt file, extra rows are filled as -1
| Pixel properties | Quadrant properties | ||||||
|---|---|---|---|---|---|---|---|
| Quadrant | DetID | PixID | Counts | Sigma | Mean | Median | Sigma |
| A | 6 | 16 | 166971 | 843.31 | 974 | 952 | 196.9 |
| A | 8 | 192 | 133184 | 671.69 | 974 | 952 | 196.9 |
| A | 0 | 13 | 39815 | 197.41 | 974 | 952 | 196.9 |
| B | 0 | 219 | 73445 | 383.46 | 970 | 945 | 189.1 |
| B | 0 | 190 | 36653 | 188.86 | 970 | 945 | 189.1 |
| B | 12 | 111 | 23208 | 117.75 | 970 | 945 | 189.1 |
| C | 14 | 238 | 149446 | 677.13 | 930 | 932 | 219.3 |
| C | 3 | 233 | 11192 | 46.78 | 930 | 932 | 219.3 |
| C | 13 | 61 | 6254 | 24.26 | 930 | 932 | 219.3 |
| D | 1 | 52 | 424510 | 1846.34 | 944 | 914 | 229.4 |
| D | 8 | 195 | 302162 | 1313.06 | 944 | 914 | 229.4 |
| D | 13 | 174 | 104654 | 452.17 | 944 | 914 | 229.4 |
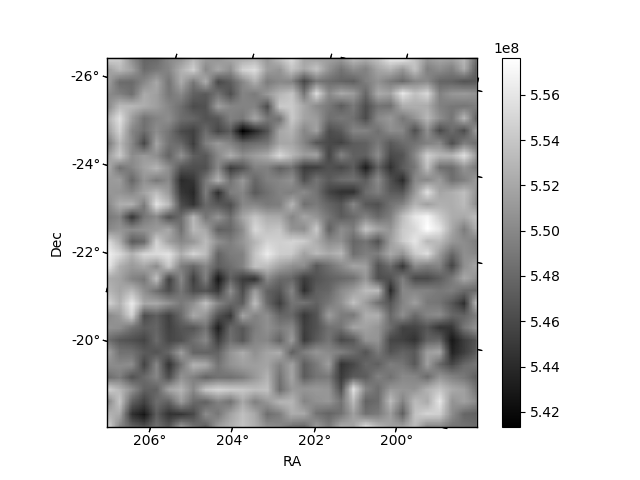
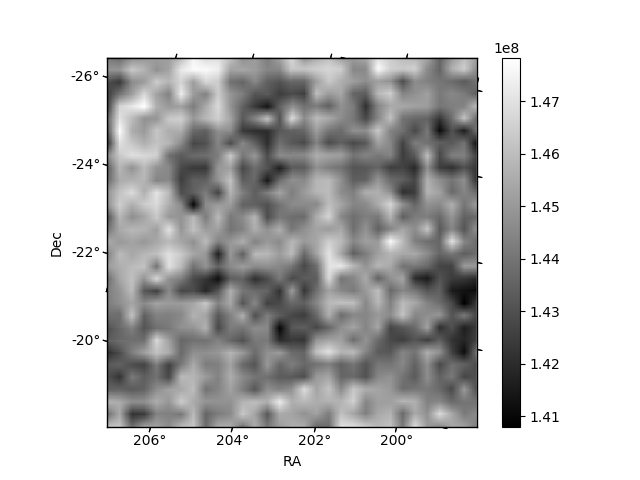
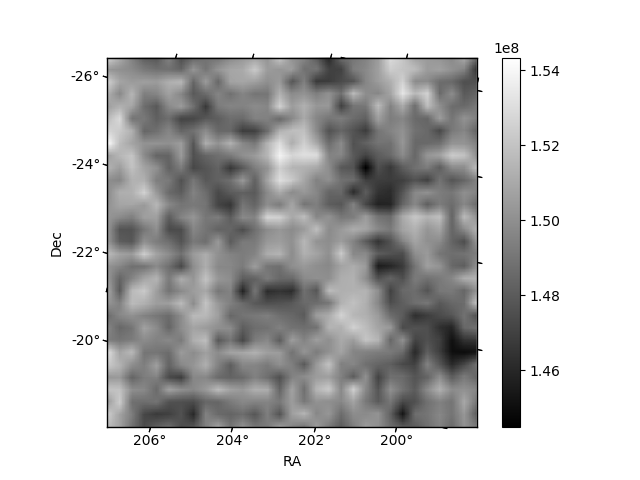
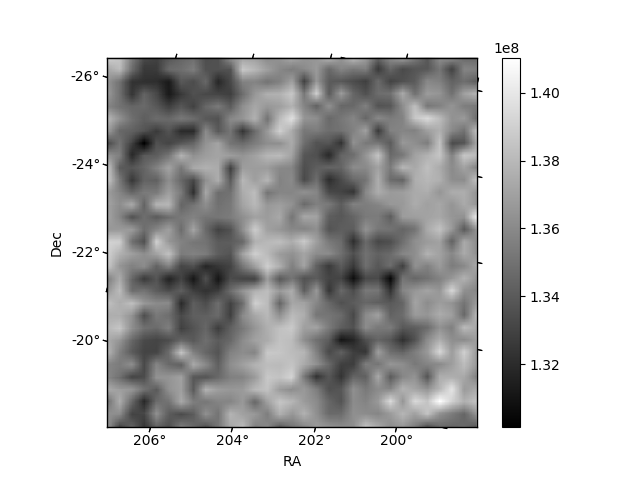
Histogram calculated using DETX and DETY for each event in the final _common_clean file
| Quadrant A |  |
 |
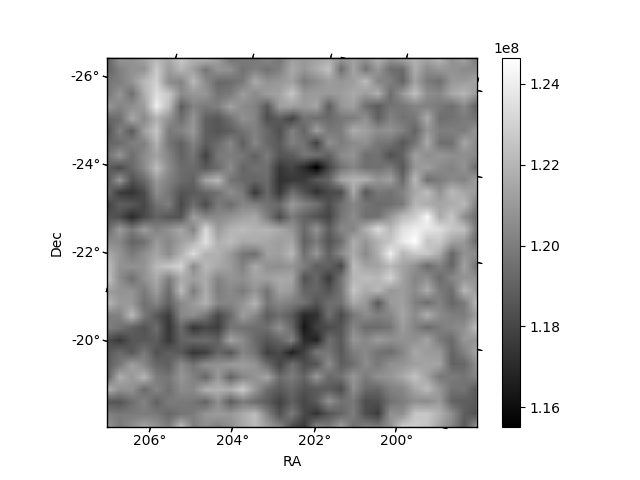
Quadrant B |
|---|---|---|---|
| Quadrant D |  |
 |
Quadrant C |
| Plot type | Count rate plots | Images |
|---|---|---|
| Comparison with Poisson distribution Blue bars denote a histogram of data divided into 1 sec bins. Red curve is a Poisson curve with rate = median count rate of data. |
 |
 |
| Quadrant-wise count rates Data is divided into 100 sec bins |
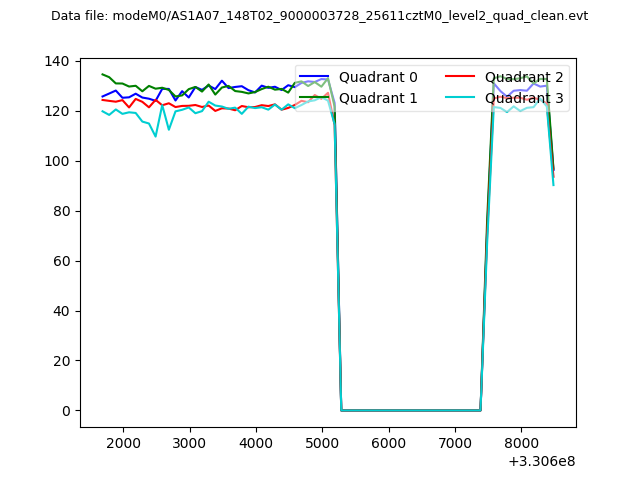 |
|
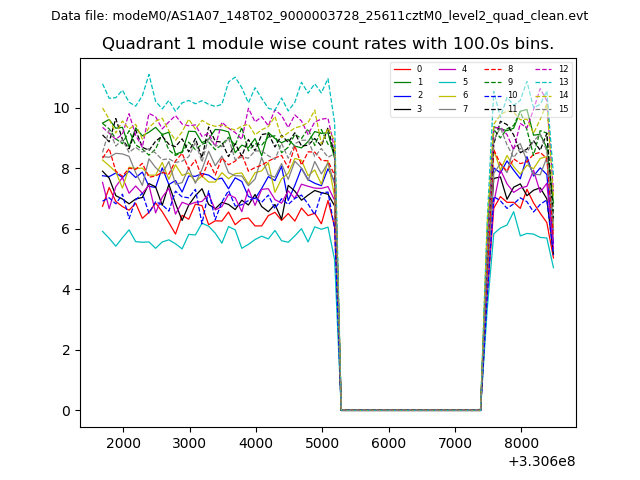
| Module-wise count rates for Quadrant A Data is divided into 100 sec bins |
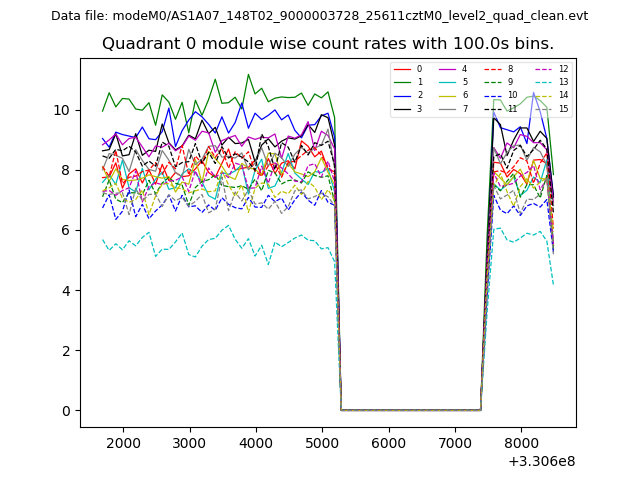 |
 |
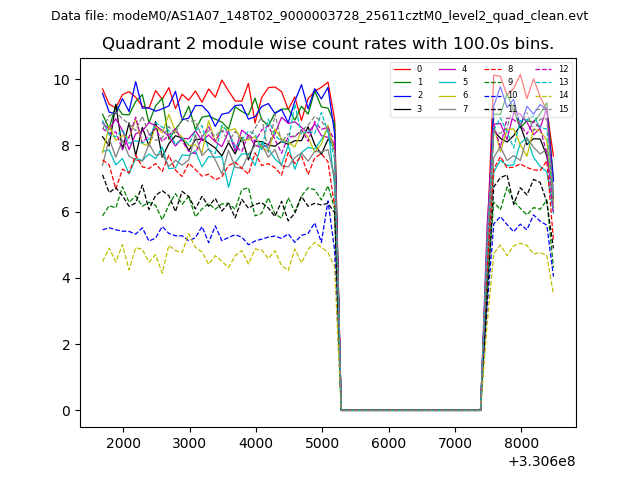
| Module-wise count rates for Quadrant B Data is divided into 100 sec bins |
 |
 |
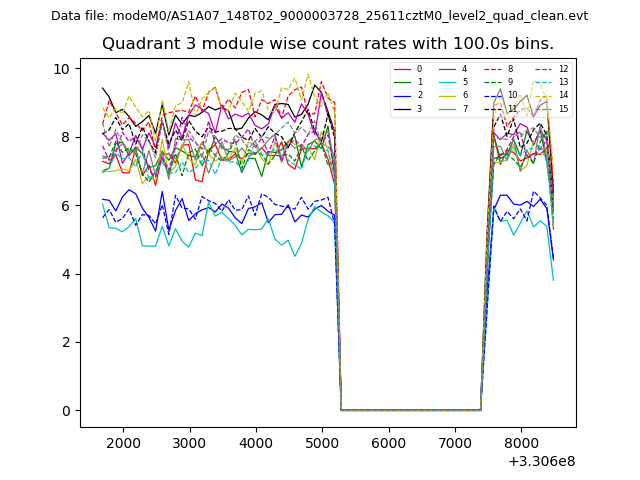
| Module-wise count rates for Quadrant C Data is divided into 100 sec bins |
 |
 |
| Module-wise count rates for Quadrant D Data is divided into 100 sec bins |
 |
 |
| Parameter | Plot |
|---|---|
| CZT HV Monitor | 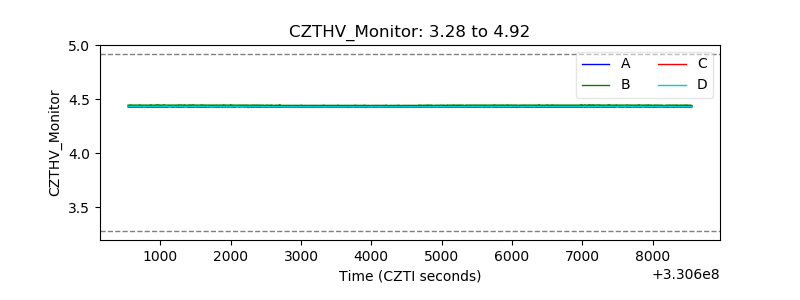 |
| D_VDD | 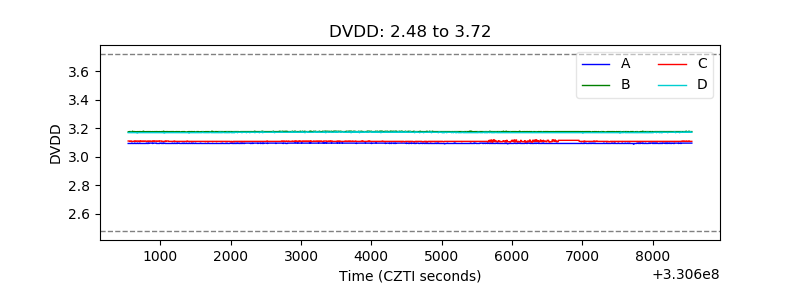 |
| Temperature 1 | 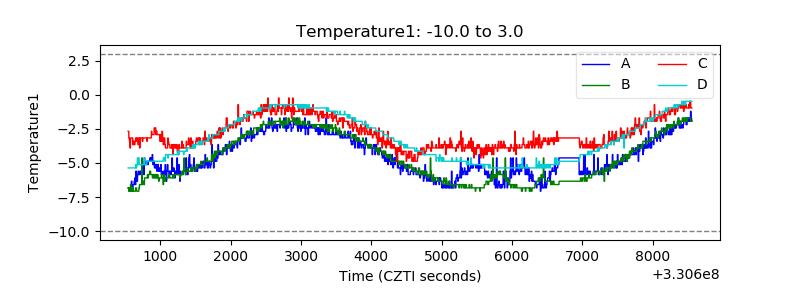 |
| Veto HV Monitor |  |
| Veto LLD | 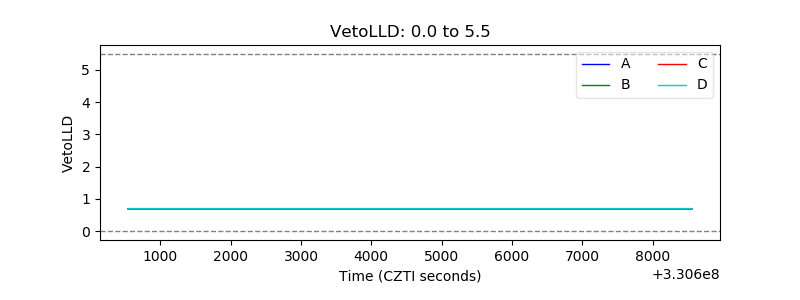 |
| Alpha Counter | 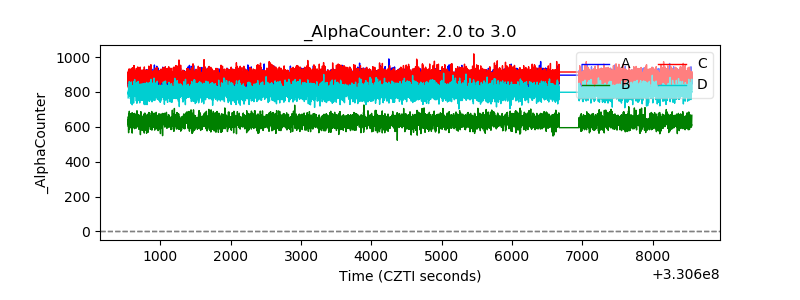 |
| _CPM_Rate | 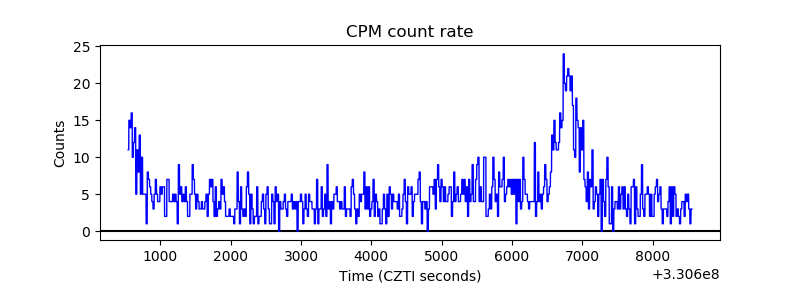 |
| CZT Counter | 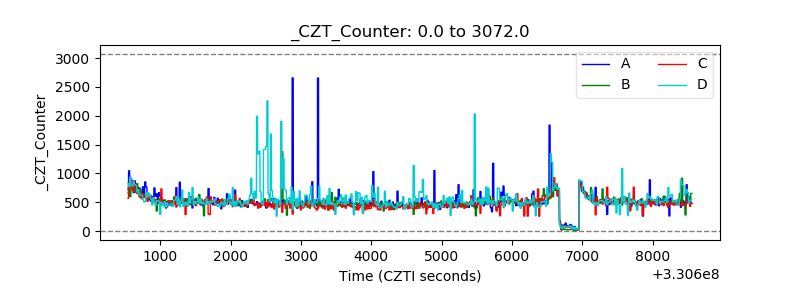 |
| +2.5 Volts monitor |  |
| +5 Volts monitor | 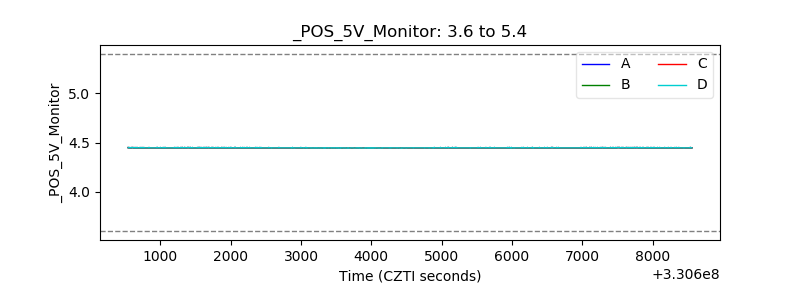 |
| _ROLL_ROT | 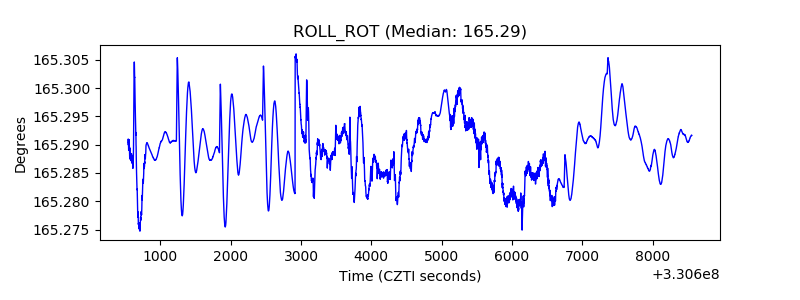 |
| _Roll_DEC | 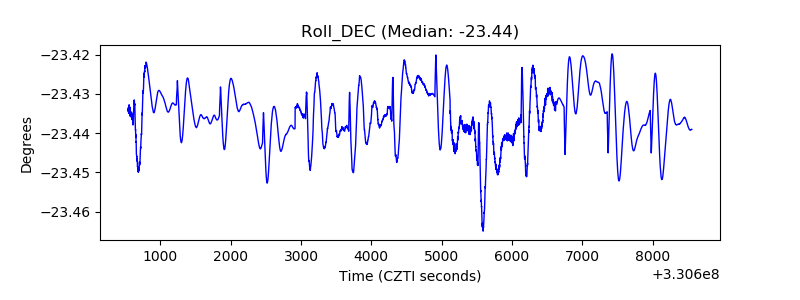 |
| _Roll_RA | 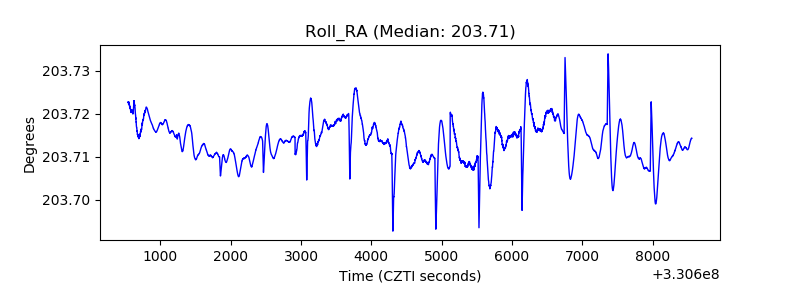 |
| Veto Counter | 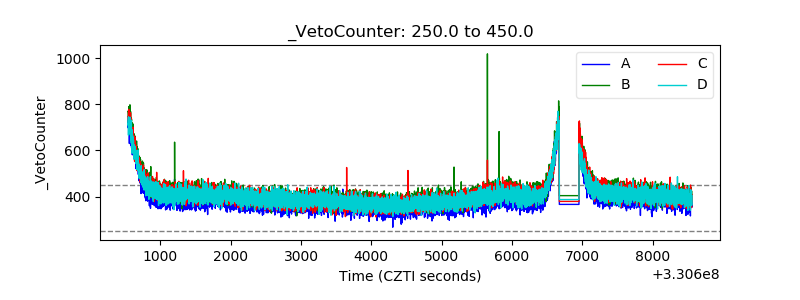 |