| Param | Original file | Final file |
|---|---|---|
| Filename | modeM0/AS1A07_148T02_9000003728_25614cztM0_level2.evt | modeM0/AS1A07_148T02_9000003728_25614cztM0_level2_quad_clean.evt |
| Size (bytes) | 618,903,360 | 122,664,960 |
| Size | 590.2 MB | 117.0 MB |
| Events in quadrant A | 4,418,046 | 799,364 |
| Events in quadrant B | 4,277,351 | 804,532 |
| Events in quadrant C | 4,193,685 | 760,398 |
| Events in quadrant D | 5,270,088 | 752,534 |
| Mode M9 | |||
|---|---|---|---|
| Quadrant | BADHDUFLAG | Total packets | Discarded packets |
| A | 0 | 6 | 0 |
| B | 0 | 7 | 0 |
| C | 0 | 7 | 0 |
| D | 0 | 7 | 0 |
| Mode M0 | |||
|---|---|---|---|
| Quadrant | BADHDUFLAG | Total packets | Discarded packets |
| A | 0 | 18282 | 0 |
| B | 0 | 17946 | 0 |
| C | 0 | 17951 | 0 |
| D | 0 | 21206 | 0 |
| Quadrant | Total seconds | Saturated seconds | Saturation percentage |
|---|---|---|---|
| A | 8619 | 124 | 1.438682% |
| B | 8619 | 117 | 1.357466% |
| C | 8619 | 189 | 2.192830% |
| D | 8619 | 107 | 1.241443% |
Noise dominated data is calculated using 1-second bins in cleaned event files. If a bin has >2000 counts, and if more than 50% of those come from <1% of pixels, then it is considered to be noise-dominated and hence unusable.
| Quadrant | # 1 sec bins | Bins with >0 counts | Bins with >2000 counts | High rate bins dominated by noise | Noise dominated (total time) | Noise dominated (detector-on time) | Marked lightcurve |
|---|---|---|---|---|---|---|---|
| A | 9074 | 8619 | 7 | 7 | 0.08% | 0.08% | 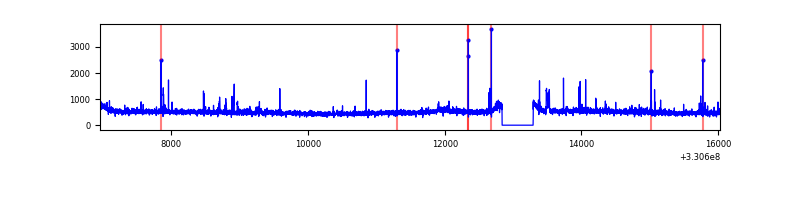 |
| B | 9074 | 8620 | 2 | 2 | 0.02% | 0.02% | 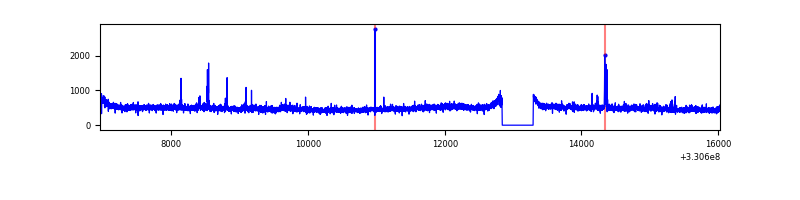 |
| C | 9074 | 8620 | 4 | 4 | 0.04% | 0.05% | 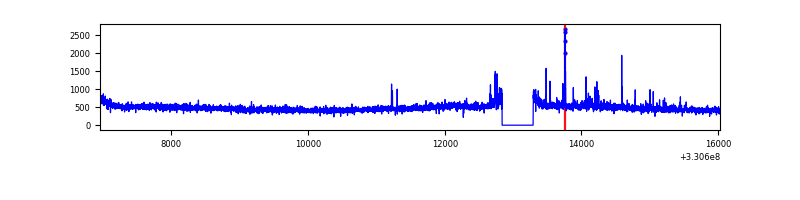 |
| D | 9074 | 8620 | 24 | 24 | 0.26% | 0.28% | 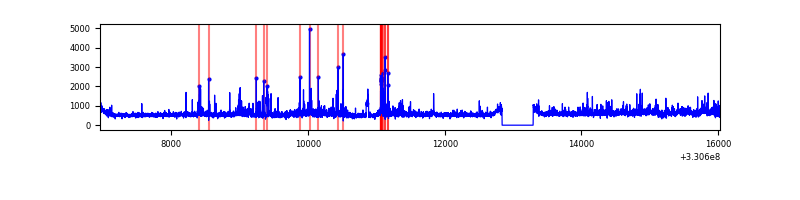 |
Top three noisy pixels from each quadrant. If the there are fewer than three noisy pixels in the level2.evt file, extra rows are filled as -1
| Pixel properties | Quadrant properties | ||||||
|---|---|---|---|---|---|---|---|
| Quadrant | DetID | PixID | Counts | Sigma | Mean | Median | Sigma |
| A | 8 | 192 | 129400 | 600.29 | 1063 | 1041 | 213.8 |
| A | 6 | 16 | 85981 | 397.23 | 1063 | 1041 | 213.8 |
| A | 0 | 13 | 82356 | 380.28 | 1063 | 1041 | 213.8 |
| B | 0 | 219 | 76201 | 373.48 | 1049 | 1022 | 201.3 |
| B | 0 | 190 | 54366 | 265.01 | 1049 | 1022 | 201.3 |
| B | 12 | 111 | 24806 | 118.16 | 1049 | 1022 | 201.3 |
| C | 14 | 238 | 160458 | 673.01 | 1007 | 1012 | 236.9 |
| C | 5 | 112 | 73783 | 307.16 | 1007 | 1012 | 236.9 |
| C | 3 | 233 | 40542 | 166.85 | 1007 | 1012 | 236.9 |
| D | 8 | 195 | 627032 | 2494.85 | 1028 | 997 | 250.9 |
| D | 1 | 52 | 540646 | 2150.59 | 1028 | 997 | 250.9 |
| D | 13 | 174 | 83900 | 330.38 | 1028 | 997 | 250.9 |
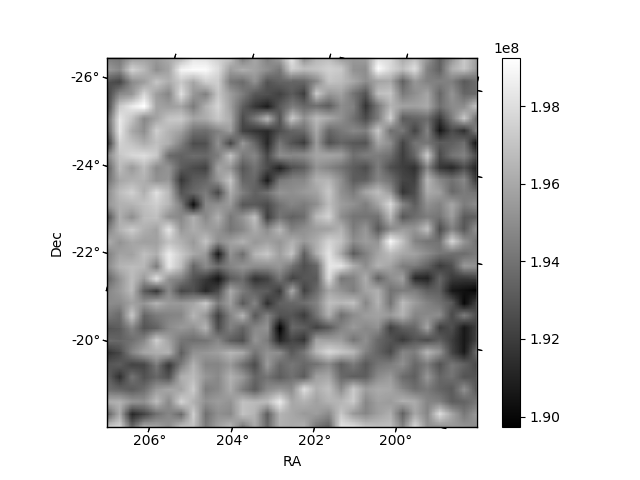
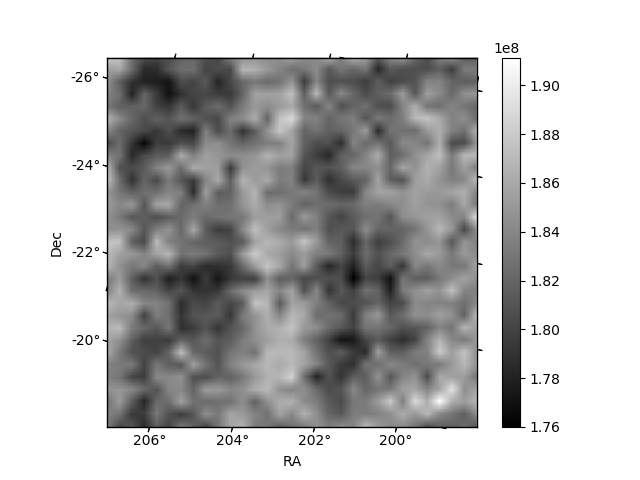
Histogram calculated using DETX and DETY for each event in the final _common_clean file
| Quadrant A |  |
 |
Quadrant B |
|---|---|---|---|
| Quadrant D |  |
 |
Quadrant C |
| Plot type | Count rate plots | Images |
|---|---|---|
| Comparison with Poisson distribution Blue bars denote a histogram of data divided into 1 sec bins. Red curve is a Poisson curve with rate = median count rate of data. |
 |
 |
| Quadrant-wise count rates Data is divided into 100 sec bins |
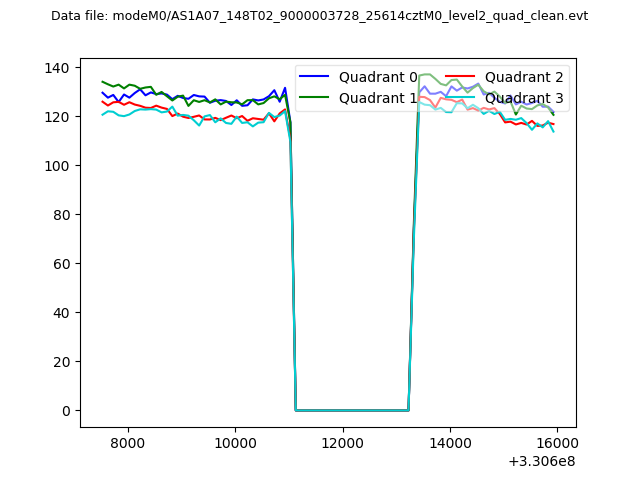 |
|
| Module-wise count rates for Quadrant A Data is divided into 100 sec bins |
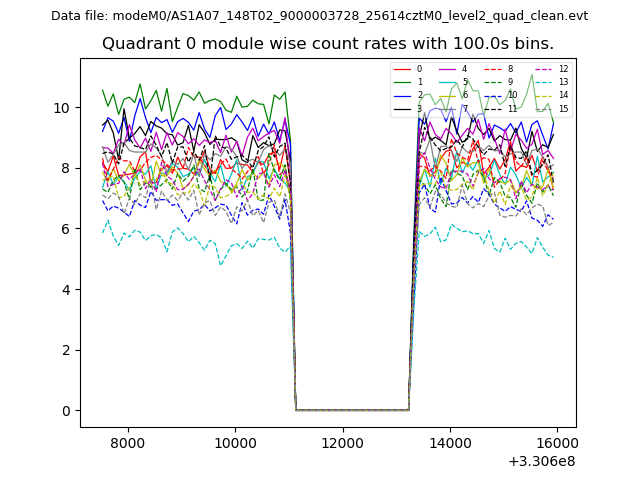 |
 |
| Module-wise count rates for Quadrant B Data is divided into 100 sec bins |
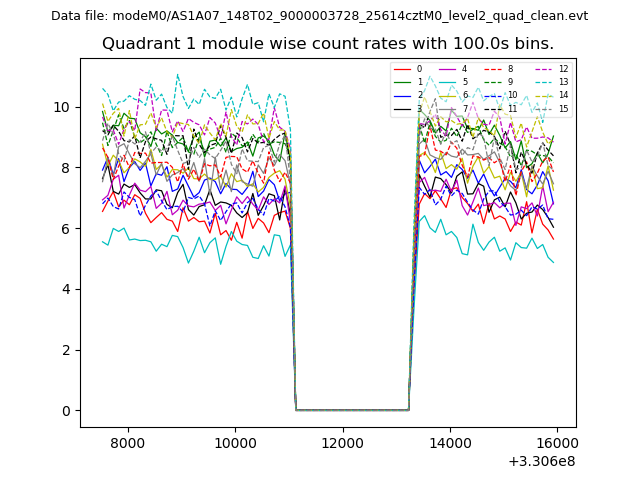 |
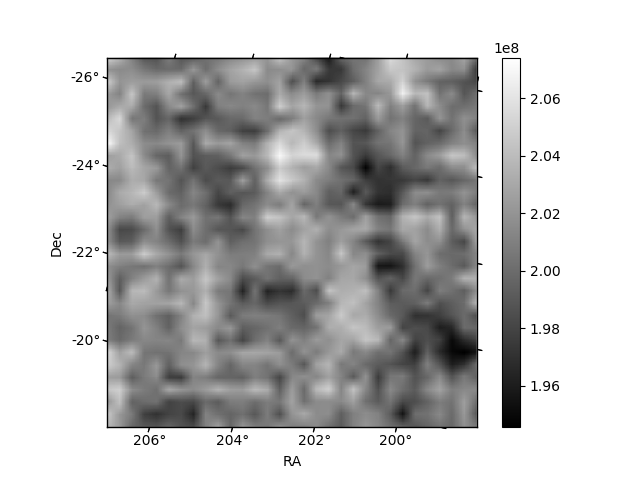 |
| Module-wise count rates for Quadrant C Data is divided into 100 sec bins |
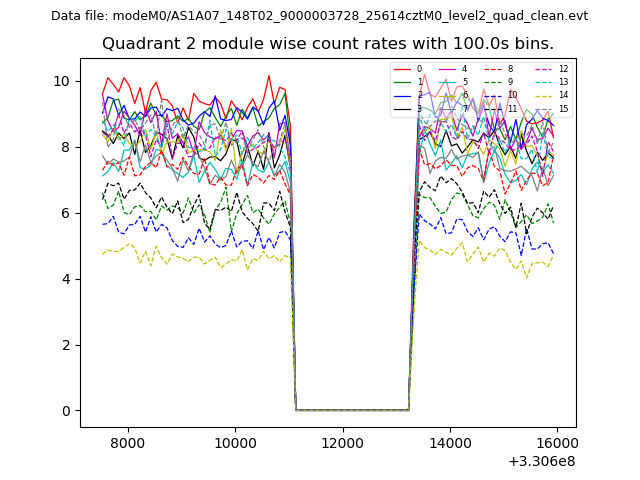 |
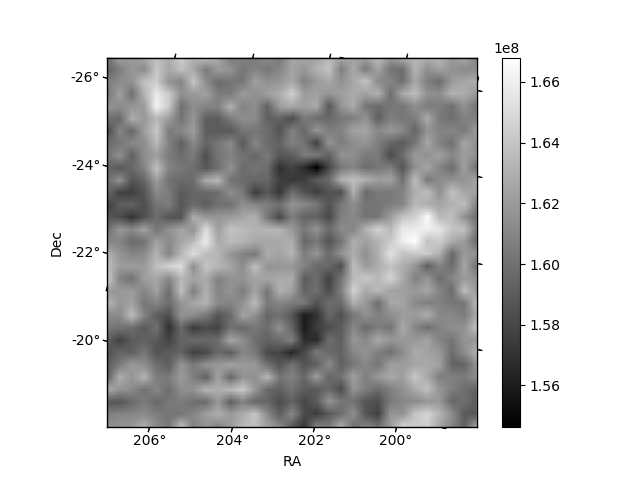 |
| Module-wise count rates for Quadrant D Data is divided into 100 sec bins |
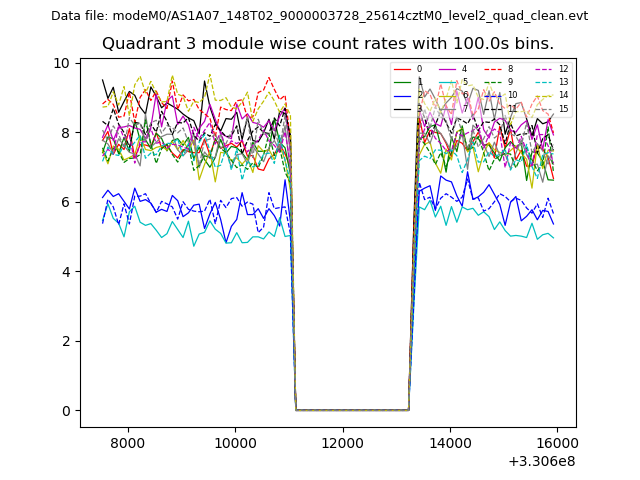 |
 |
| Parameter | Plot |
|---|---|
| CZT HV Monitor | 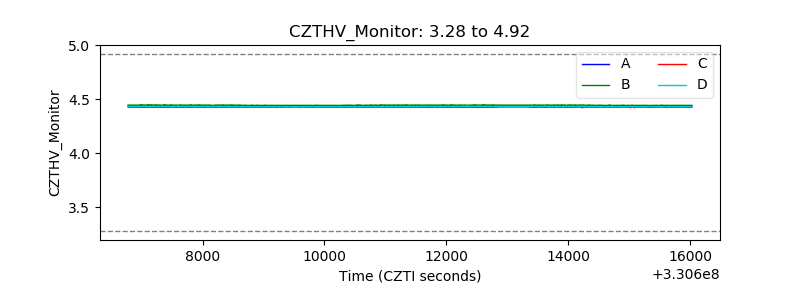 |
| D_VDD | 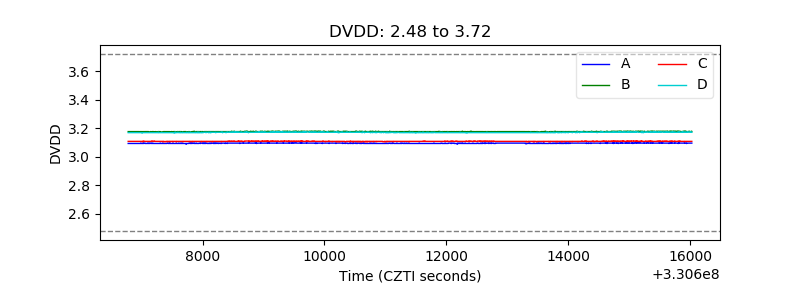 |
| Temperature 1 | 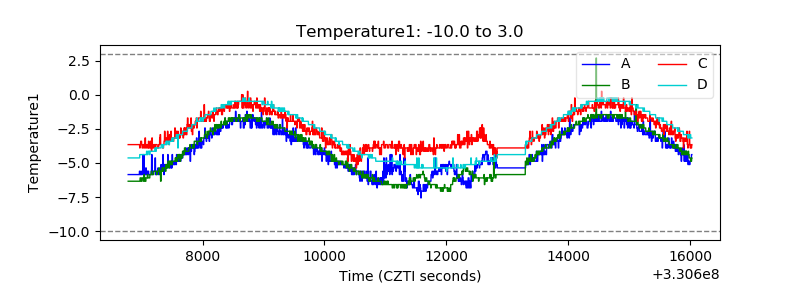 |
| Veto HV Monitor | 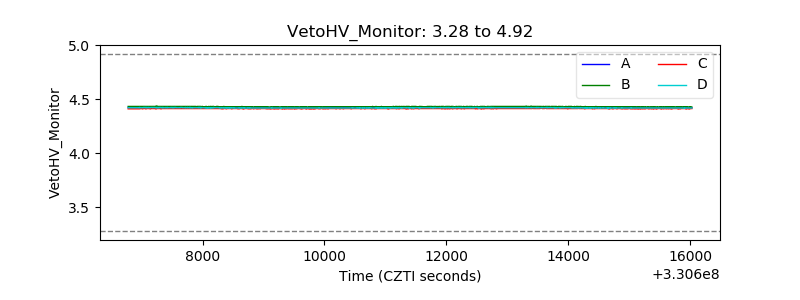 |
| Veto LLD | 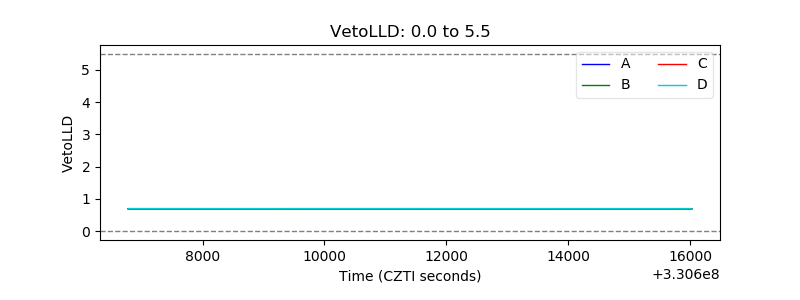 |
| Alpha Counter | 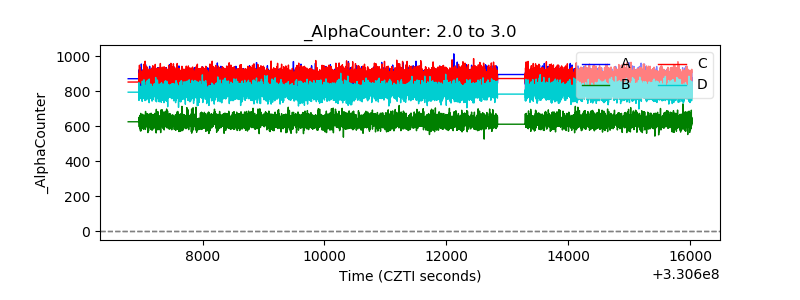 |
| _CPM_Rate | 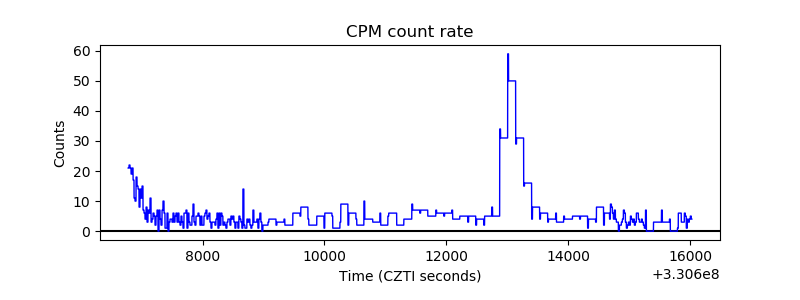 |
| CZT Counter |  |
| +2.5 Volts monitor |  |
| +5 Volts monitor | 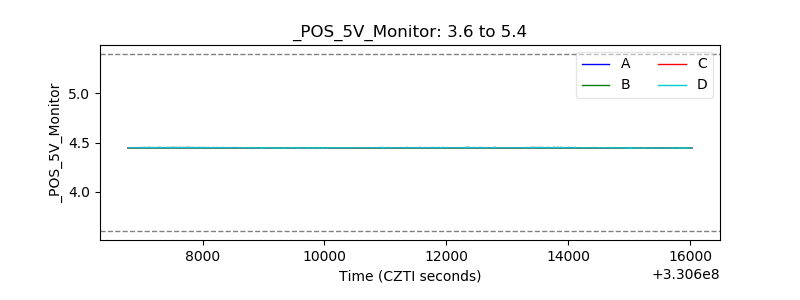 |
| _ROLL_ROT |  |
| _Roll_DEC |  |
| _Roll_RA |  |
| Veto Counter | 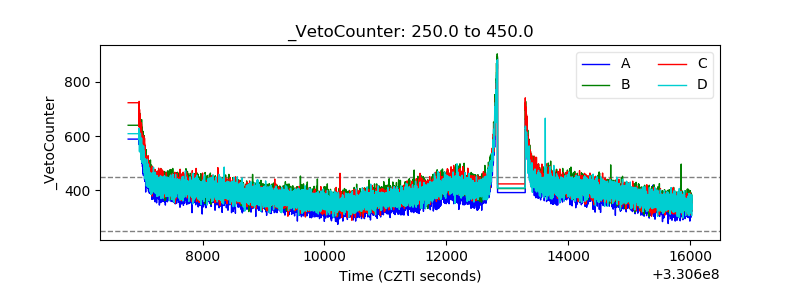 |