| Param | Original file | Final file |
|---|---|---|
| Filename | modeM0/AS1A09_081T01_9000003730cztM0_level2.fits | modeM0/AS1A09_081T01_9000003730cztM0_level2_quad_clean.evt |
| Size (bytes) | 311,037,120 | 208,247,040 |
| Size | 296.6 MB | 198.6 MB |
| Events in quadrant A | 1,914,816 | 1,079,165 |
| Events in quadrant B | 1,861,412 | 1,095,893 |
| Events in quadrant C | 1,867,050 | 1,032,999 |
| Events in quadrant D | 1,625,104 | 944,554 |
| Mode M9 | |||
|---|---|---|---|
| Quadrant | BADHDUFLAG | Total packets | Discarded packets |
| A | 0 | 63 | 0 |
| B | 0 | 63 | 0 |
| C | 0 | 63 | 0 |
| D | 0 | 63 | 0 |
| Mode M0 | |||
|---|---|---|---|
| Quadrant | BADHDUFLAG | Total packets | Discarded packets |
| A | 0 | 72110 | 0 |
| B | 0 | 66078 | 0 |
| C | 0 | 64927 | 0 |
| D | 0 | 74732 | 0 |
| Mode SS | |||
|---|---|---|---|
| Quadrant | BADHDUFLAG | Total packets | Discarded packets |
| A | 0 | 636 | 0 |
| B | 0 | 636 | 0 |
| C | 0 | 636 | 0 |
| D | 0 | 636 | 0 |
| Quadrant | Total seconds | Saturated seconds | Saturation percentage |
|---|---|---|---|
| A | 31322 | 535 | 1.708065% |
| B | 31322 | 184 | 0.587447% |
| C | 31322 | 301 | 0.960986% |
| D | 31322 | 401 | 1.280250% |
Noise dominated data is calculated using 1-second bins in cleaned event files. If a bin has >2000 counts, and if more than 50% of those come from <1% of pixels, then it is considered to be noise-dominated and hence unusable.
| Quadrant | # 1 sec bins | Bins with >0 counts | Bins with >2000 counts | High rate bins dominated by noise | Noise dominated (total time) | Noise dominated (detector-on time) | Marked lightcurve |
|---|---|---|---|---|---|---|---|
| A | 37472 | 31314 | 0 | 0 | 0.00% | 0.00% |  |
| B | 37472 | 31322 | 0 | 0 | 0.00% | 0.00% |  |
| C | 37472 | 31322 | 0 | 0 | 0.00% | 0.00% |  |
| D | 37472 | 31322 | 0 | 0 | 0.00% | 0.00% |  |
Top three noisy pixels from each quadrant. If the there are fewer than three noisy pixels in the level2.evt file, extra rows are filled as -1
| Pixel properties | Quadrant properties | ||||||
|---|---|---|---|---|---|---|---|
| Quadrant | DetID | PixID | Counts | Sigma | Mean | Median | Sigma |
| A | 0 | 29 | 1658 | 9.64 | 499 | 469 | 123.4 |
| A | 7 | 110 | 1541 | 8.69 | 499 | 469 | 123.4 |
| A | 9 | 19 | 1499 | 8.35 | 499 | 469 | 123.4 |
| B | 2 | 9 | 1498 | 10.64 | 493 | 472 | 96.5 |
| B | 5 | 128 | 1270 | 8.27 | 493 | 472 | 96.5 |
| B | 2 | 8 | 1225 | 7.81 | 493 | 472 | 96.5 |
| C | 9 | 233 | 1266 | 6.4 | 493 | 463 | 125.6 |
| C | 3 | 126 | 1259 | 6.34 | 493 | 463 | 125.6 |
| C | 12 | 250 | 1241 | 6.2 | 493 | 463 | 125.6 |
| D | 3 | 14 | 1232 | 6.49 | 463 | 422 | 124.8 |
| D | 15 | 46 | 1168 | 5.98 | 463 | 422 | 124.8 |
| D | 6 | 67 | 1128 | 5.66 | 463 | 422 | 124.8 |
Histogram calculated using DETX and DETY for each event in the final _common_clean file
| Quadrant A | 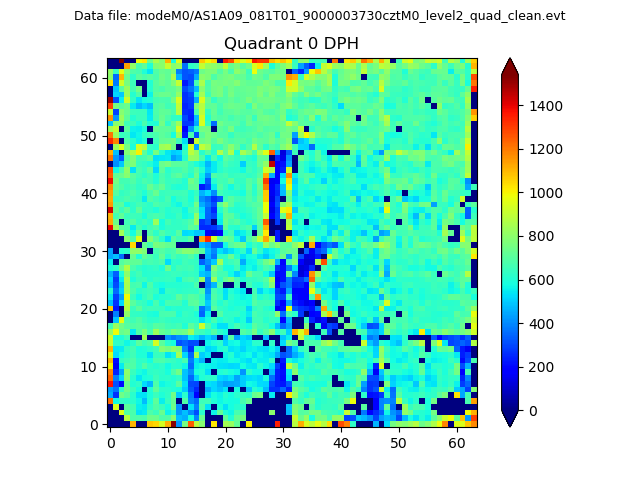 |
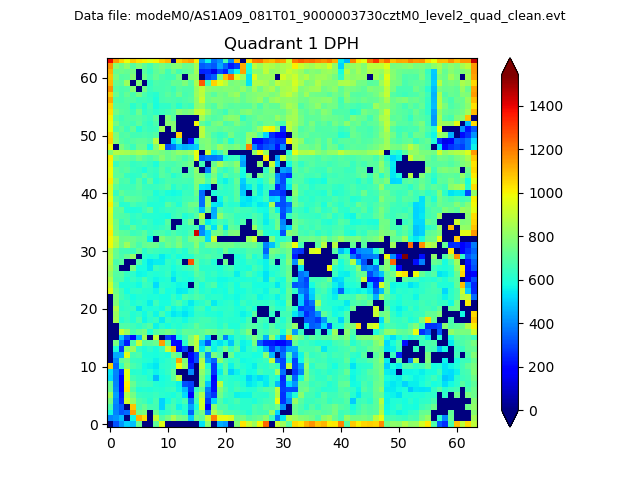 |
Quadrant B |
|---|---|---|---|
| Quadrant D |  |
 |
Quadrant C |
| Plot type | Count rate plots | Images |
|---|---|---|
| Comparison with Poisson distribution Blue bars denote a histogram of data divided into 1 sec bins. Red curve is a Poisson curve with rate = median count rate of data. |
 |
 |
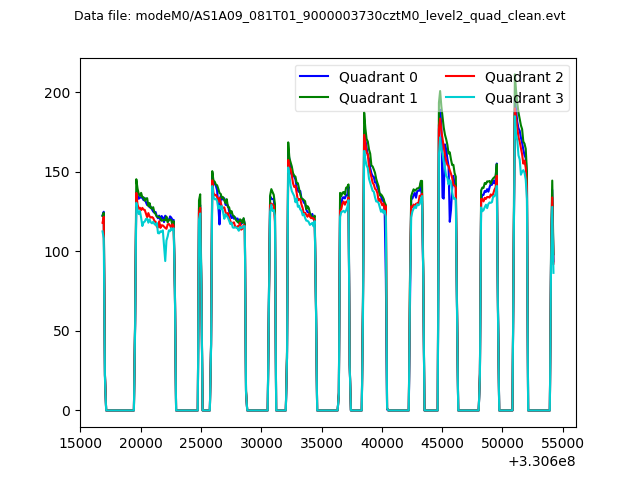
| Quadrant-wise count rates Data is divided into 100 sec bins |
 |
|
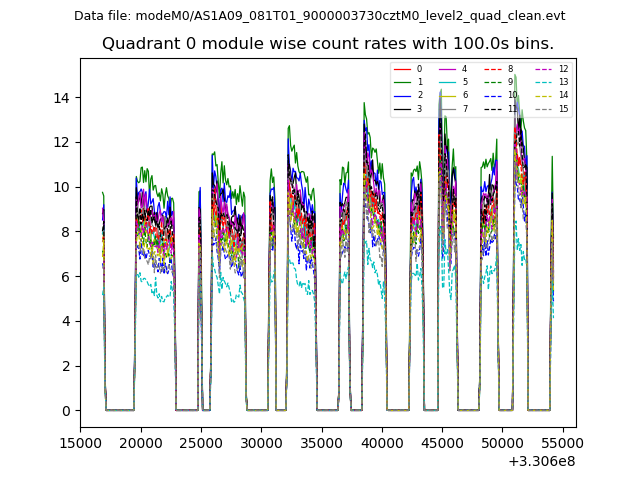
| Module-wise count rates for Quadrant A Data is divided into 100 sec bins |
 |
 |
| Module-wise count rates for Quadrant B Data is divided into 100 sec bins |
 |
 |
| Module-wise count rates for Quadrant C Data is divided into 100 sec bins |
 |
 |
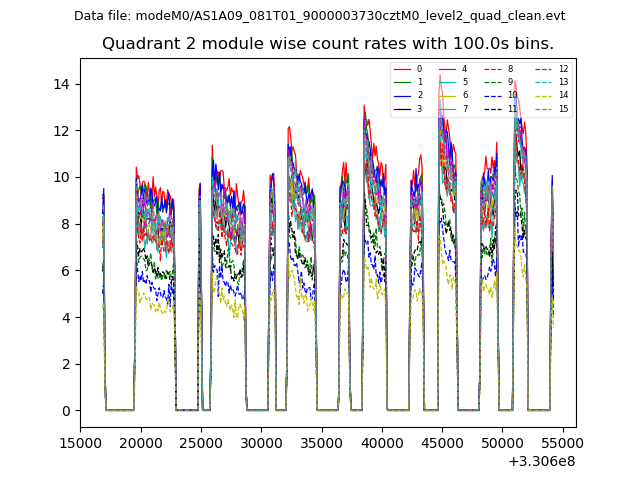
| Module-wise count rates for Quadrant D Data is divided into 100 sec bins |
 |
 |
| Parameter | Plot |
|---|---|
| CZT HV Monitor |  |
| D_VDD | 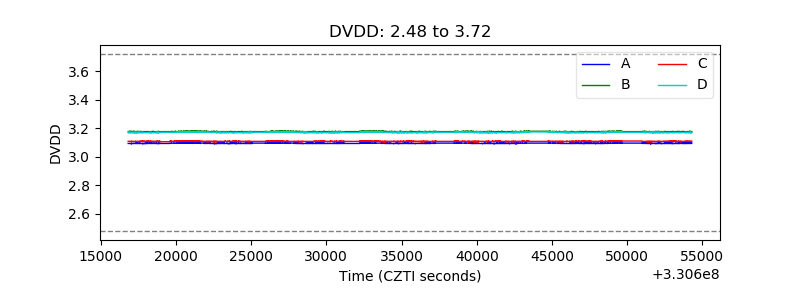 |
| Temperature 1 |  |
| Veto HV Monitor |  |
| Veto LLD |  |
| Alpha Counter |  |
| _CPM_Rate |  |
| CZT Counter |  |
| +2.5 Volts monitor |  |
| +5 Volts monitor | 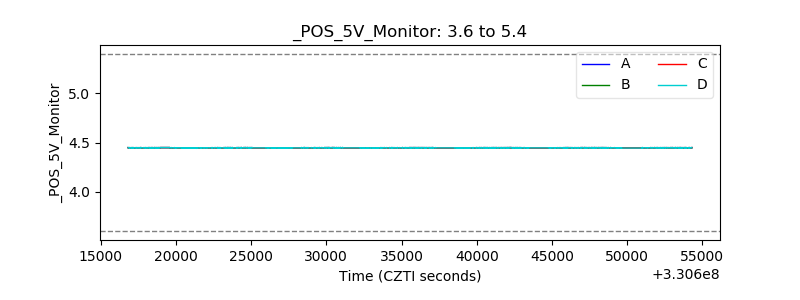 |
| _ROLL_ROT |  |
| _Roll_DEC |  |
| _Roll_RA |  |
| Veto Counter |  |