| Param | Original file | Final file |
|---|---|---|
| Filename | modeM0/AS1A09_081T01_9000003730_25614cztM0_level2.evt | modeM0/AS1A09_081T01_9000003730_25614cztM0_level2_quad_clean.evt |
| Size (bytes) | 670,832,640 | 109,180,800 |
| Size | 639.8 MB | 104.1 MB |
| Events in quadrant A | 4,727,437 | 681,877 |
| Events in quadrant B | 4,493,176 | 691,636 |
| Events in quadrant C | 4,349,882 | 659,182 |
| Events in quadrant D | 6,125,216 | 638,245 |
| Mode M9 | |||
|---|---|---|---|
| Quadrant | BADHDUFLAG | Total packets | Discarded packets |
| A | 0 | 15 | 0 |
| B | 0 | 15 | 0 |
| C | 0 | 15 | 0 |
| D | 0 | 15 | 0 |
| Mode M0 | |||
|---|---|---|---|
| Quadrant | BADHDUFLAG | Total packets | Discarded packets |
| A | 0 | 19756 | 0 |
| B | 0 | 19073 | 0 |
| C | 0 | 18784 | 0 |
| D | 0 | 24126 | 0 |
| Quadrant | Total seconds | Saturated seconds | Saturation percentage |
|---|---|---|---|
| A | 9162 | 115 | 1.255184% |
| B | 9162 | 90 | 0.982318% |
| C | 9162 | 136 | 1.484392% |
| D | 9162 | 237 | 2.586771% |
Noise dominated data is calculated using 1-second bins in cleaned event files. If a bin has >2000 counts, and if more than 50% of those come from <1% of pixels, then it is considered to be noise-dominated and hence unusable.
| Quadrant | # 1 sec bins | Bins with >0 counts | Bins with >2000 counts | High rate bins dominated by noise | Noise dominated (total time) | Noise dominated (detector-on time) | Marked lightcurve |
|---|---|---|---|---|---|---|---|
| A | 10617 | 9164 | 30 | 30 | 0.28% | 0.33% | 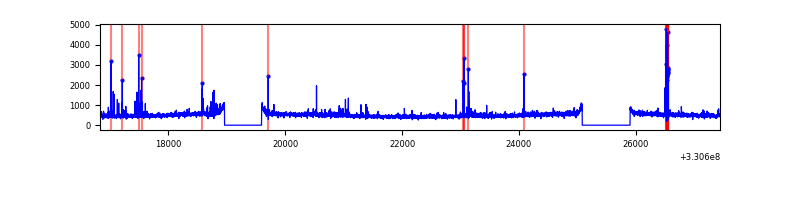 |
| B | 10617 | 9164 | 3 | 3 | 0.03% | 0.03% | 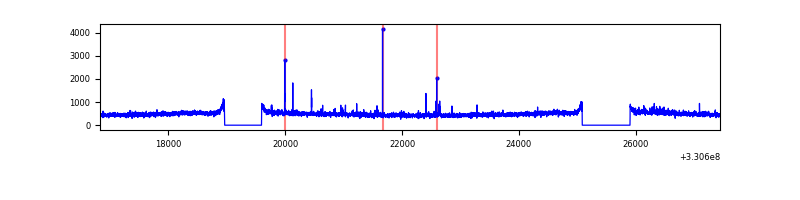 |
| C | 10617 | 9164 | 0 | 0 | 0.00% | 0.00% | 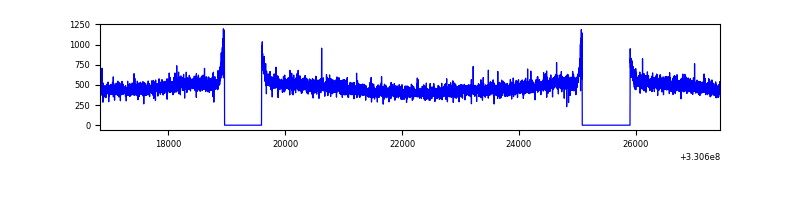 |
| D | 10617 | 9164 | 179 | 179 | 1.69% | 1.95% | 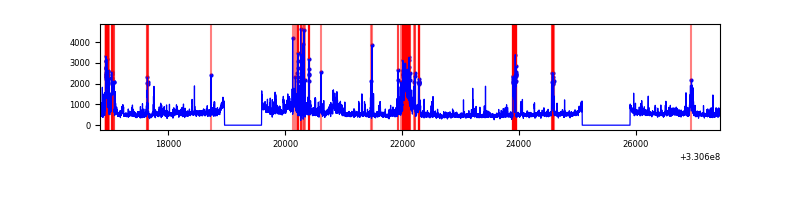 |
Top three noisy pixels from each quadrant. If the there are fewer than three noisy pixels in the level2.evt file, extra rows are filled as -1
| Pixel properties | Quadrant properties | ||||||
|---|---|---|---|---|---|---|---|
| Quadrant | DetID | PixID | Counts | Sigma | Mean | Median | Sigma |
| A | 0 | 13 | 175568 | 772.89 | 1112 | 1087 | 225.8 |
| A | 8 | 192 | 151925 | 668.16 | 1112 | 1087 | 225.8 |
| A | 6 | 16 | 72875 | 317.99 | 1112 | 1087 | 225.8 |
| B | 0 | 219 | 98871 | 456.31 | 1112 | 1084 | 214.3 |
| B | 12 | 111 | 26148 | 116.96 | 1112 | 1084 | 214.3 |
| B | 11 | 111 | 23440 | 104.32 | 1112 | 1084 | 214.3 |
| C | 14 | 238 | 170432 | 672.17 | 1071 | 1076 | 252.0 |
| C | 3 | 233 | 10322 | 36.7 | 1071 | 1076 | 252.0 |
| C | 13 | 61 | 7505 | 25.51 | 1071 | 1076 | 252.0 |
| D | 7 | 238 | 716240 | 2719.29 | 1079 | 1046 | 263.0 |
| D | 1 | 52 | 699052 | 2653.94 | 1079 | 1046 | 263.0 |
| D | 8 | 195 | 402074 | 1524.78 | 1079 | 1046 | 263.0 |
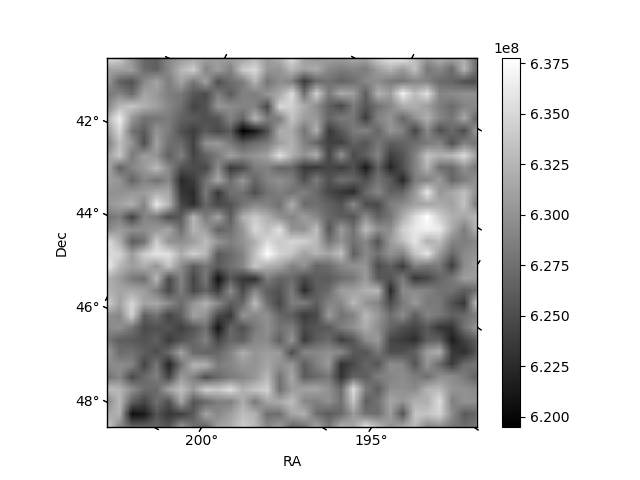
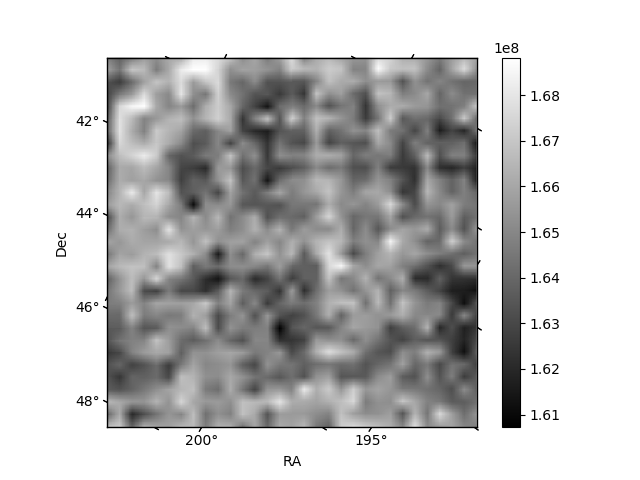
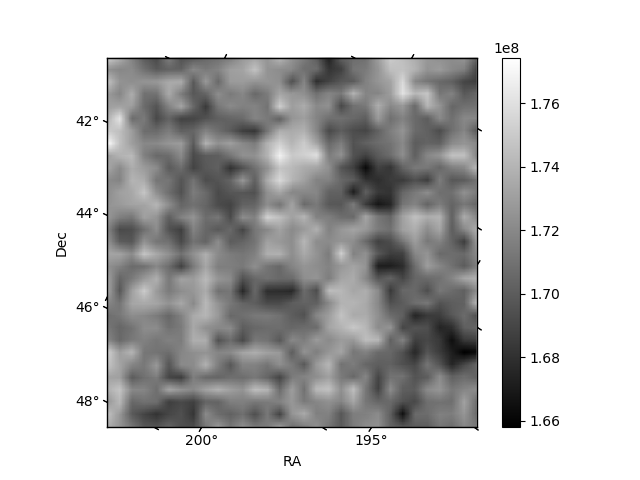
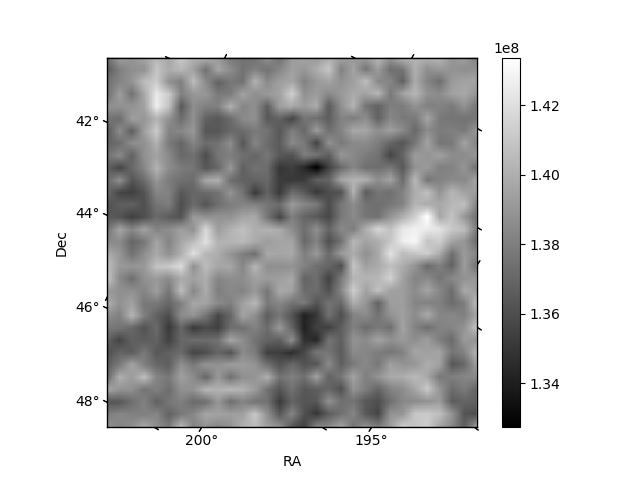
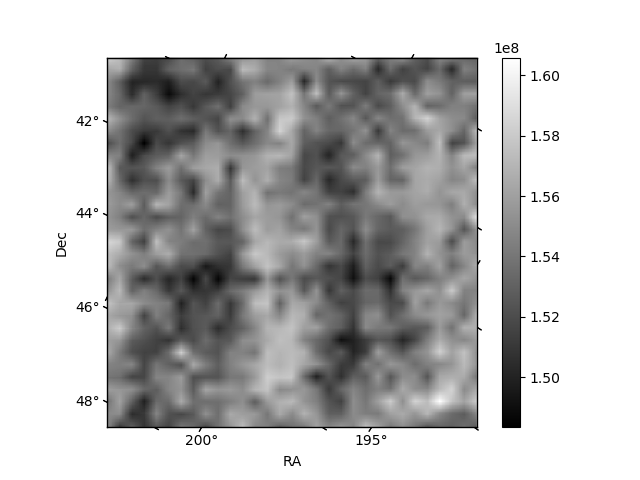
Histogram calculated using DETX and DETY for each event in the final _common_clean file
| Quadrant A | 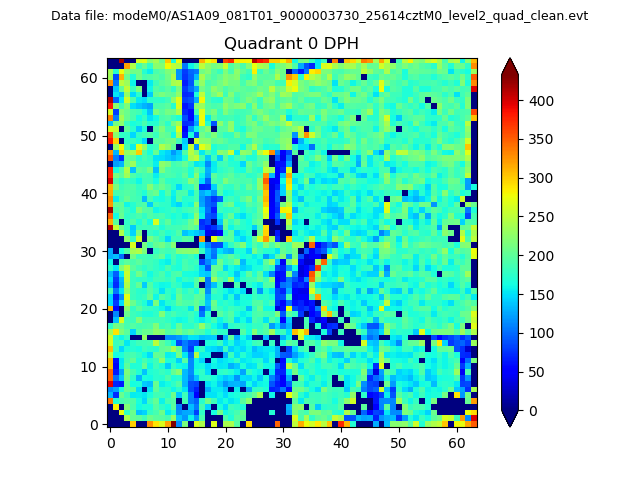 |
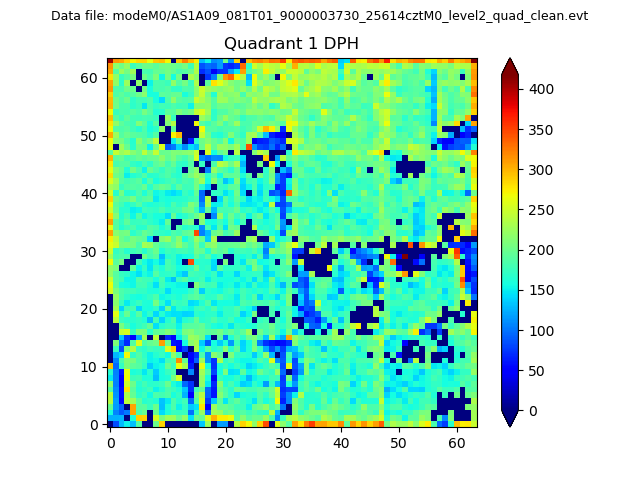 |
Quadrant B |
|---|---|---|---|
| Quadrant D | 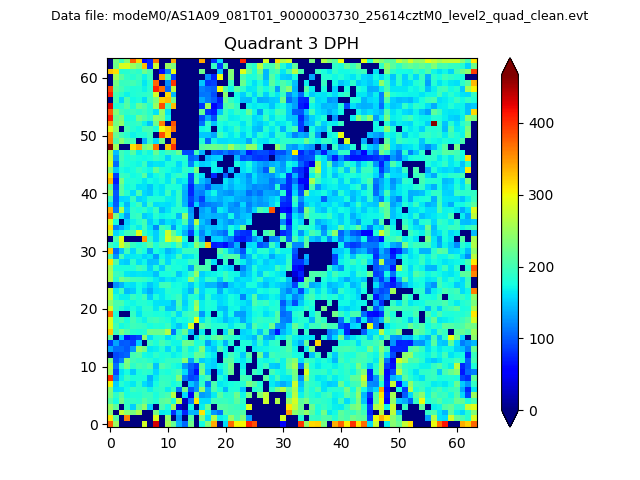 |
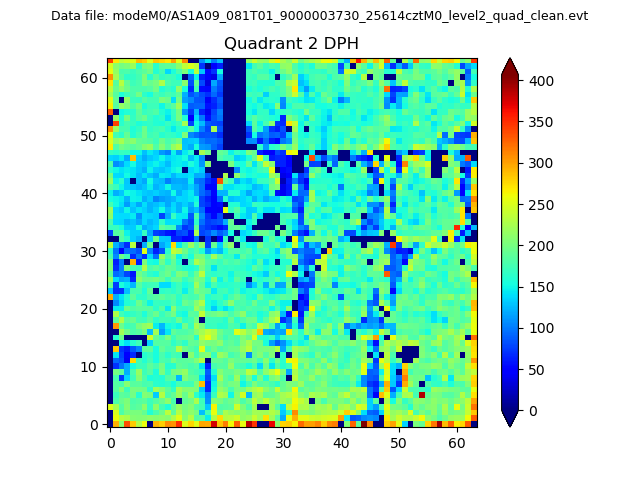 |
Quadrant C |
| Plot type | Count rate plots | Images |
|---|---|---|
| Comparison with Poisson distribution Blue bars denote a histogram of data divided into 1 sec bins. Red curve is a Poisson curve with rate = median count rate of data. |
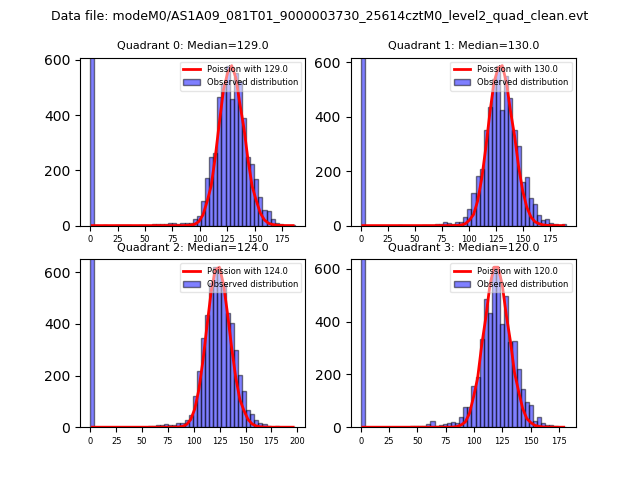 |
 |
| Quadrant-wise count rates Data is divided into 100 sec bins |
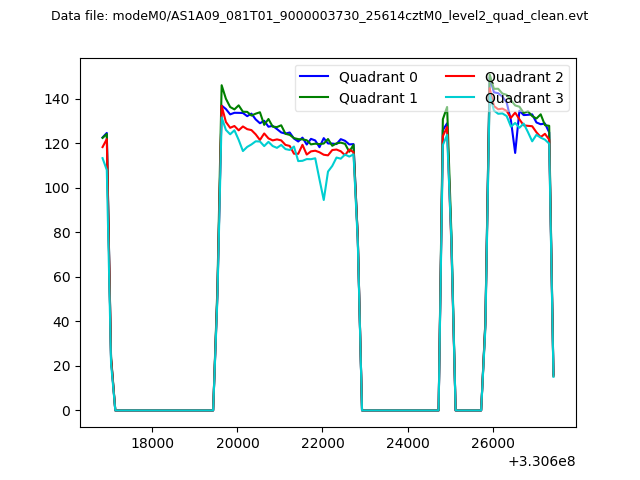 |
|
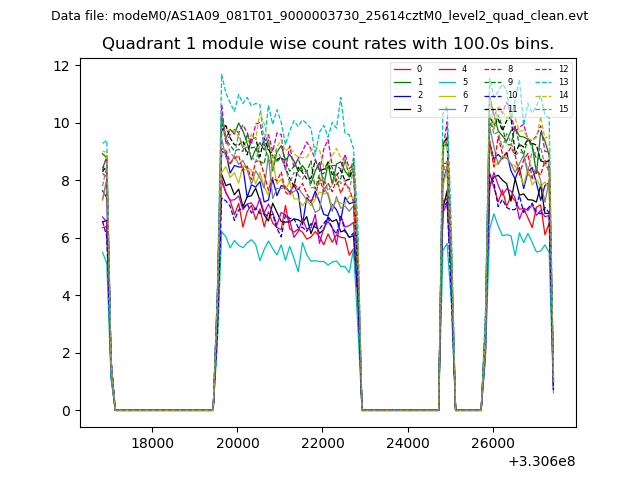
| Module-wise count rates for Quadrant A Data is divided into 100 sec bins |
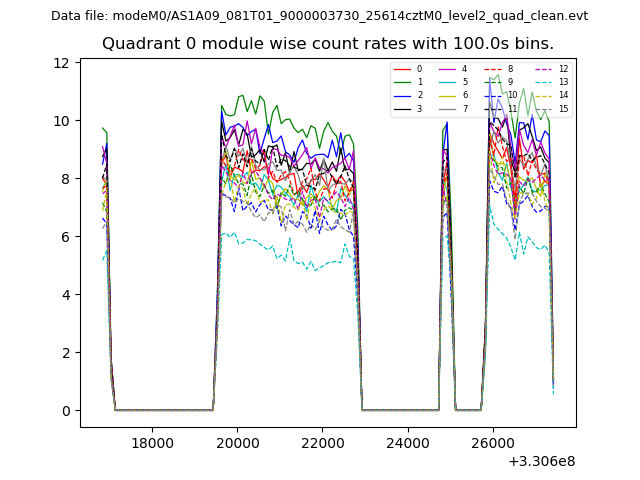 |
 |
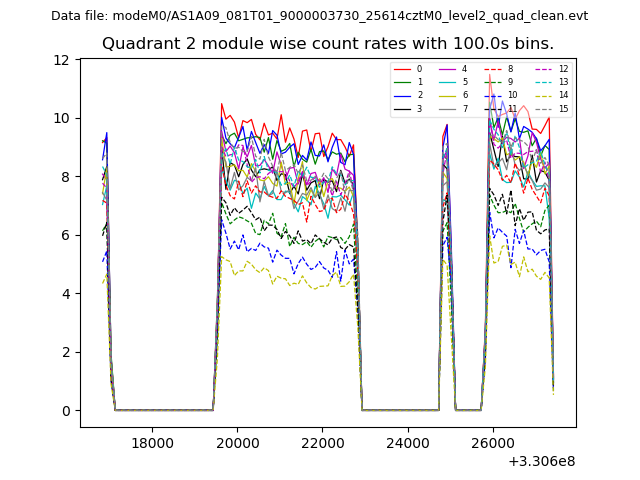
| Module-wise count rates for Quadrant B Data is divided into 100 sec bins |
 |
 |
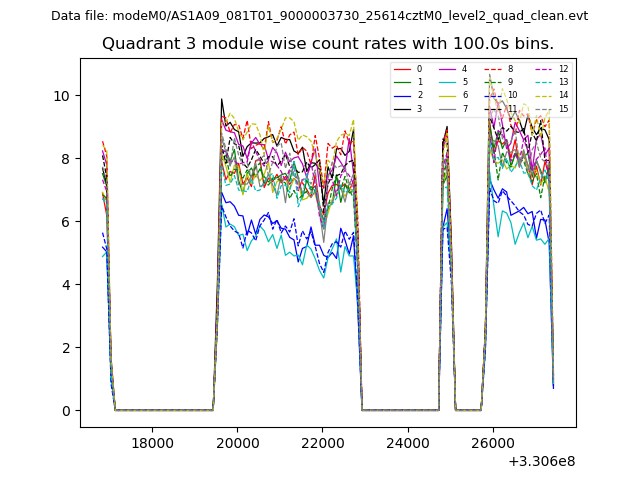
| Module-wise count rates for Quadrant C Data is divided into 100 sec bins |
 |
 |
| Module-wise count rates for Quadrant D Data is divided into 100 sec bins |
 |
 |
| Parameter | Plot |
|---|---|
| CZT HV Monitor | 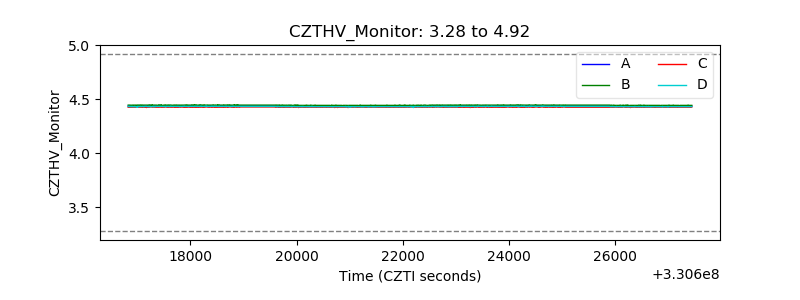 |
| D_VDD | 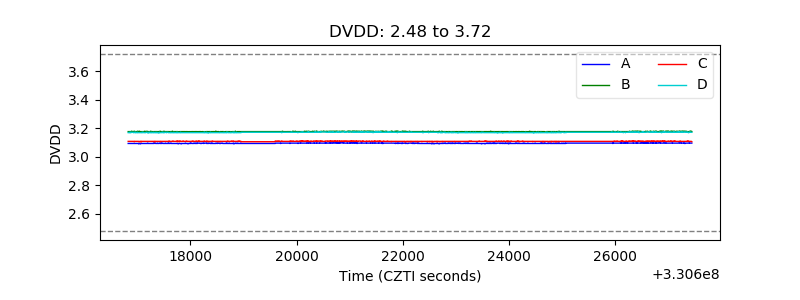 |
| Temperature 1 | 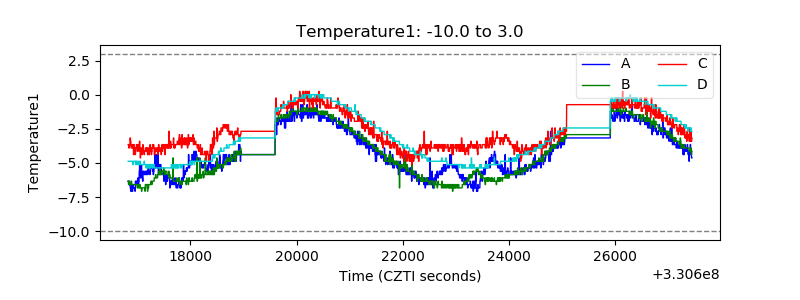 |
| Veto HV Monitor |  |
| Veto LLD | 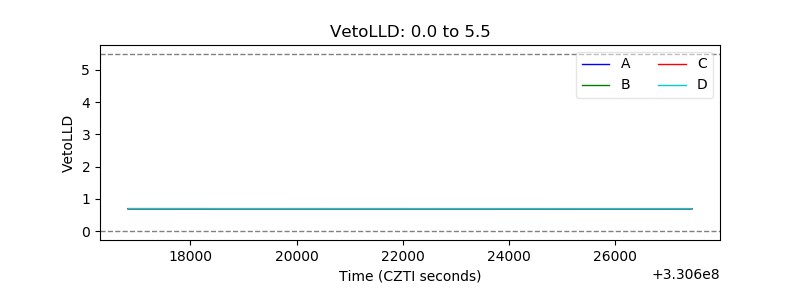 |
| Alpha Counter | 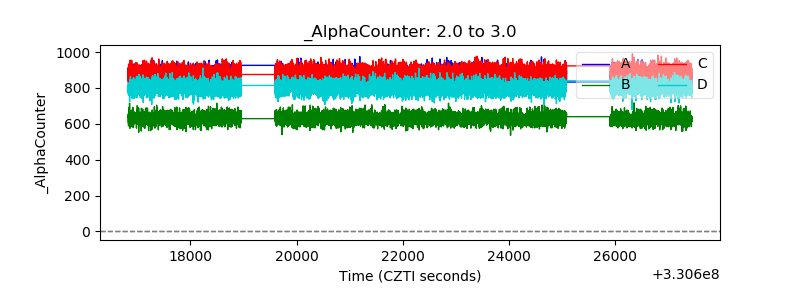 |
| _CPM_Rate | 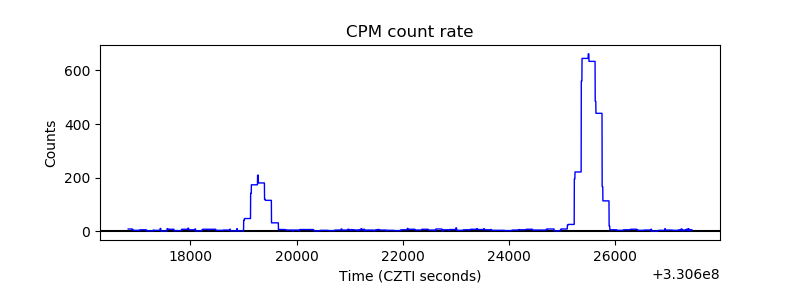 |
| CZT Counter | 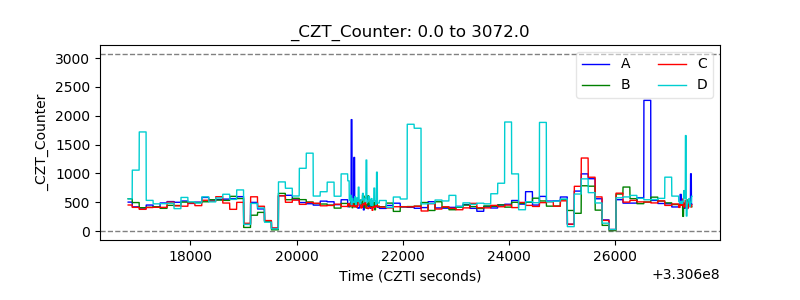 |
| +2.5 Volts monitor |  |
| +5 Volts monitor | 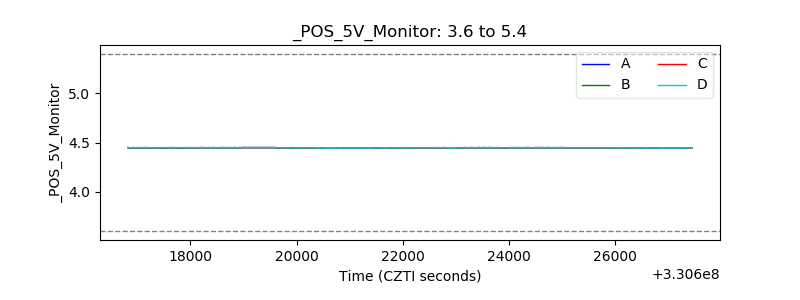 |
| _ROLL_ROT | 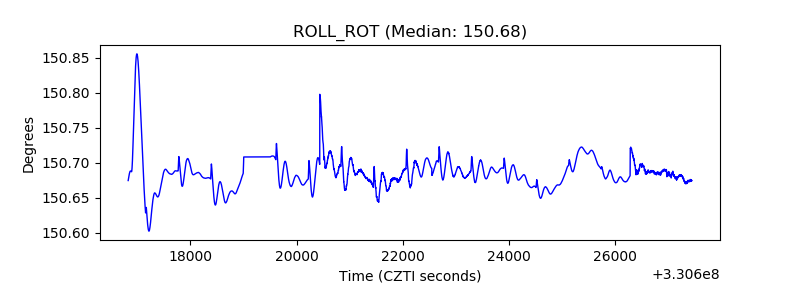 |
| _Roll_DEC | 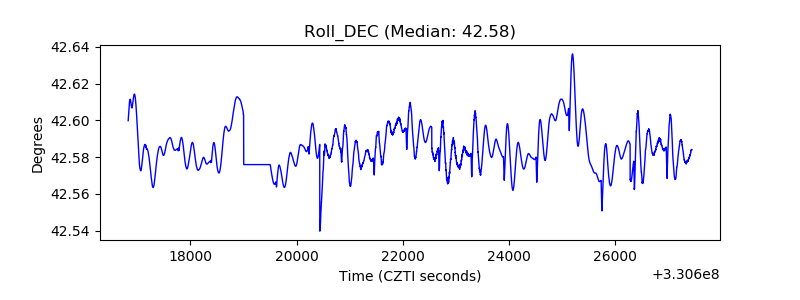 |
| _Roll_RA | 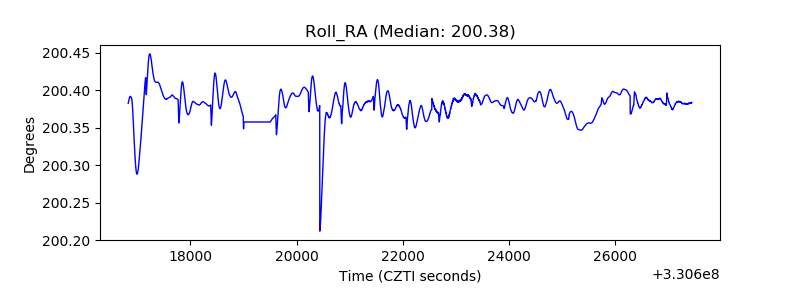 |
| Veto Counter | 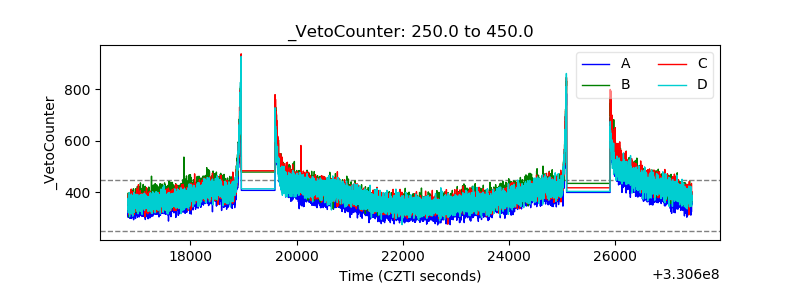 |