| Param | Original file | Final file |
|---|---|---|
| Filename | modeM0/AS1A09_081T01_9000003730_25615cztM0_level2.evt | modeM0/AS1A09_081T01_9000003730_25615cztM0_level2_quad_clean.evt |
| Size (bytes) | 440,170,560 | 90,826,560 |
| Size | 419.8 MB | 86.6 MB |
| Events in quadrant A | 3,241,508 | 584,599 |
| Events in quadrant B | 3,093,418 | 596,628 |
| Events in quadrant C | 3,047,406 | 568,401 |
| Events in quadrant D | 3,515,291 | 556,606 |
| Mode M9 | |||
|---|---|---|---|
| Quadrant | BADHDUFLAG | Total packets | Discarded packets |
| A | 0 | 10 | 0 |
| B | 0 | 10 | 0 |
| C | 0 | 10 | 0 |
| D | 0 | 10 | 0 |
| Mode M0 | |||
|---|---|---|---|
| Quadrant | BADHDUFLAG | Total packets | Discarded packets |
| A | 0 | 13663 | 0 |
| B | 0 | 13352 | 0 |
| C | 0 | 13154 | 0 |
| D | 0 | 14657 | 0 |
| Quadrant | Total seconds | Saturated seconds | Saturation percentage |
|---|---|---|---|
| A | 6365 | 61 | 0.958366% |
| B | 6366 | 28 | 0.439837% |
| C | 6366 | 50 | 0.785423% |
| D | 6366 | 88 | 1.382344% |
Noise dominated data is calculated using 1-second bins in cleaned event files. If a bin has >2000 counts, and if more than 50% of those come from <1% of pixels, then it is considered to be noise-dominated and hence unusable.
| Quadrant | # 1 sec bins | Bins with >0 counts | Bins with >2000 counts | High rate bins dominated by noise | Noise dominated (total time) | Noise dominated (detector-on time) | Marked lightcurve |
|---|---|---|---|---|---|---|---|
| A | 7355 | 6366 | 25 | 25 | 0.34% | 0.39% | 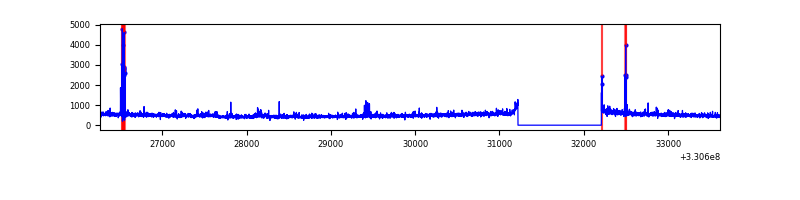 |
| B | 7356 | 6367 | 0 | 0 | 0.00% | 0.00% | 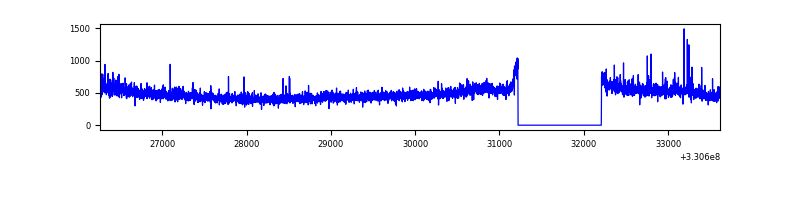 |
| C | 7356 | 6367 | 0 | 0 | 0.00% | 0.00% | 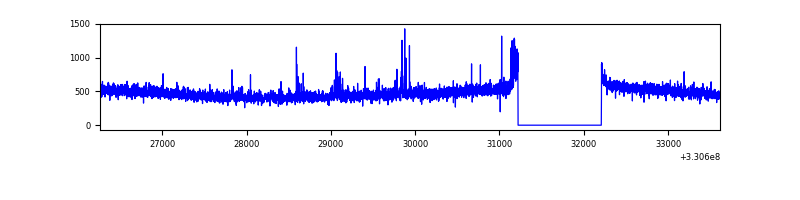 |
| D | 7356 | 6367 | 62 | 62 | 0.84% | 0.97% | 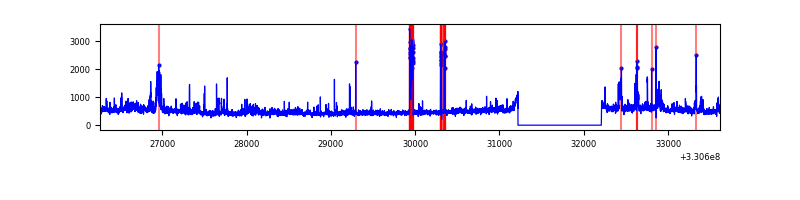 |
Top three noisy pixels from each quadrant. If the there are fewer than three noisy pixels in the level2.evt file, extra rows are filled as -1
| Pixel properties | Quadrant properties | ||||||
|---|---|---|---|---|---|---|---|
| Quadrant | DetID | PixID | Counts | Sigma | Mean | Median | Sigma |
| A | 0 | 13 | 124715 | 804.3 | 759 | 743 | 154.1 |
| A | 8 | 192 | 121237 | 781.74 | 759 | 743 | 154.1 |
| A | 6 | 16 | 36625 | 232.79 | 759 | 743 | 154.1 |
| B | 0 | 219 | 58802 | 403.28 | 761 | 741 | 144.0 |
| B | 0 | 245 | 20217 | 135.28 | 761 | 741 | 144.0 |
| B | 0 | 190 | 18227 | 121.45 | 761 | 741 | 144.0 |
| C | 14 | 238 | 117440 | 673.35 | 737 | 741 | 173.3 |
| C | 5 | 112 | 42736 | 242.31 | 737 | 741 | 173.3 |
| C | 3 | 233 | 11954 | 64.7 | 737 | 741 | 173.3 |
| D | 1 | 52 | 337650 | 1866.82 | 742 | 720 | 180.5 |
| D | 8 | 195 | 203476 | 1123.41 | 742 | 720 | 180.5 |
| D | 7 | 238 | 121353 | 668.39 | 742 | 720 | 180.5 |
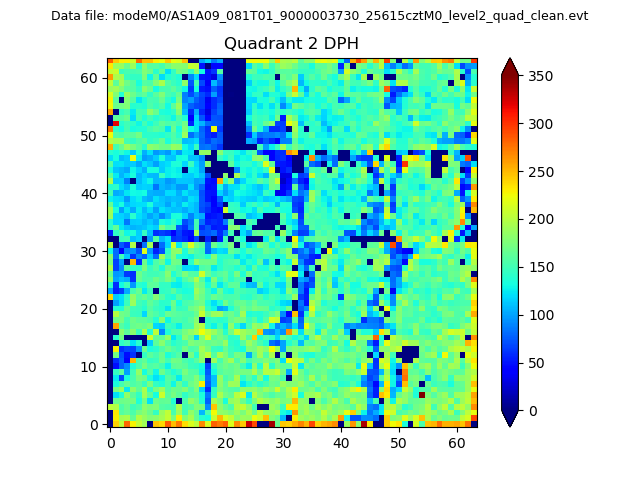
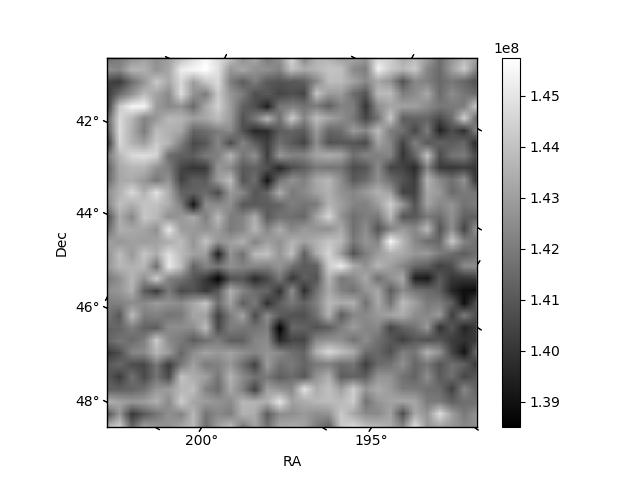
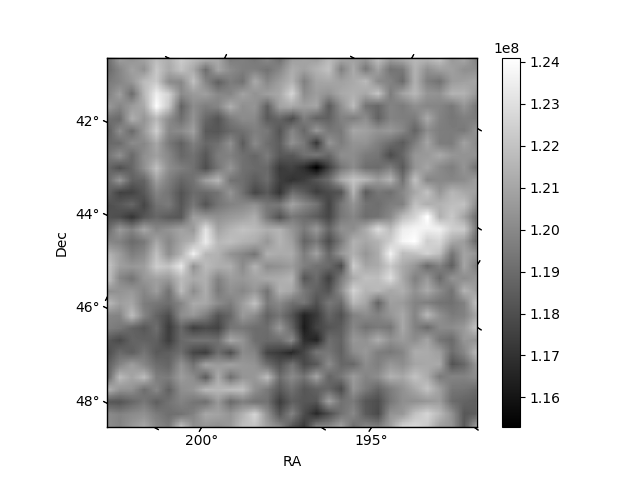
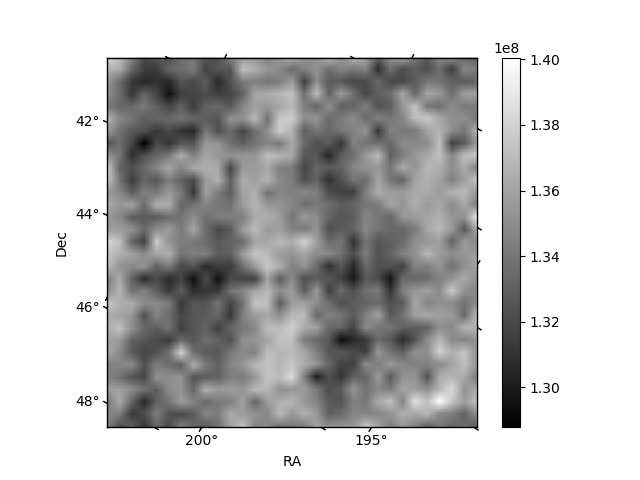
Histogram calculated using DETX and DETY for each event in the final _common_clean file
| Quadrant A | 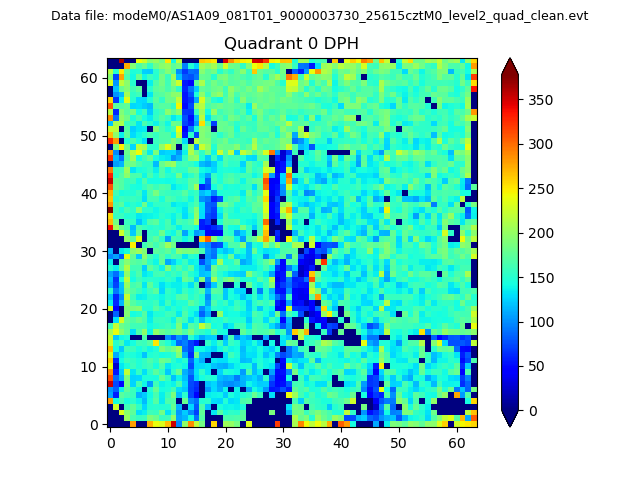 |
 |
Quadrant B |
|---|---|---|---|
| Quadrant D |  |
 |
Quadrant C |
| Plot type | Count rate plots | Images |
|---|---|---|
| Comparison with Poisson distribution Blue bars denote a histogram of data divided into 1 sec bins. Red curve is a Poisson curve with rate = median count rate of data. |
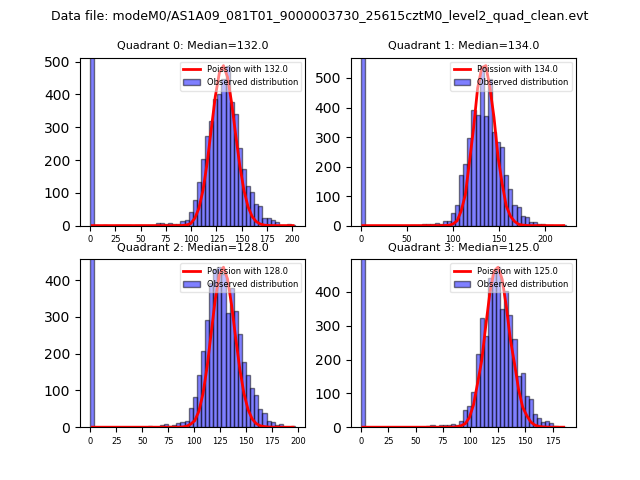 |
 |
| Quadrant-wise count rates Data is divided into 100 sec bins |
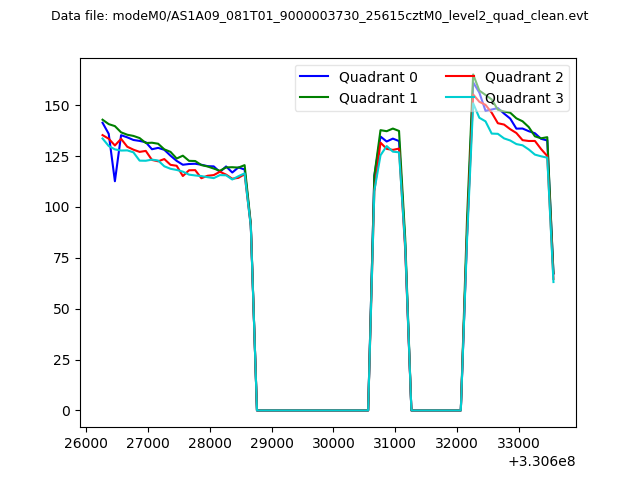 |
|
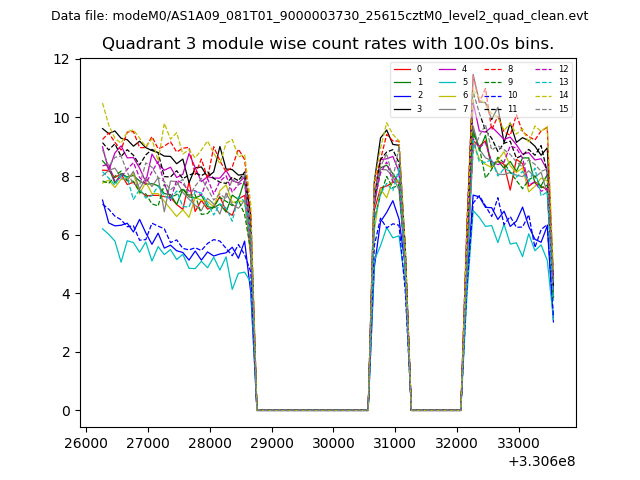
| Module-wise count rates for Quadrant A Data is divided into 100 sec bins |
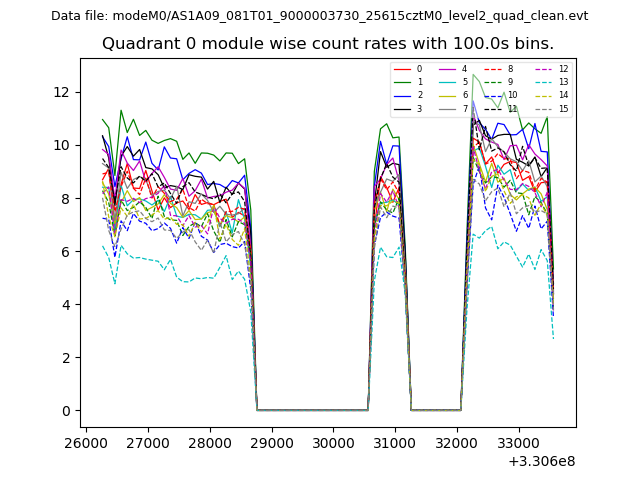 |
 |
| Module-wise count rates for Quadrant B Data is divided into 100 sec bins |
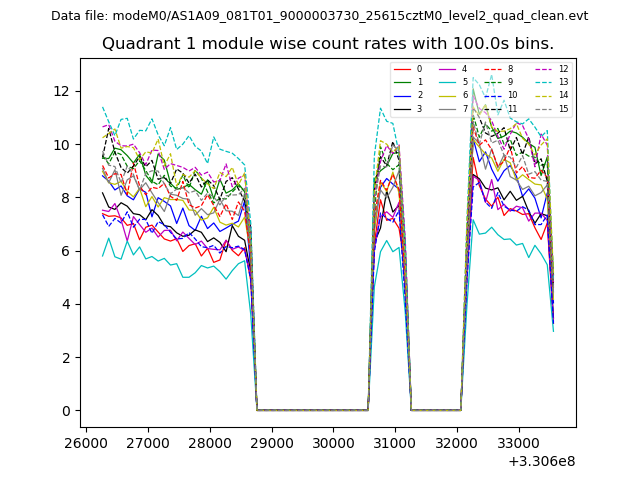 |
 |
| Module-wise count rates for Quadrant C Data is divided into 100 sec bins |
 |
 |
| Module-wise count rates for Quadrant D Data is divided into 100 sec bins |
 |
 |
| Parameter | Plot |
|---|---|
| CZT HV Monitor |  |
| D_VDD | 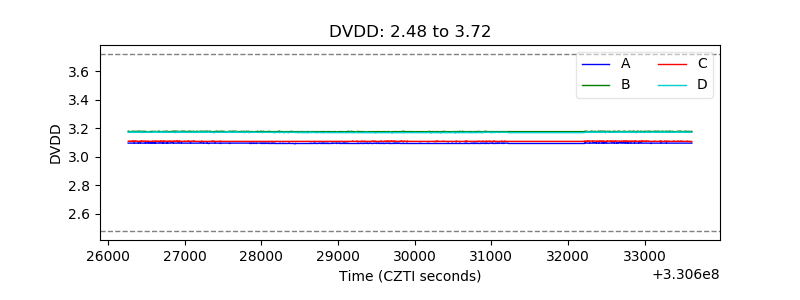 |
| Temperature 1 | 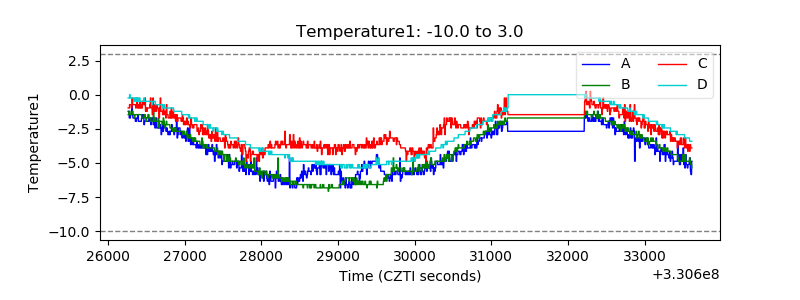 |
| Veto HV Monitor | 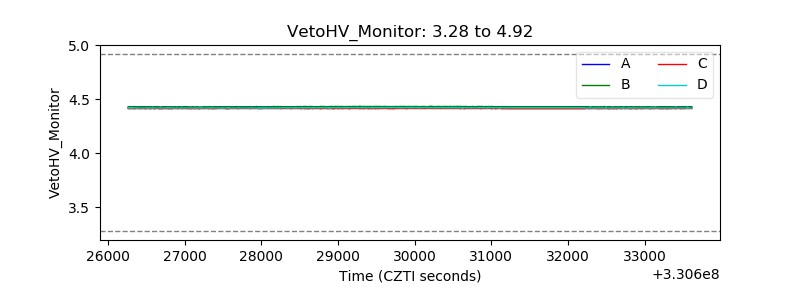 |
| Veto LLD | 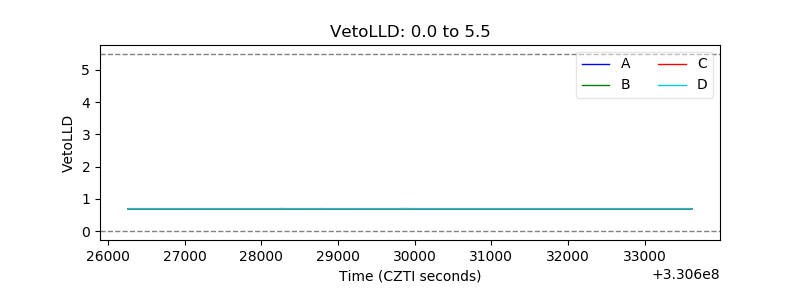 |
| Alpha Counter | 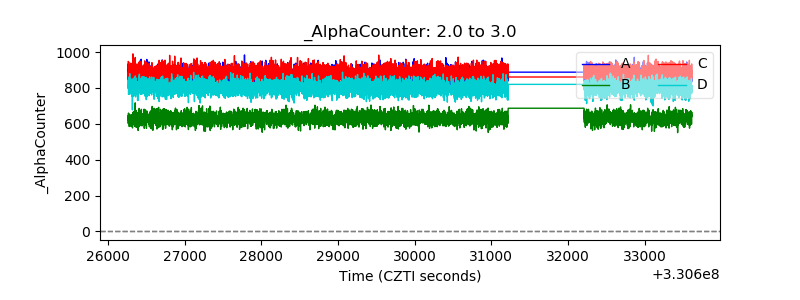 |
| _CPM_Rate | 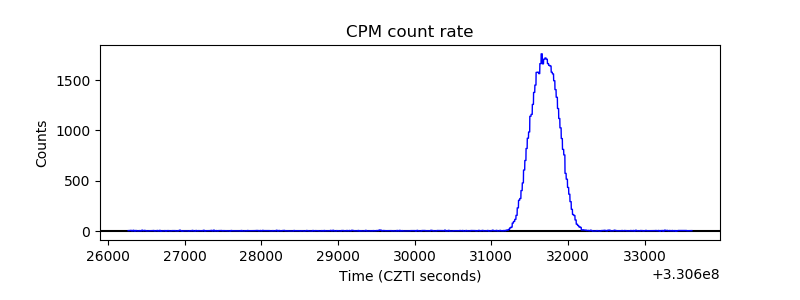 |
| CZT Counter | 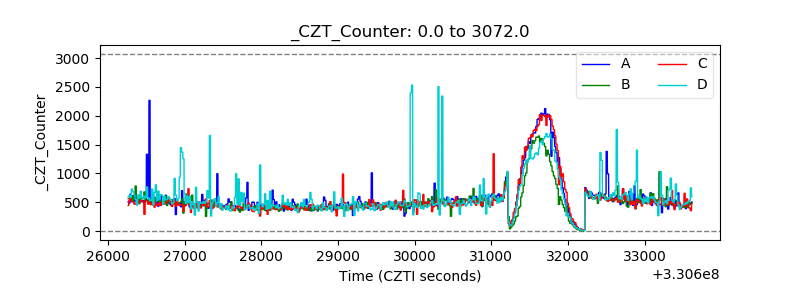 |
| +2.5 Volts monitor |  |
| +5 Volts monitor |  |
| _ROLL_ROT | 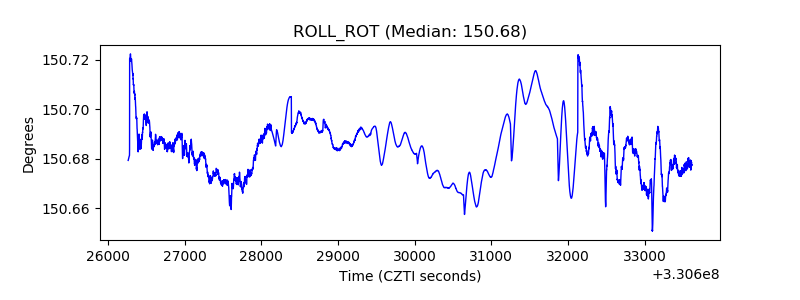 |
| _Roll_DEC | 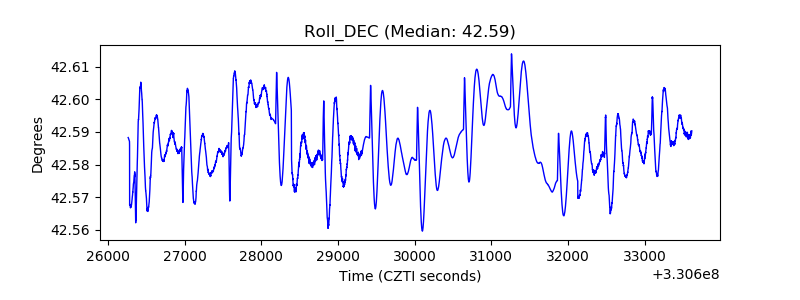 |
| _Roll_RA | 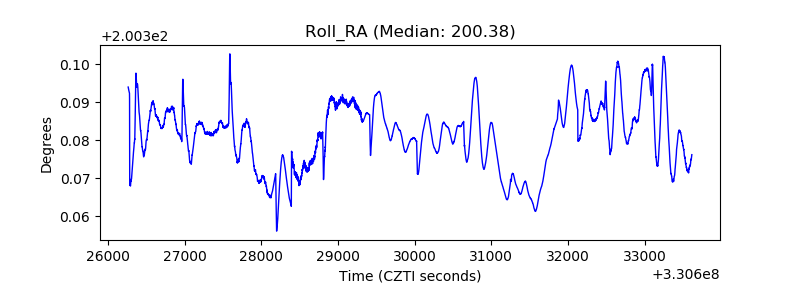 |
| Veto Counter | 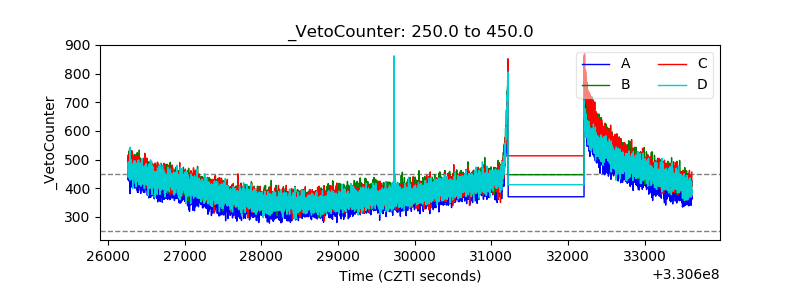 |