| Param | Original file | Final file |
|---|---|---|
| Filename | modeM0/AS1A09_081T01_9000003730_25617cztM0_level2.evt | modeM0/AS1A09_081T01_9000003730_25617cztM0_level2_quad_clean.evt |
| Size (bytes) | 451,350,720 | 95,578,560 |
| Size | 430.4 MB | 91.2 MB |
| Events in quadrant A | 3,313,734 | 622,833 |
| Events in quadrant B | 3,213,668 | 638,404 |
| Events in quadrant C | 3,091,429 | 606,116 |
| Events in quadrant D | 3,618,976 | 584,018 |
| Mode M9 | |||
|---|---|---|---|
| Quadrant | BADHDUFLAG | Total packets | Discarded packets |
| A | 0 | 14 | 0 |
| B | 0 | 15 | 0 |
| C | 0 | 15 | 0 |
| D | 0 | 15 | 0 |
| Mode M0 | |||
|---|---|---|---|
| Quadrant | BADHDUFLAG | Total packets | Discarded packets |
| A | 0 | 13912 | 0 |
| B | 0 | 13709 | 0 |
| C | 0 | 13307 | 0 |
| D | 0 | 14911 | 0 |
| Quadrant | Total seconds | Saturated seconds | Saturation percentage |
|---|---|---|---|
| A | 6355 | 25 | 0.393391% |
| B | 6355 | 26 | 0.409127% |
| C | 6354 | 48 | 0.755430% |
| D | 6354 | 26 | 0.409191% |
Noise dominated data is calculated using 1-second bins in cleaned event files. If a bin has >2000 counts, and if more than 50% of those come from <1% of pixels, then it is considered to be noise-dominated and hence unusable.
| Quadrant | # 1 sec bins | Bins with >0 counts | Bins with >2000 counts | High rate bins dominated by noise | Noise dominated (total time) | Noise dominated (detector-on time) | Marked lightcurve |
|---|---|---|---|---|---|---|---|
| A | 7500 | 6356 | 6 | 6 | 0.08% | 0.09% | 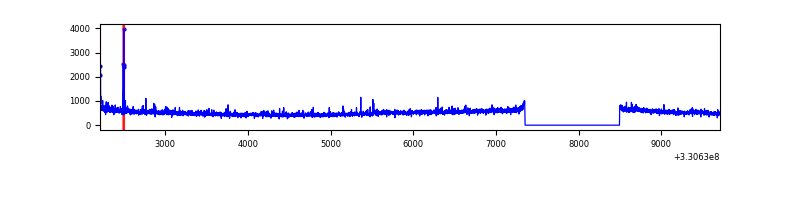 |
| B | 7500 | 6356 | 6 | 6 | 0.08% | 0.09% | 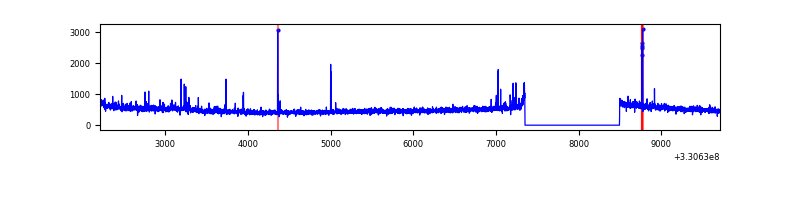 |
| C | 7499 | 6355 | 0 | 0 | 0.00% | 0.00% | 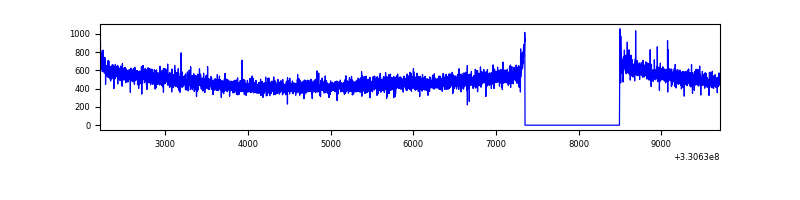 |
| D | 7499 | 6355 | 14 | 14 | 0.19% | 0.22% | 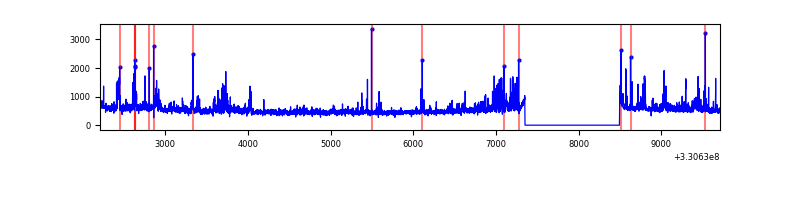 |
Top three noisy pixels from each quadrant. If the there are fewer than three noisy pixels in the level2.evt file, extra rows are filled as -1
| Pixel properties | Quadrant properties | ||||||
|---|---|---|---|---|---|---|---|
| Quadrant | DetID | PixID | Counts | Sigma | Mean | Median | Sigma |
| A | 8 | 192 | 197931 | 1258.42 | 779 | 764 | 156.7 |
| A | 0 | 13 | 53400 | 335.95 | 779 | 764 | 156.7 |
| A | 6 | 16 | 32535 | 202.78 | 779 | 764 | 156.7 |
| B | 0 | 219 | 50938 | 340.41 | 781 | 761 | 147.4 |
| B | 0 | 190 | 40601 | 270.28 | 781 | 761 | 147.4 |
| B | 5 | 172 | 36469 | 242.25 | 781 | 761 | 147.4 |
| C | 14 | 238 | 120641 | 676.04 | 755 | 759 | 177.3 |
| C | 3 | 233 | 20305 | 110.22 | 755 | 759 | 177.3 |
| C | 13 | 61 | 5165 | 24.85 | 755 | 759 | 177.3 |
| D | 1 | 52 | 337060 | 1819.72 | 758 | 736 | 184.8 |
| D | 8 | 195 | 256659 | 1384.7 | 758 | 736 | 184.8 |
| D | 7 | 238 | 107456 | 577.42 | 758 | 736 | 184.8 |
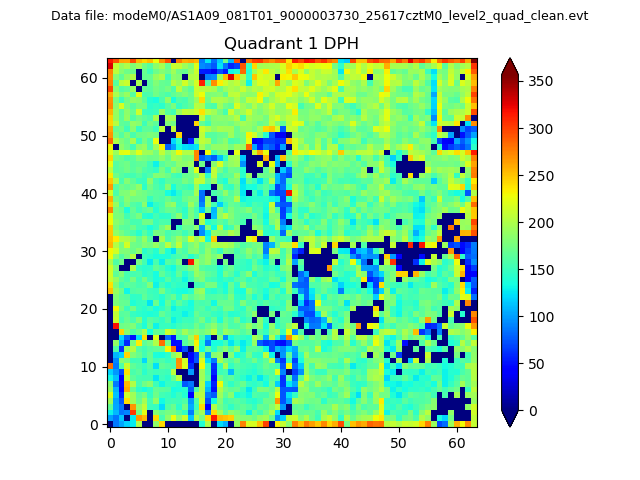
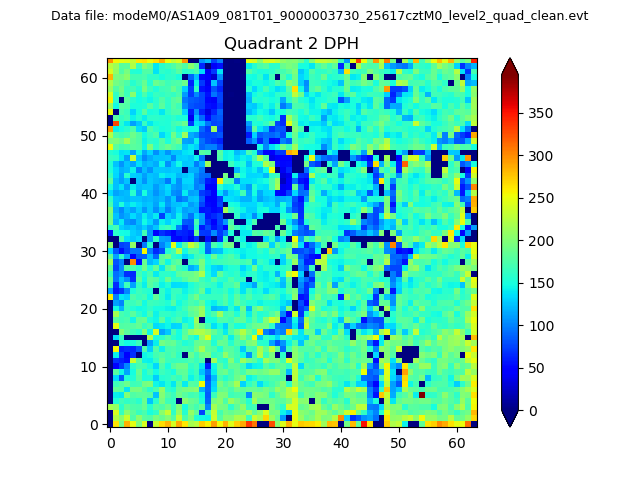
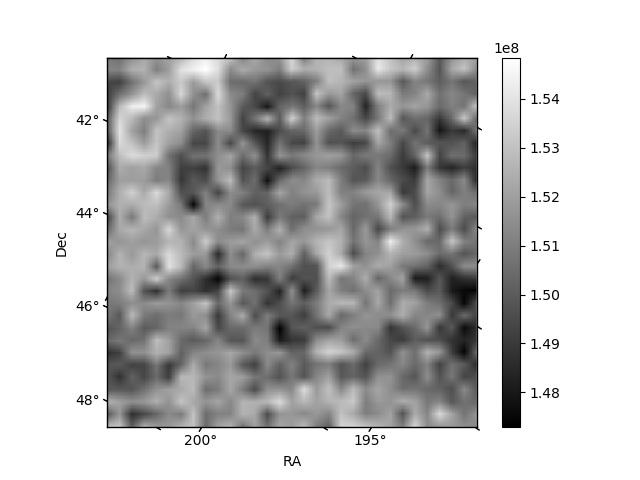
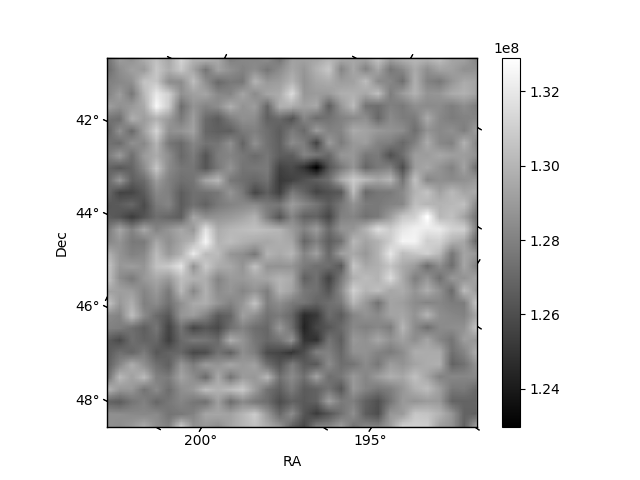
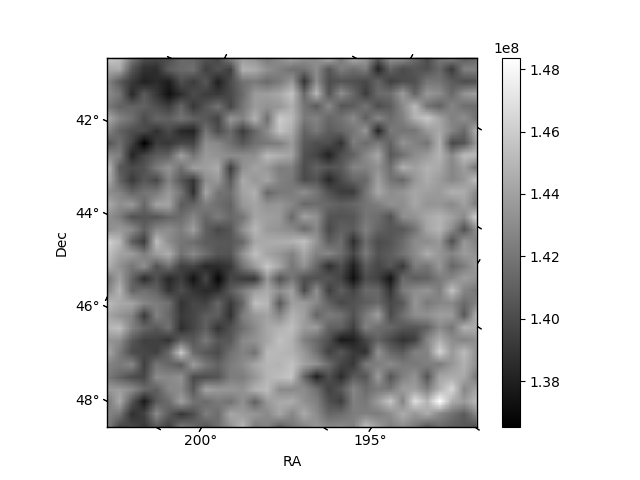
Histogram calculated using DETX and DETY for each event in the final _common_clean file
| Quadrant A |  |
 |
Quadrant B |
|---|---|---|---|
| Quadrant D |  |
 |
Quadrant C |
| Plot type | Count rate plots | Images |
|---|---|---|
| Comparison with Poisson distribution Blue bars denote a histogram of data divided into 1 sec bins. Red curve is a Poisson curve with rate = median count rate of data. |
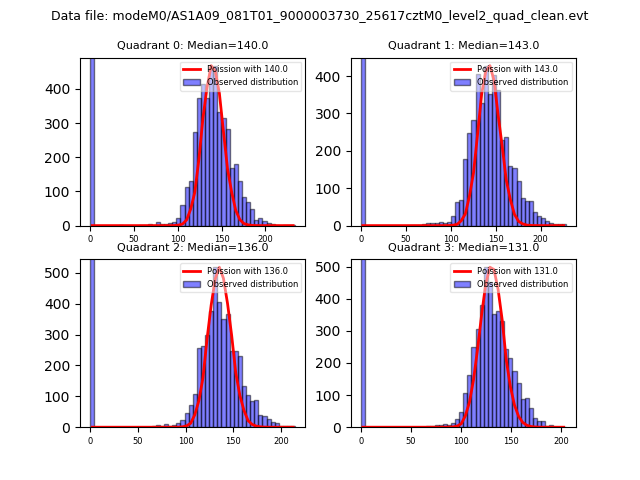 |
 |
| Quadrant-wise count rates Data is divided into 100 sec bins |
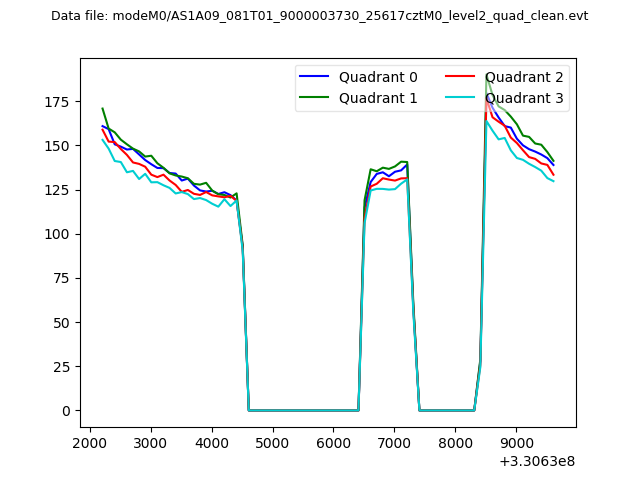 |
|
| Module-wise count rates for Quadrant A Data is divided into 100 sec bins |
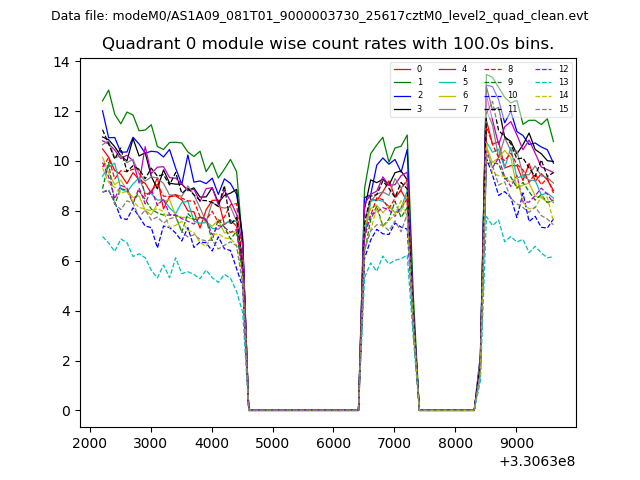 |
 |
| Module-wise count rates for Quadrant B Data is divided into 100 sec bins |
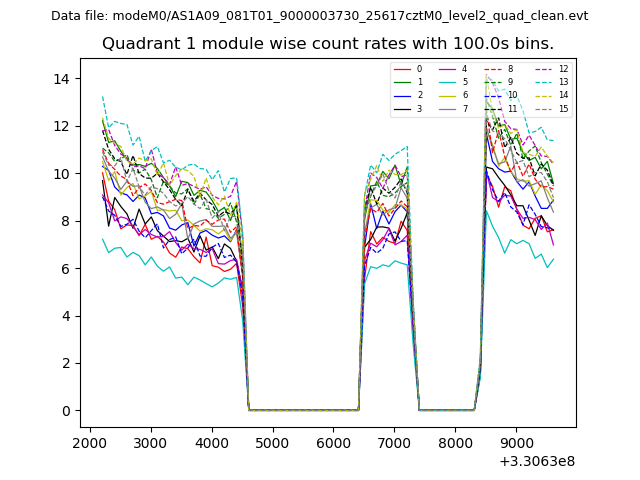 |
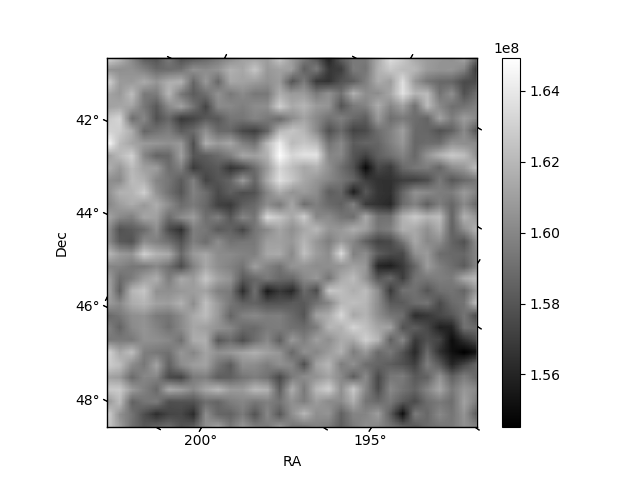 |
| Module-wise count rates for Quadrant C Data is divided into 100 sec bins |
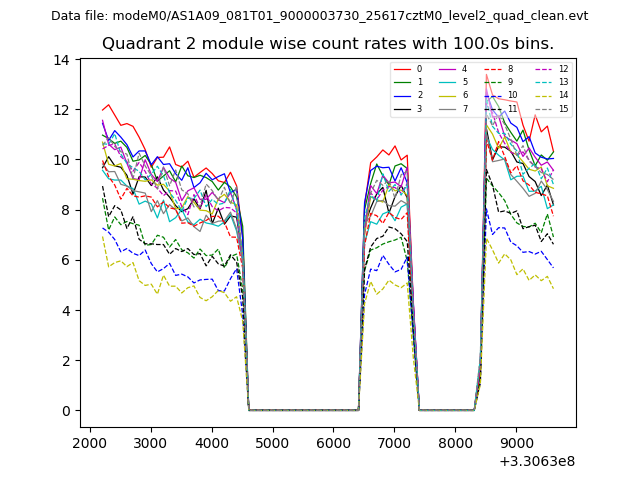 |
 |
| Module-wise count rates for Quadrant D Data is divided into 100 sec bins |
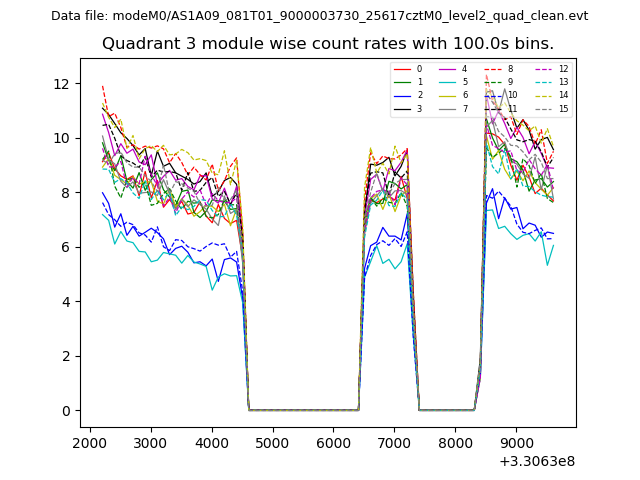 |
 |
| Parameter | Plot |
|---|---|
| CZT HV Monitor | 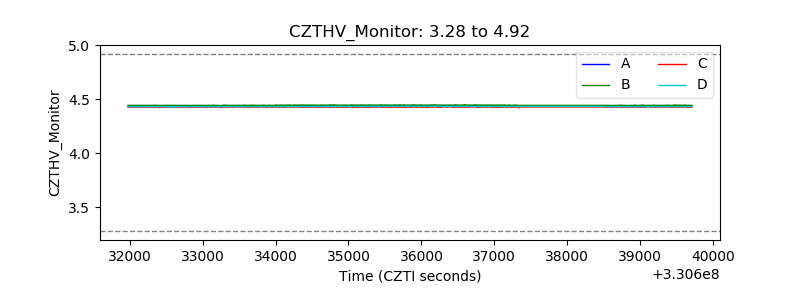 |
| D_VDD | 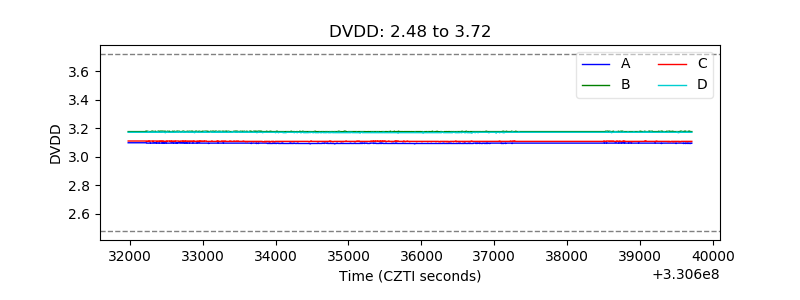 |
| Temperature 1 | 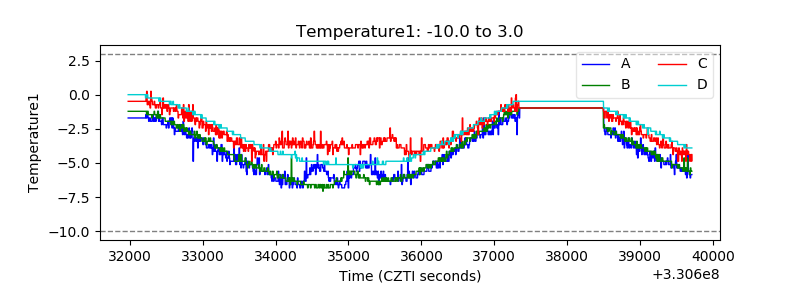 |
| Veto HV Monitor | 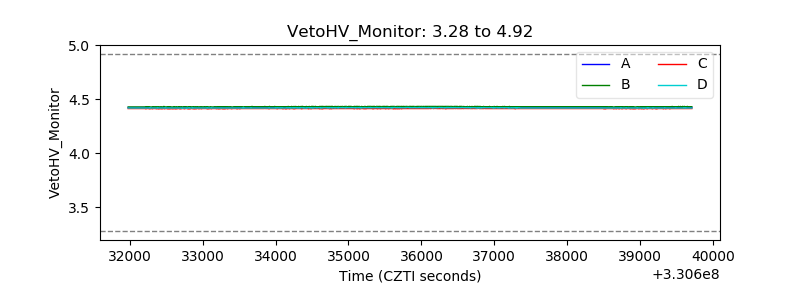 |
| Veto LLD | 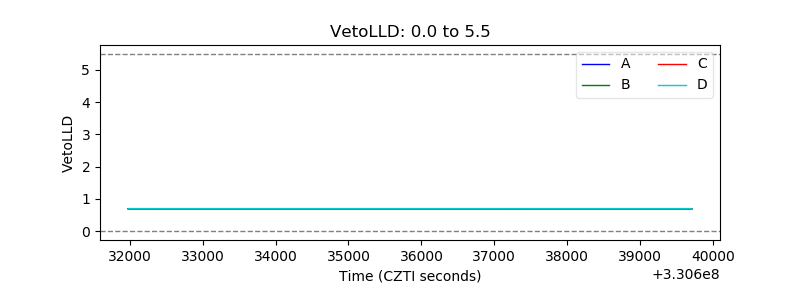 |
| Alpha Counter | 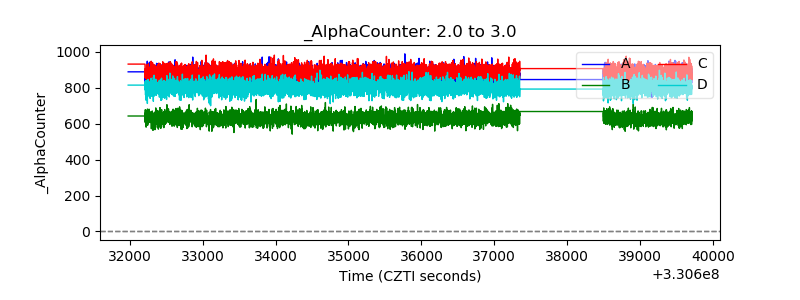 |
| _CPM_Rate | 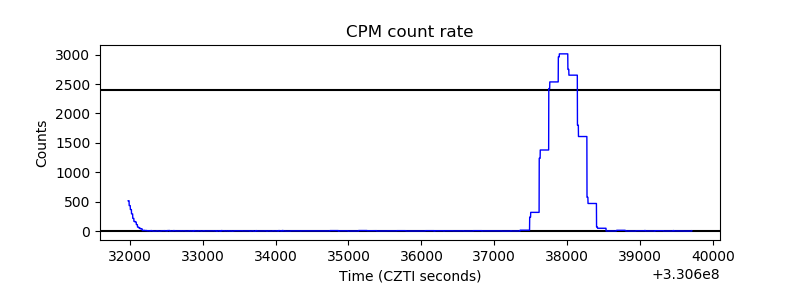 |
| CZT Counter | 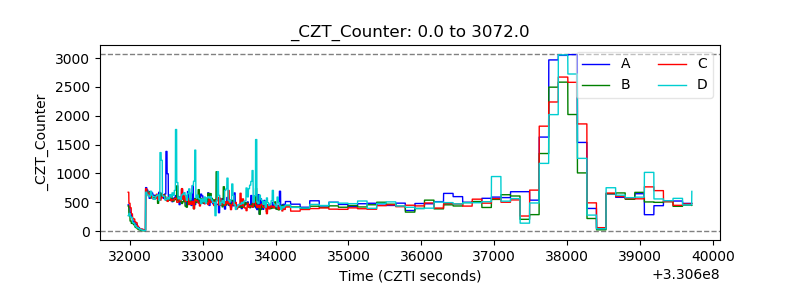 |
| +2.5 Volts monitor |  |
| +5 Volts monitor |  |
| _ROLL_ROT | 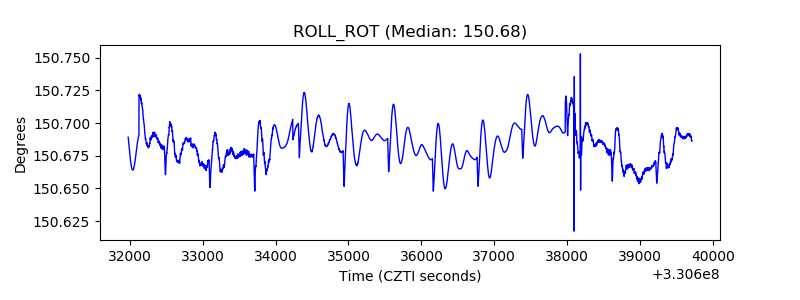 |
| _Roll_DEC | 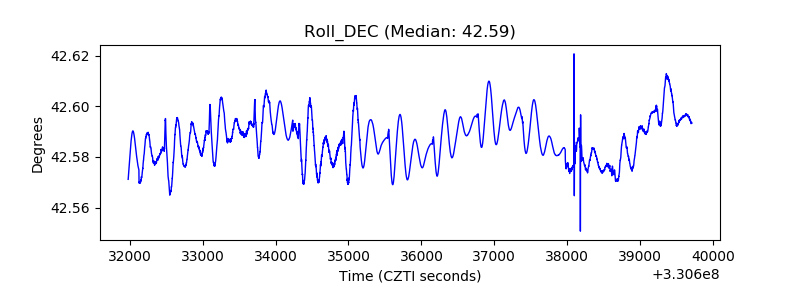 |
| _Roll_RA | 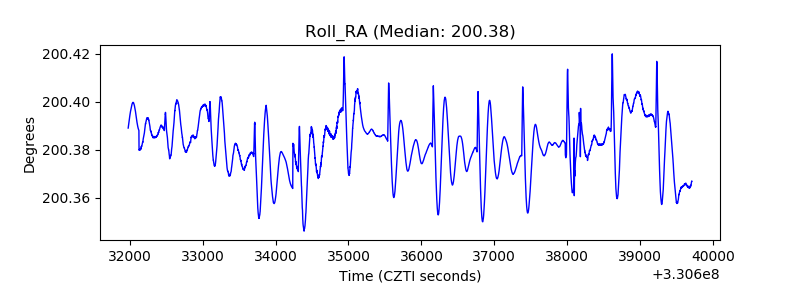 |
| Veto Counter | 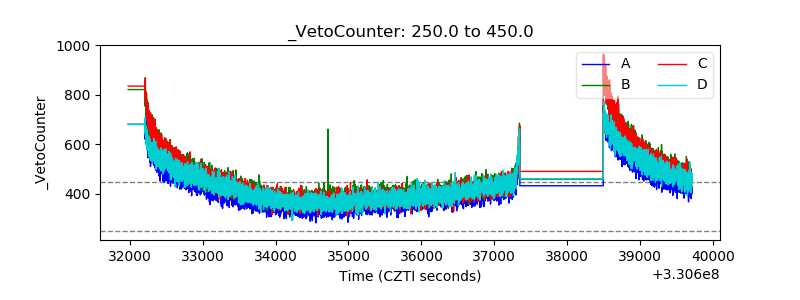 |