| Param | Original file | Final file |
|---|---|---|
| Filename | modeM0/AS1A09_081T01_9000003730_25618cztM0_level2.evt | modeM0/AS1A09_081T01_9000003730_25618cztM0_level2_quad_clean.evt |
| Size (bytes) | 482,443,200 | 98,925,120 |
| Size | 460.1 MB | 94.3 MB |
| Events in quadrant A | 4,303,736 | 631,499 |
| Events in quadrant B | 3,245,644 | 678,086 |
| Events in quadrant C | 3,138,108 | 636,159 |
| Events in quadrant D | 3,495,772 | 610,625 |
| Mode M9 | |||
|---|---|---|---|
| Quadrant | BADHDUFLAG | Total packets | Discarded packets |
| A | 0 | 21 | 0 |
| B | 0 | 22 | 0 |
| C | 0 | 22 | 0 |
| D | 0 | 22 | 0 |
| Mode M0 | |||
|---|---|---|---|
| Quadrant | BADHDUFLAG | Total packets | Discarded packets |
| A | 0 | 16797 | 0 |
| B | 0 | 13661 | 0 |
| C | 0 | 13329 | 0 |
| D | 0 | 14642 | 0 |
| Quadrant | Total seconds | Saturated seconds | Saturation percentage |
|---|---|---|---|
| A | 6299 | 338 | 5.365931% |
| B | 6299 | 22 | 0.349262% |
| C | 6299 | 40 | 0.635021% |
| D | 6298 | 24 | 0.381073% |
Noise dominated data is calculated using 1-second bins in cleaned event files. If a bin has >2000 counts, and if more than 50% of those come from <1% of pixels, then it is considered to be noise-dominated and hence unusable.
| Quadrant | # 1 sec bins | Bins with >0 counts | Bins with >2000 counts | High rate bins dominated by noise | Noise dominated (total time) | Noise dominated (detector-on time) | Marked lightcurve |
|---|---|---|---|---|---|---|---|
| A | 7549 | 6299 | 311 | 311 | 4.12% | 4.94% | 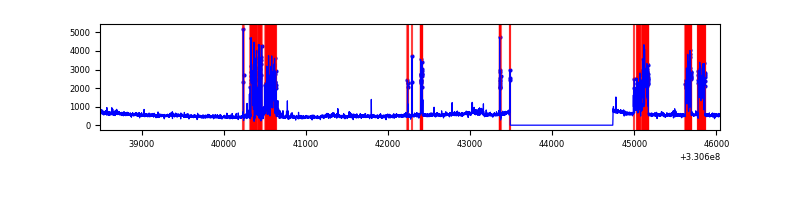 |
| B | 7549 | 6300 | 5 | 5 | 0.07% | 0.08% | 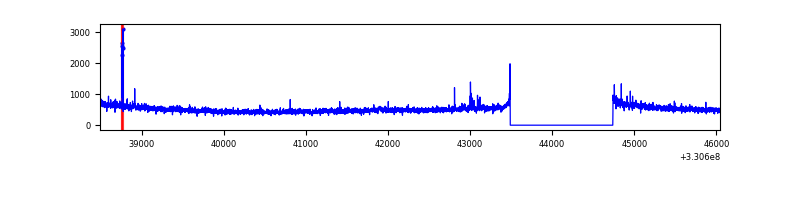 |
| C | 7549 | 6300 | 0 | 0 | 0.00% | 0.00% | 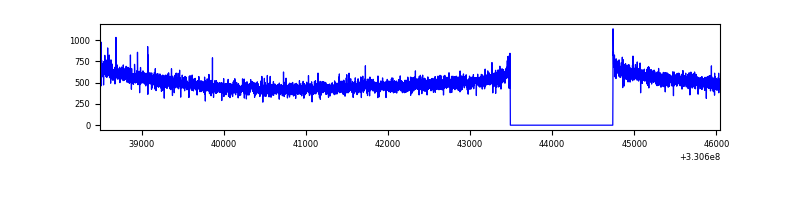 |
| D | 7548 | 6299 | 28 | 28 | 0.37% | 0.44% | 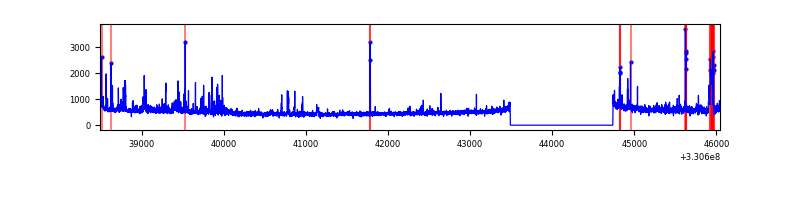 |
Top three noisy pixels from each quadrant. If the there are fewer than three noisy pixels in the level2.evt file, extra rows are filled as -1
| Pixel properties | Quadrant properties | ||||||
|---|---|---|---|---|---|---|---|
| Quadrant | DetID | PixID | Counts | Sigma | Mean | Median | Sigma |
| A | 0 | 13 | 1107693 | 7168.23 | 774 | 759 | 154.4 |
| A | 8 | 192 | 168263 | 1084.71 | 774 | 759 | 154.4 |
| A | 6 | 16 | 25945 | 163.1 | 774 | 759 | 154.4 |
| B | 0 | 190 | 27888 | 180.33 | 802 | 782 | 150.3 |
| B | 0 | 219 | 24892 | 160.4 | 802 | 782 | 150.3 |
| B | 5 | 172 | 18829 | 120.06 | 802 | 782 | 150.3 |
| C | 14 | 238 | 123422 | 683.37 | 768 | 774 | 179.5 |
| C | 3 | 233 | 10441 | 53.86 | 768 | 774 | 179.5 |
| C | 13 | 61 | 5283 | 25.12 | 768 | 774 | 179.5 |
| D | 1 | 52 | 326251 | 1740.44 | 766 | 744 | 187.0 |
| D | 8 | 195 | 205341 | 1093.95 | 766 | 744 | 187.0 |
| D | 13 | 174 | 29858 | 155.67 | 766 | 744 | 187.0 |
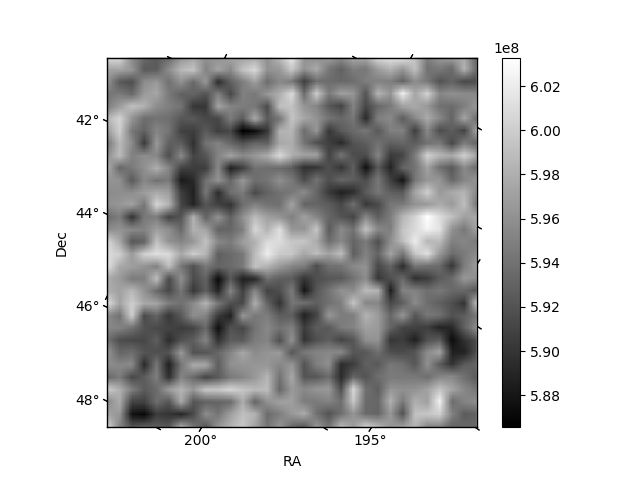
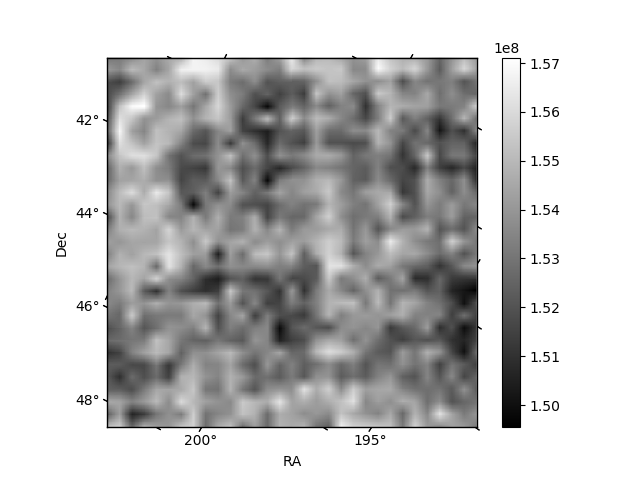
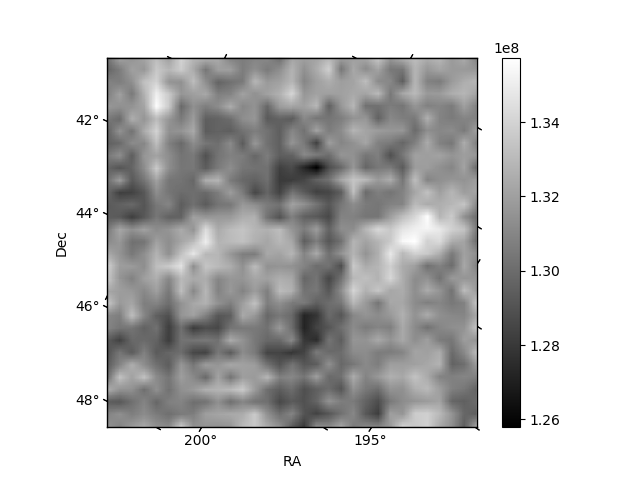
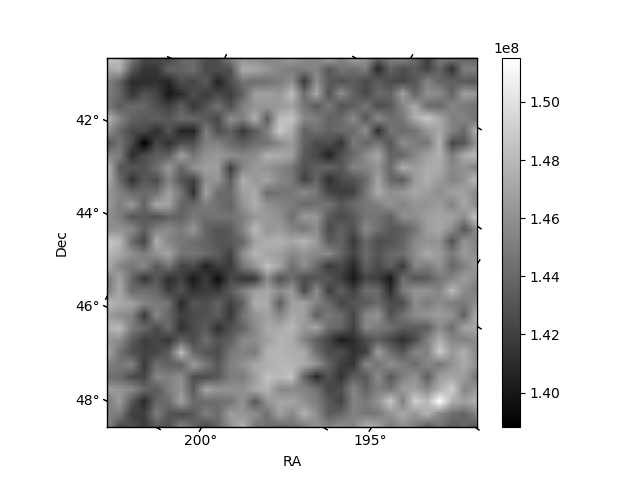
Histogram calculated using DETX and DETY for each event in the final _common_clean file
| Quadrant A | 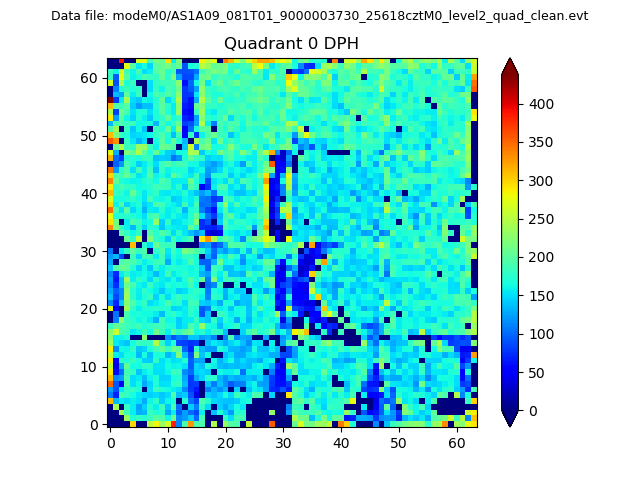 |
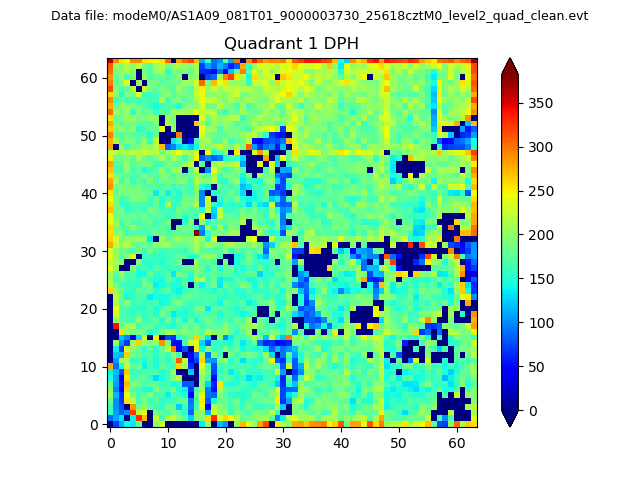 |
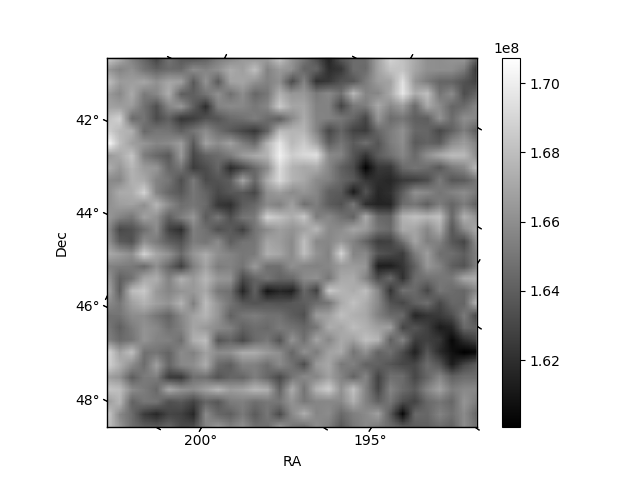
Quadrant B |
|---|---|---|---|
| Quadrant D | 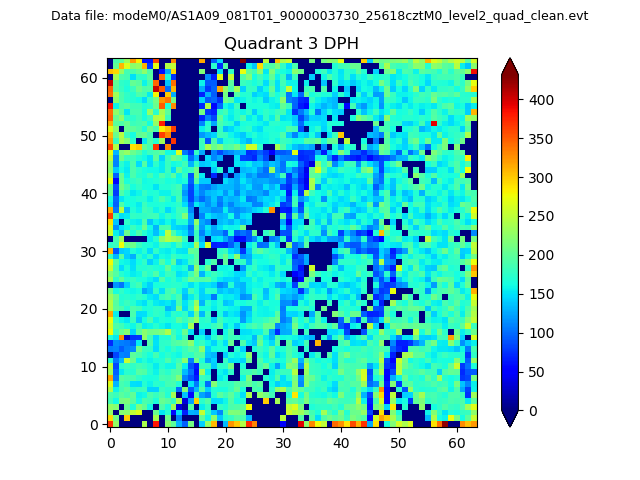 |
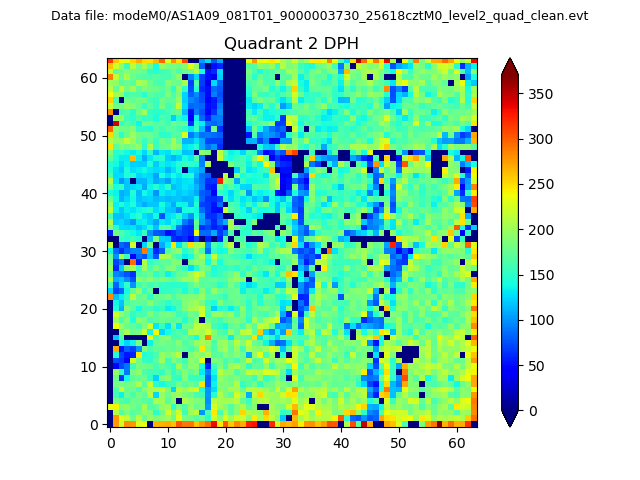 |
Quadrant C |
| Plot type | Count rate plots | Images |
|---|---|---|
| Comparison with Poisson distribution Blue bars denote a histogram of data divided into 1 sec bins. Red curve is a Poisson curve with rate = median count rate of data. |
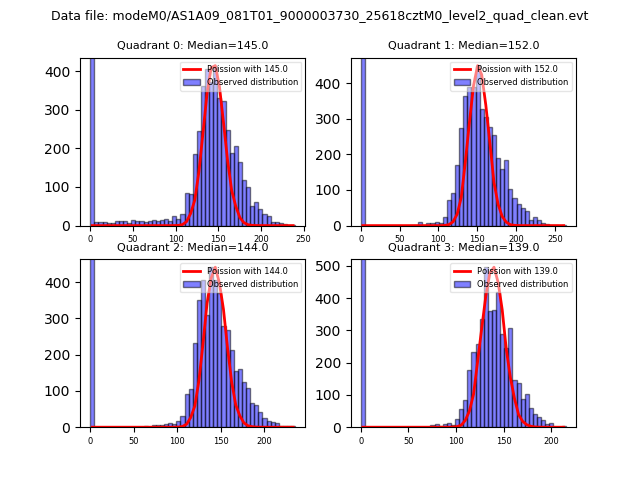 |
 |
| Quadrant-wise count rates Data is divided into 100 sec bins |
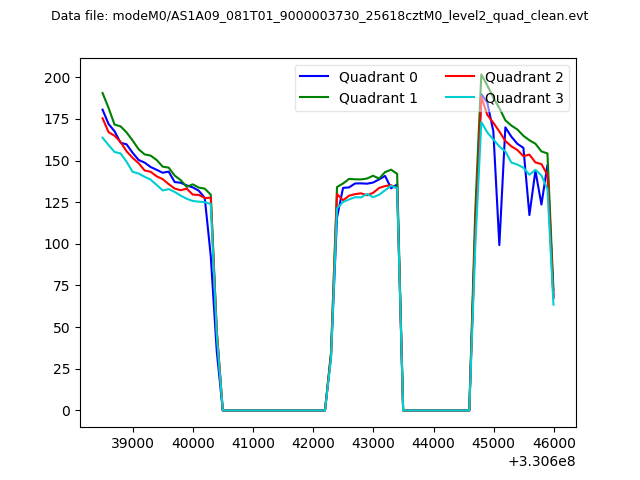 |
|
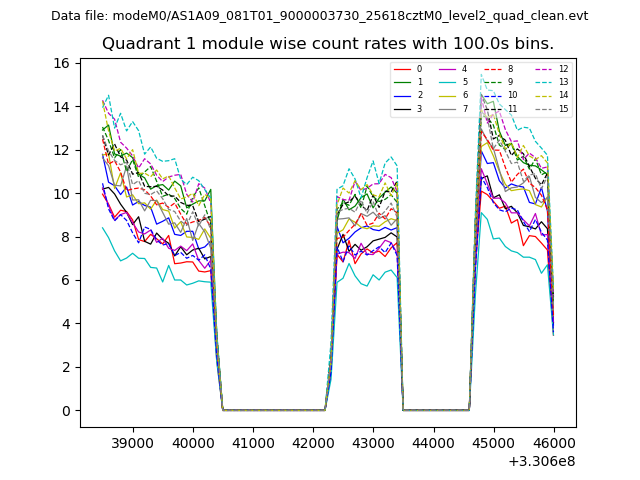
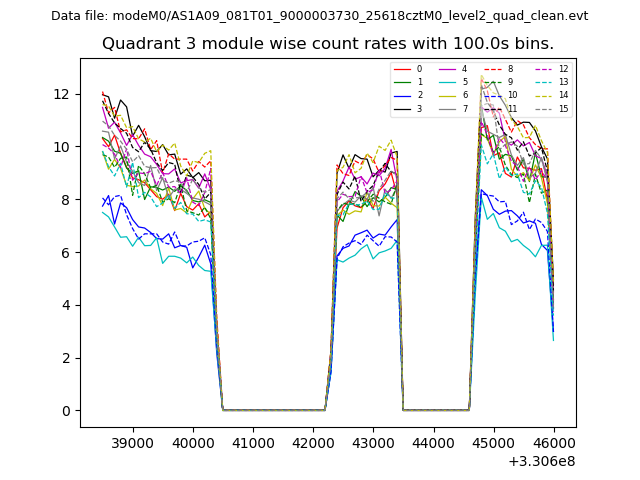
| Module-wise count rates for Quadrant A Data is divided into 100 sec bins |
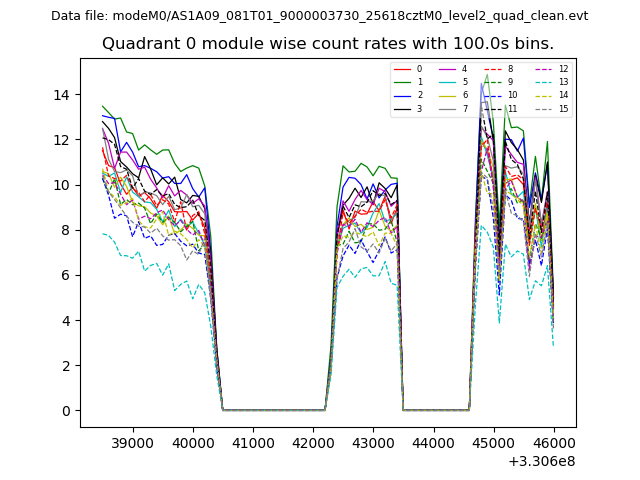 |
 |
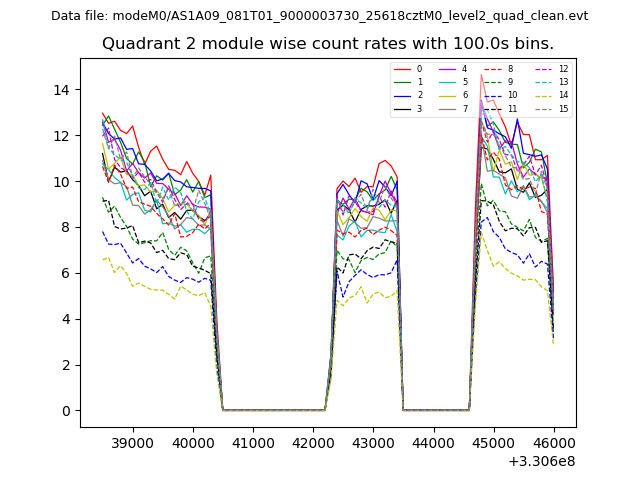
| Module-wise count rates for Quadrant B Data is divided into 100 sec bins |
 |
 |
| Module-wise count rates for Quadrant C Data is divided into 100 sec bins |
 |
 |
| Module-wise count rates for Quadrant D Data is divided into 100 sec bins |
 |
 |
| Parameter | Plot |
|---|---|
| CZT HV Monitor | 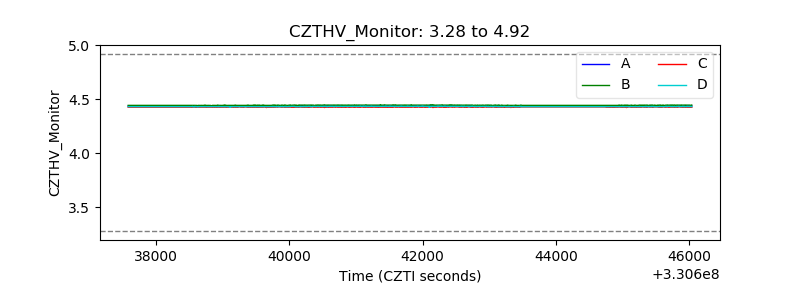 |
| D_VDD | 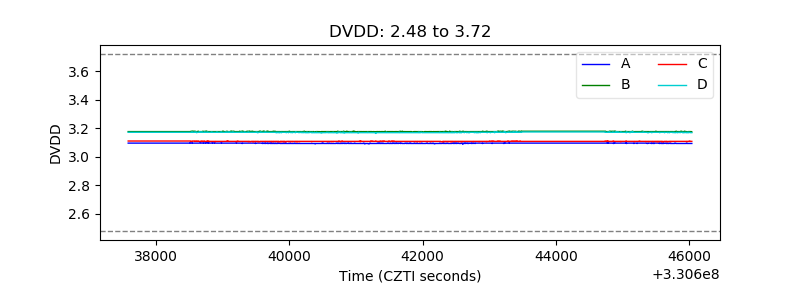 |
| Temperature 1 | 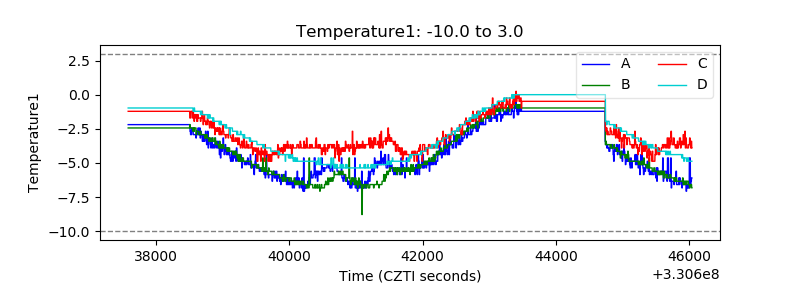 |
| Veto HV Monitor | 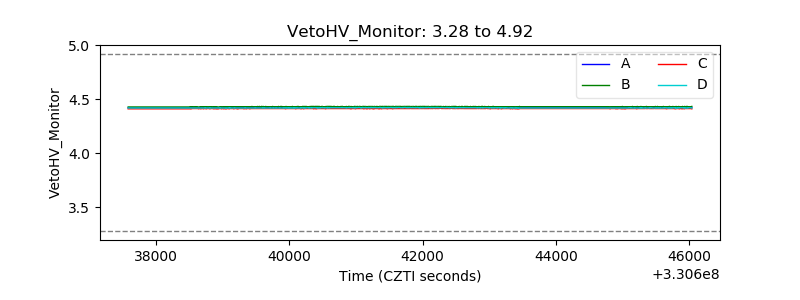 |
| Veto LLD | 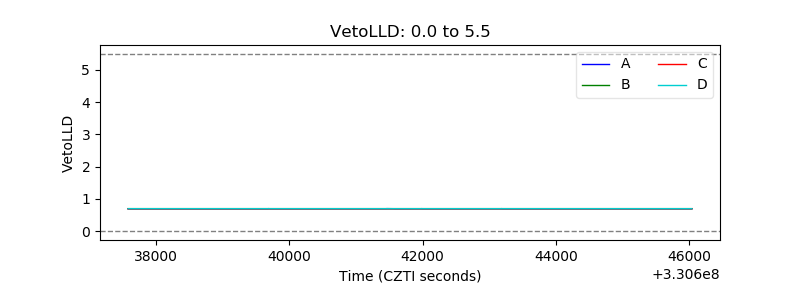 |
| Alpha Counter | 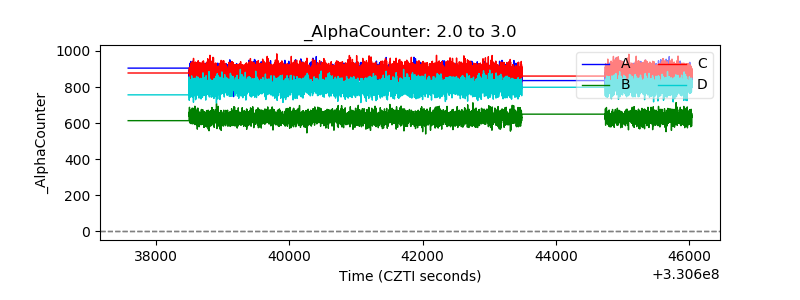 |
| _CPM_Rate | 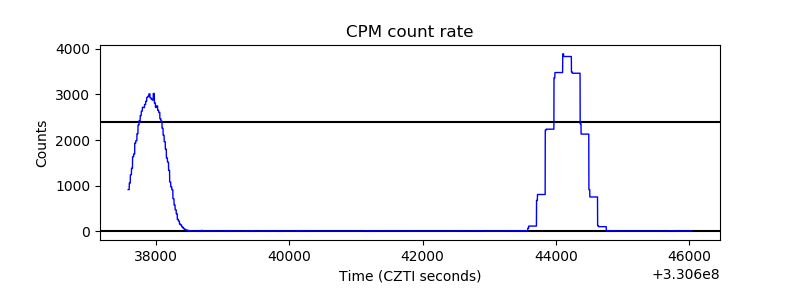 |
| CZT Counter | 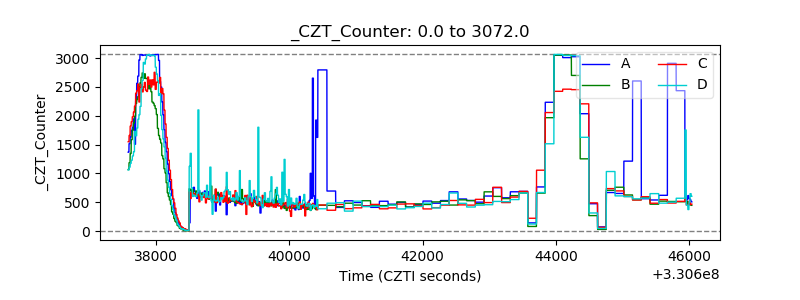 |
| +2.5 Volts monitor |  |
| +5 Volts monitor | 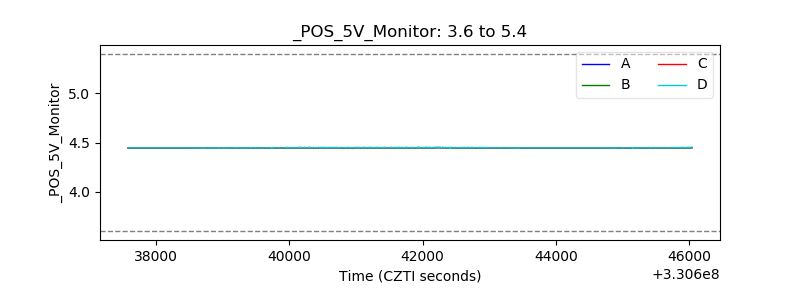 |
| _ROLL_ROT | 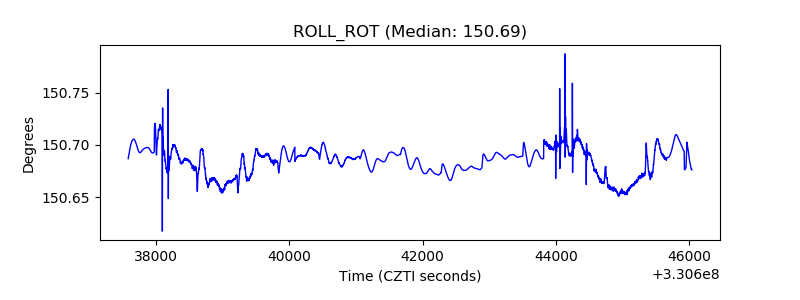 |
| _Roll_DEC | 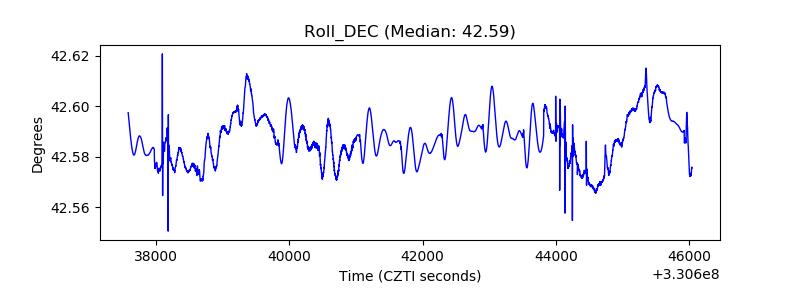 |
| _Roll_RA | 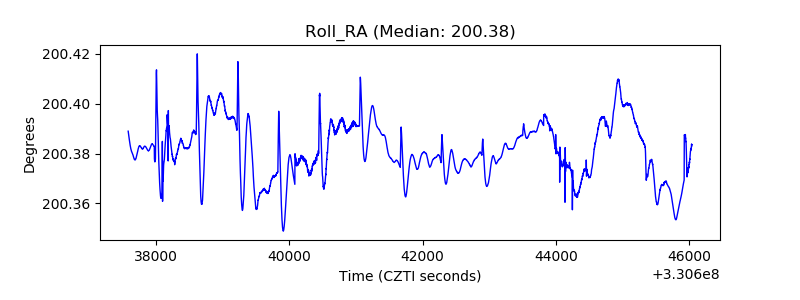 |
| Veto Counter | 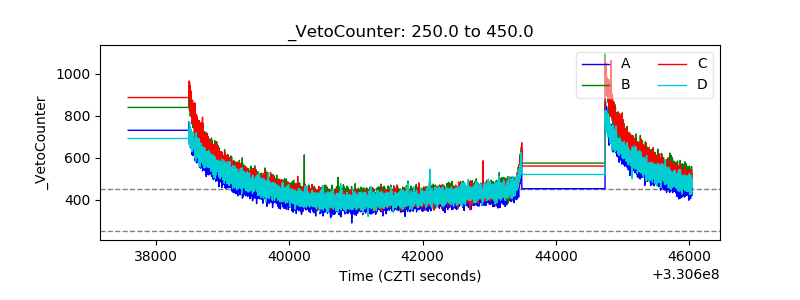 |