| Param | Original file | Final file |
|---|---|---|
| Filename | modeM0/AS1A09_081T01_9000003730_25619cztM0_level2.evt | modeM0/AS1A09_081T01_9000003730_25619cztM0_level2_quad_clean.evt |
| Size (bytes) | 484,404,480 | 98,562,240 |
| Size | 462.0 MB | 94.0 MB |
| Events in quadrant A | 4,167,327 | 637,935 |
| Events in quadrant B | 3,245,119 | 682,466 |
| Events in quadrant C | 3,160,845 | 634,202 |
| Events in quadrant D | 3,682,620 | 603,966 |
| Mode M9 | |||
|---|---|---|---|
| Quadrant | BADHDUFLAG | Total packets | Discarded packets |
| A | 0 | 19 | 0 |
| B | 0 | 20 | 0 |
| C | 0 | 20 | 0 |
| D | 0 | 20 | 0 |
| Mode M0 | |||
|---|---|---|---|
| Quadrant | BADHDUFLAG | Total packets | Discarded packets |
| A | 0 | 16421 | 0 |
| B | 0 | 13484 | 0 |
| C | 0 | 13140 | 0 |
| D | 0 | 15038 | 0 |
| Quadrant | Total seconds | Saturated seconds | Saturation percentage |
|---|---|---|---|
| A | 6115 | 205 | 3.352412% |
| B | 6115 | 33 | 0.539657% |
| C | 6115 | 61 | 0.997547% |
| D | 6115 | 58 | 0.948487% |
Noise dominated data is calculated using 1-second bins in cleaned event files. If a bin has >2000 counts, and if more than 50% of those come from <1% of pixels, then it is considered to be noise-dominated and hence unusable.
| Quadrant | # 1 sec bins | Bins with >0 counts | Bins with >2000 counts | High rate bins dominated by noise | Noise dominated (total time) | Noise dominated (detector-on time) | Marked lightcurve |
|---|---|---|---|---|---|---|---|
| A | 7425 | 6116 | 162 | 162 | 2.18% | 2.65% | 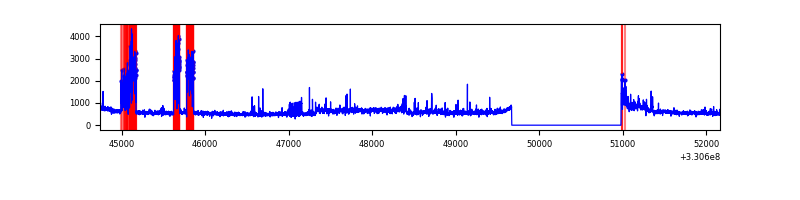 |
| B | 7425 | 6116 | 2 | 2 | 0.03% | 0.03% | 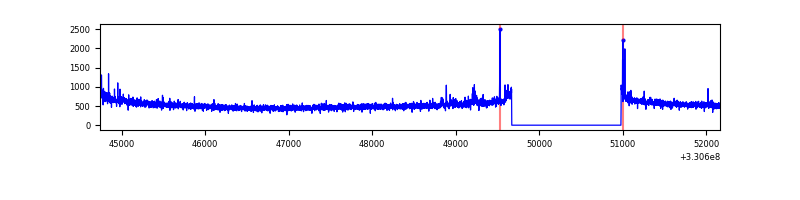 |
| C | 7425 | 6116 | 0 | 0 | 0.00% | 0.00% | 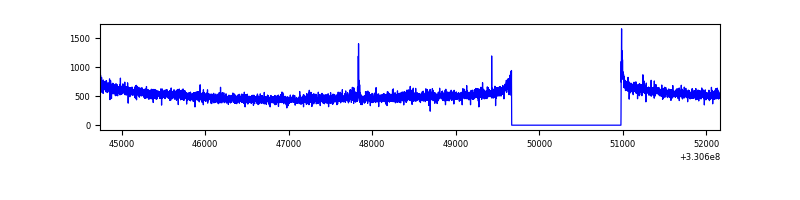 |
| D | 7425 | 6116 | 47 | 47 | 0.63% | 0.77% | 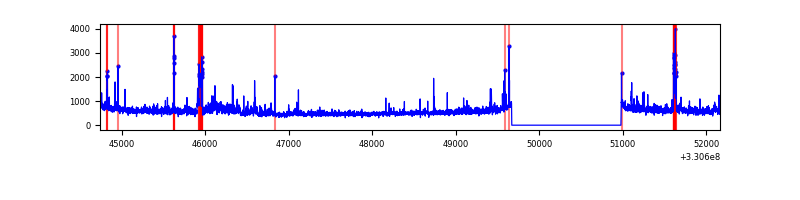 |
Top three noisy pixels from each quadrant. If the there are fewer than three noisy pixels in the level2.evt file, extra rows are filled as -1
| Pixel properties | Quadrant properties | ||||||
|---|---|---|---|---|---|---|---|
| Quadrant | DetID | PixID | Counts | Sigma | Mean | Median | Sigma |
| A | 0 | 13 | 671592 | 4248.38 | 790 | 776 | 157.9 |
| A | 8 | 192 | 417937 | 2641.95 | 790 | 776 | 157.9 |
| A | 6 | 16 | 21860 | 133.53 | 790 | 776 | 157.9 |
| B | 0 | 219 | 21296 | 136.76 | 807 | 788 | 150.0 |
| B | 0 | 190 | 19085 | 122.02 | 807 | 788 | 150.0 |
| B | 12 | 111 | 17309 | 110.17 | 807 | 788 | 150.0 |
| C | 14 | 238 | 126518 | 701.27 | 771 | 779 | 179.3 |
| C | 3 | 233 | 19019 | 101.73 | 771 | 779 | 179.3 |
| C | 0 | 10 | 8605 | 43.65 | 771 | 779 | 179.3 |
| D | 8 | 195 | 316880 | 1707.69 | 767 | 743 | 185.1 |
| D | 1 | 52 | 237896 | 1281.04 | 767 | 743 | 185.1 |
| D | 13 | 174 | 111580 | 598.71 | 767 | 743 | 185.1 |
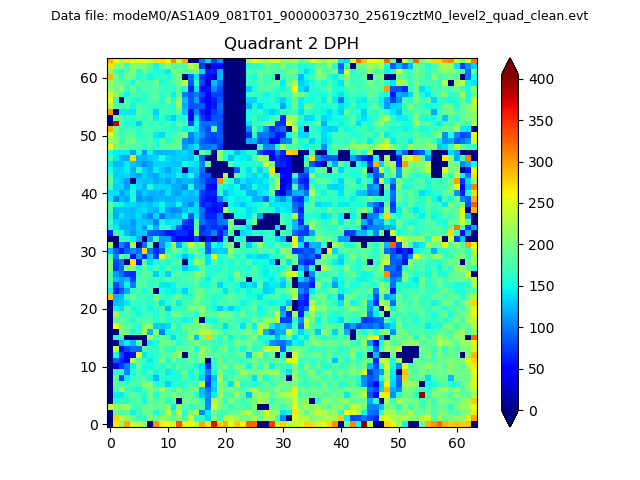
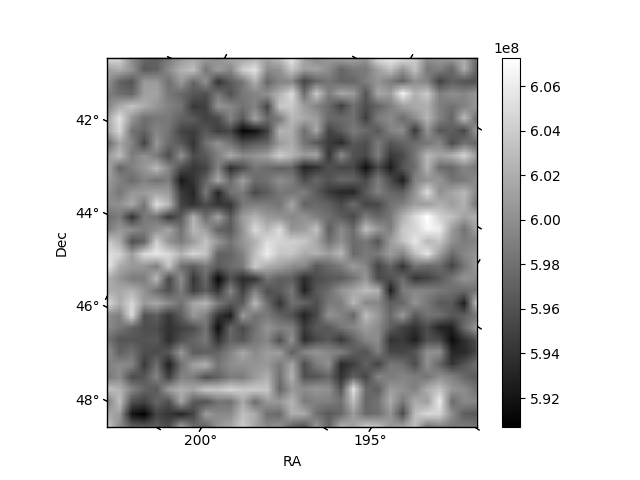
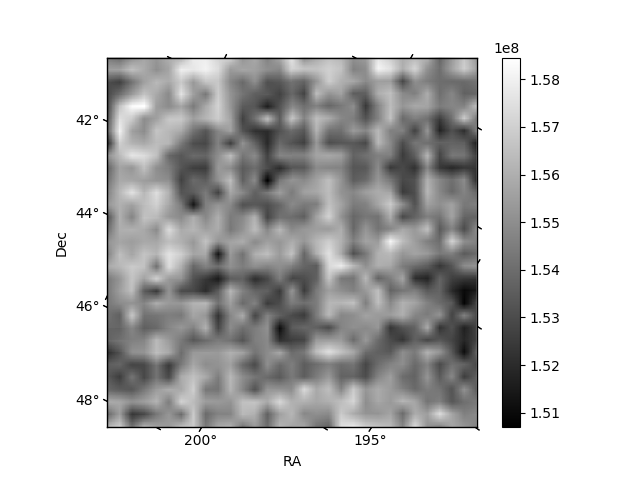
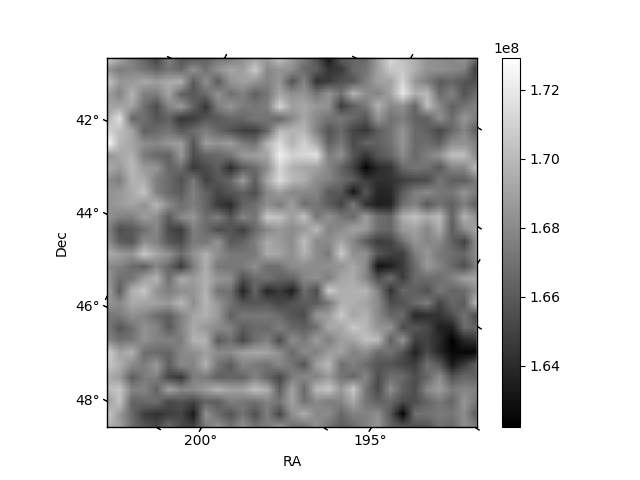
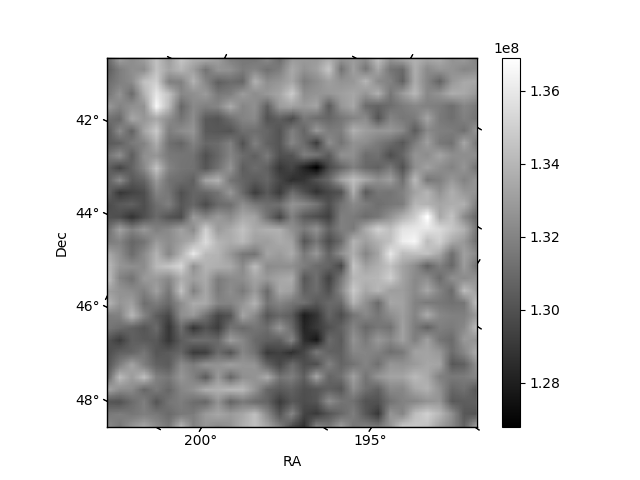
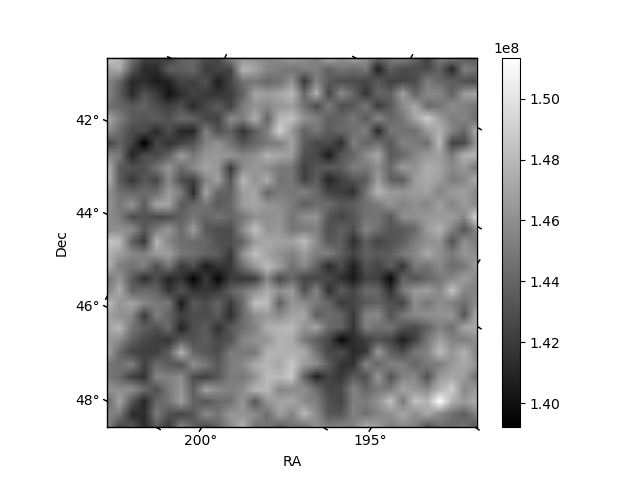
Histogram calculated using DETX and DETY for each event in the final _common_clean file
| Quadrant A | 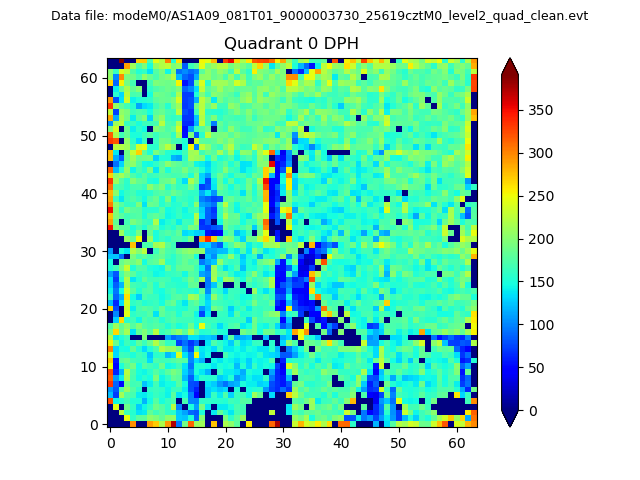 |
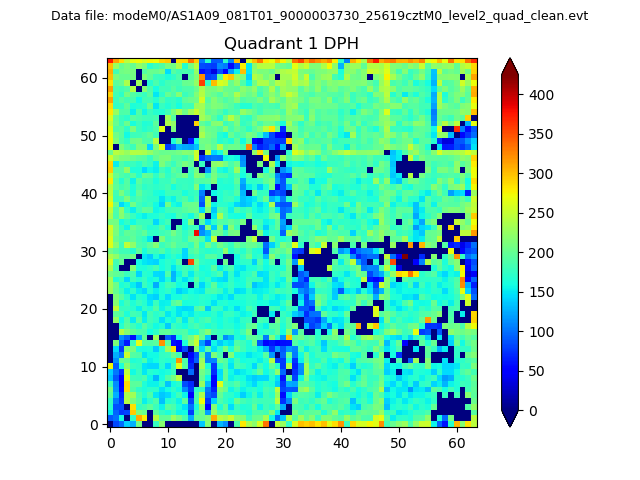 |
Quadrant B |
|---|---|---|---|
| Quadrant D | 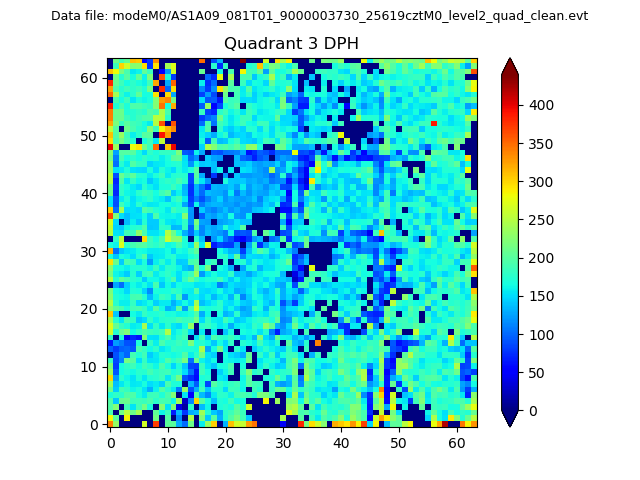 |
 |
Quadrant C |
| Plot type | Count rate plots | Images |
|---|---|---|
| Comparison with Poisson distribution Blue bars denote a histogram of data divided into 1 sec bins. Red curve is a Poisson curve with rate = median count rate of data. |
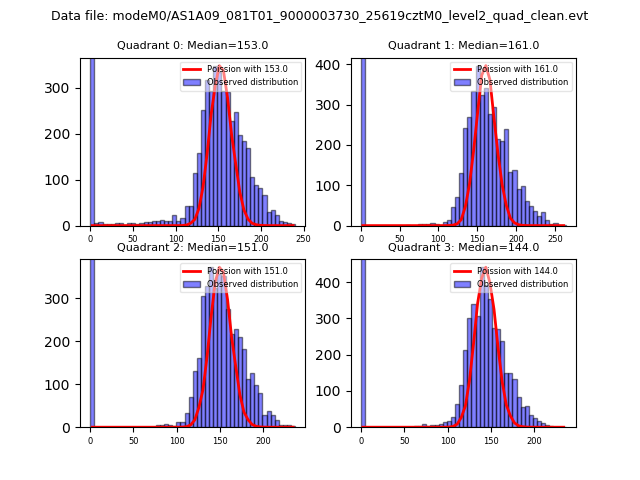 |
 |
| Quadrant-wise count rates Data is divided into 100 sec bins |
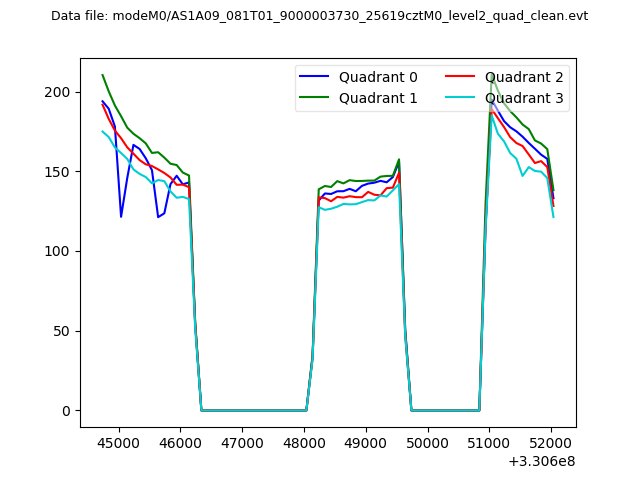 |
|
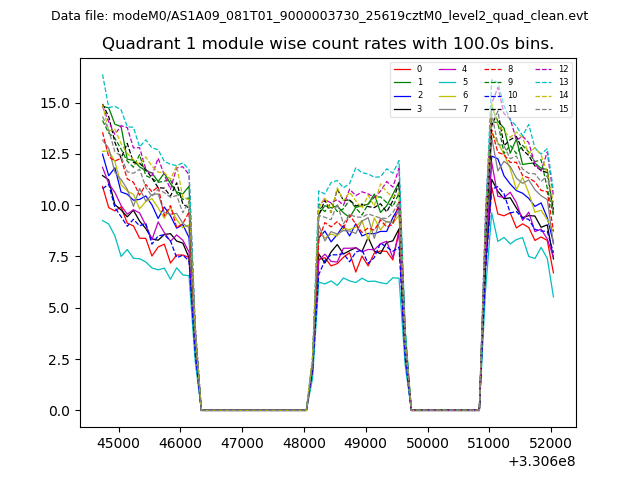
| Module-wise count rates for Quadrant A Data is divided into 100 sec bins |
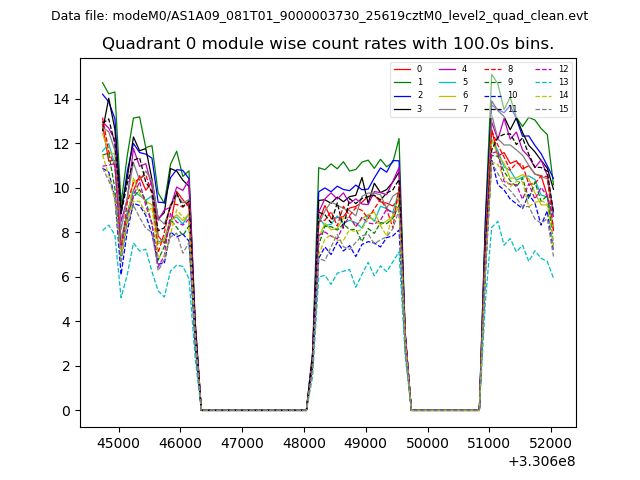 |
 |
| Module-wise count rates for Quadrant B Data is divided into 100 sec bins |
 |
 |
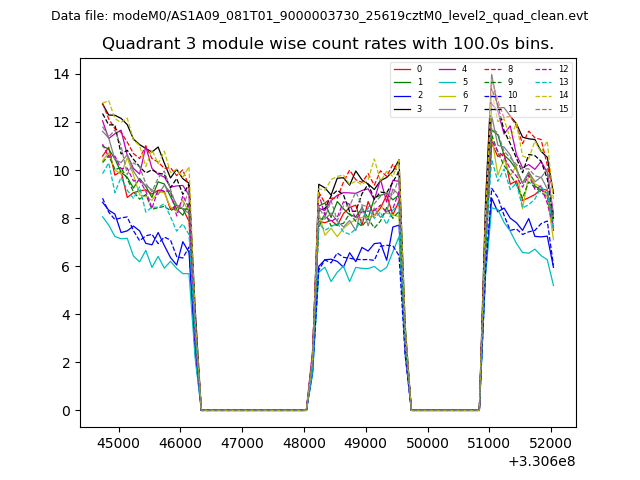
| Module-wise count rates for Quadrant C Data is divided into 100 sec bins |
 |
 |
| Module-wise count rates for Quadrant D Data is divided into 100 sec bins |
 |
 |
| Parameter | Plot |
|---|---|
| CZT HV Monitor |  |
| D_VDD | 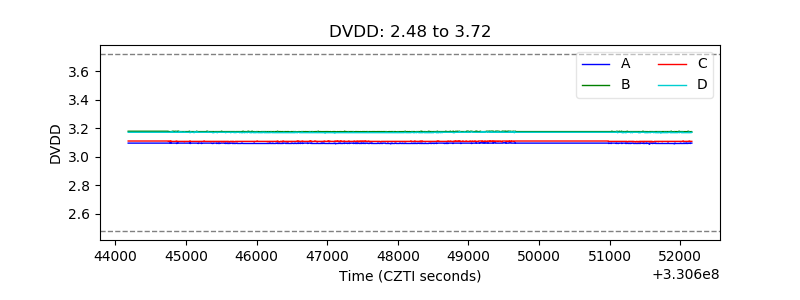 |
| Temperature 1 | 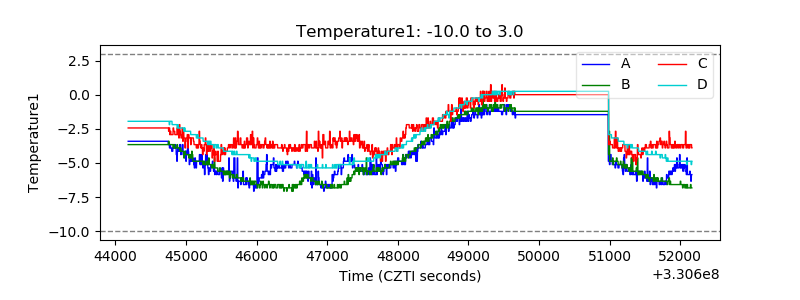 |
| Veto HV Monitor | 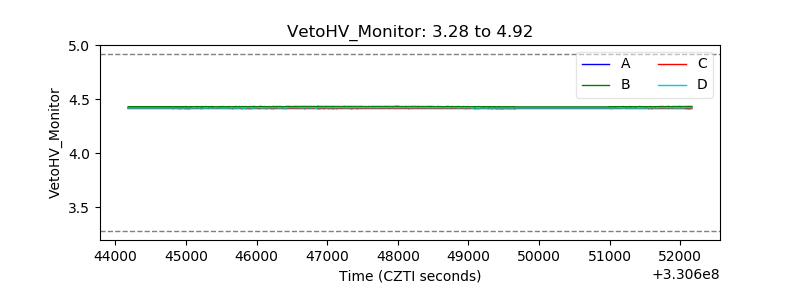 |
| Veto LLD | 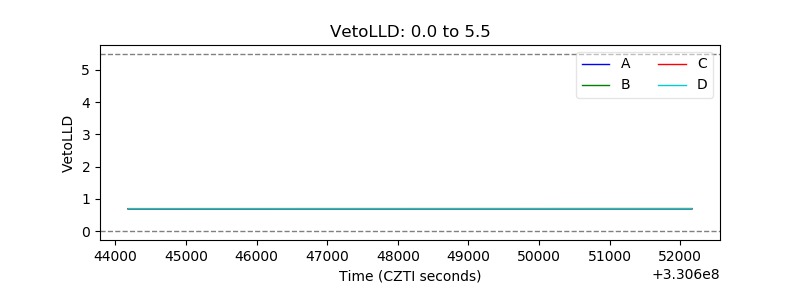 |
| Alpha Counter | 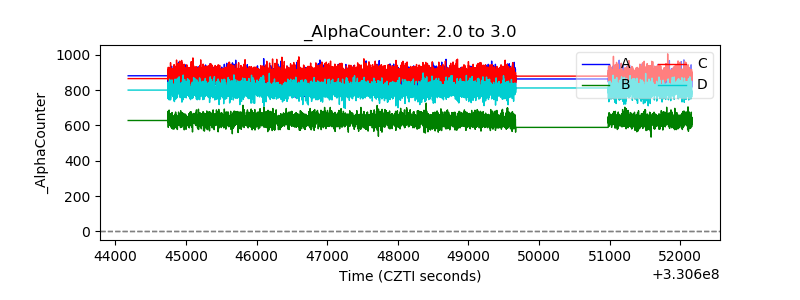 |
| _CPM_Rate | 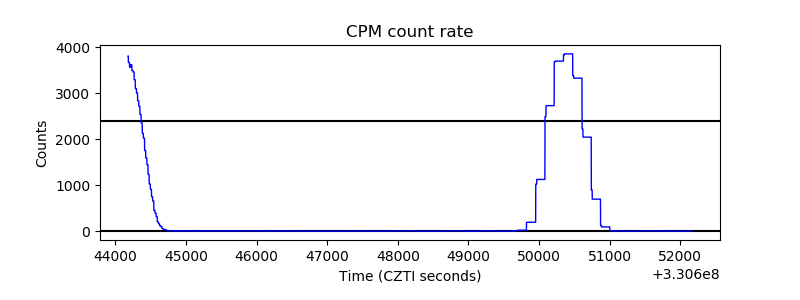 |
| CZT Counter | 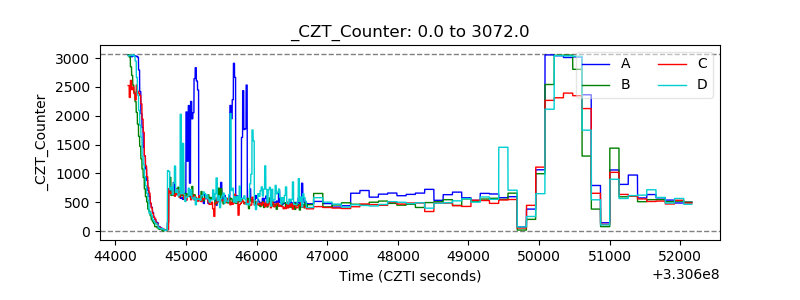 |
| +2.5 Volts monitor | 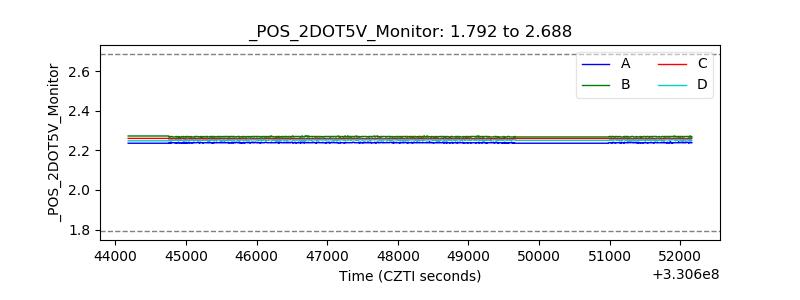 |
| +5 Volts monitor |  |
| _ROLL_ROT | 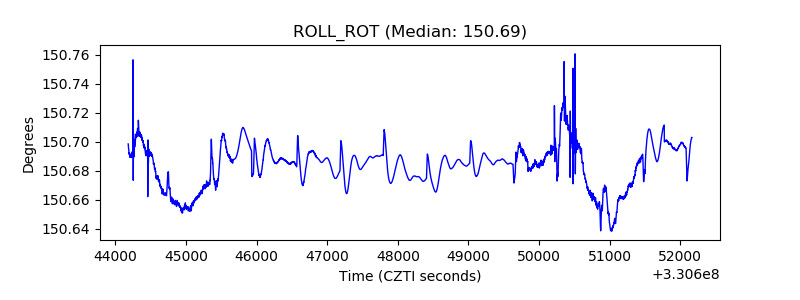 |
| _Roll_DEC | 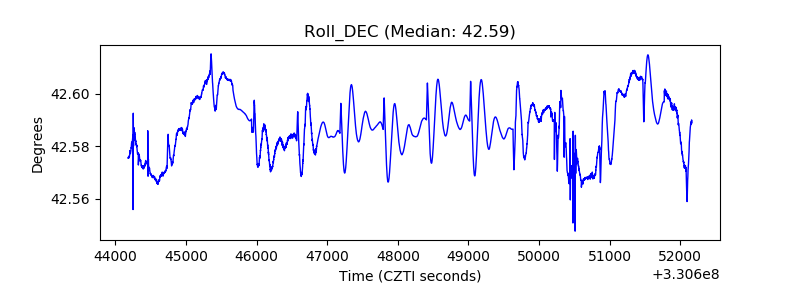 |
| _Roll_RA | 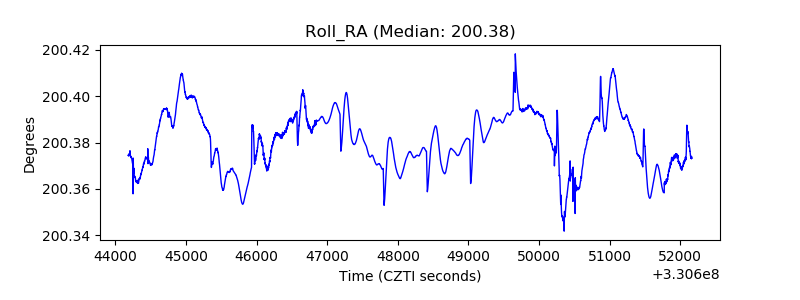 |
| Veto Counter | 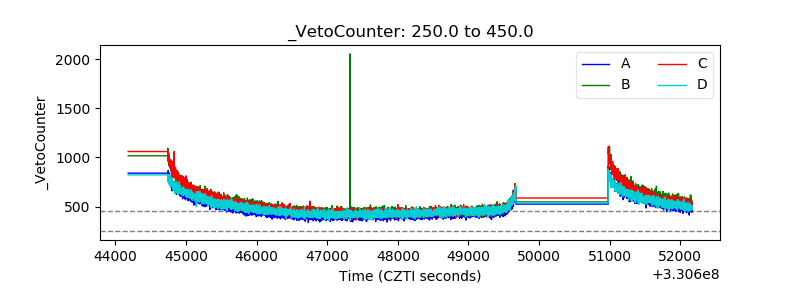 |