| Param | Original file | Final file |
|---|---|---|
| Filename | modeM0/AS1A09_081T01_9000003730_25620cztM0_level2.evt | modeM0/AS1A09_081T01_9000003730_25620cztM0_level2_quad_clean.evt |
| Size (bytes) | 244,368,000 | 38,004,480 |
| Size | 233.0 MB | 36.2 MB |
| Events in quadrant A | 1,910,217 | 231,593 |
| Events in quadrant B | 1,702,132 | 245,026 |
| Events in quadrant C | 1,682,337 | 224,353 |
| Events in quadrant D | 1,878,965 | 213,806 |
| Mode M9 | |||
|---|---|---|---|
| Quadrant | BADHDUFLAG | Total packets | Discarded packets |
| A | 0 | 4 | 0 |
| B | 0 | 5 | 0 |
| C | 0 | 5 | 0 |
| D | 0 | 5 | 0 |
| Mode M0 | |||
|---|---|---|---|
| Quadrant | BADHDUFLAG | Total packets | Discarded packets |
| A | 0 | 7683 | 0 |
| B | 0 | 7076 | 0 |
| C | 0 | 7039 | 0 |
| D | 0 | 7771 | 0 |
| Quadrant | Total seconds | Saturated seconds | Saturation percentage |
|---|---|---|---|
| A | 3320 | 22 | 0.662651% |
| B | 3320 | 5 | 0.150602% |
| C | 3320 | 24 | 0.722892% |
| D | 3320 | 25 | 0.753012% |
Noise dominated data is calculated using 1-second bins in cleaned event files. If a bin has >2000 counts, and if more than 50% of those come from <1% of pixels, then it is considered to be noise-dominated and hence unusable.
| Quadrant | # 1 sec bins | Bins with >0 counts | Bins with >2000 counts | High rate bins dominated by noise | Noise dominated (total time) | Noise dominated (detector-on time) | Marked lightcurve |
|---|---|---|---|---|---|---|---|
| A | 3320 | 3320 | 4 | 4 | 0.12% | 0.12% | 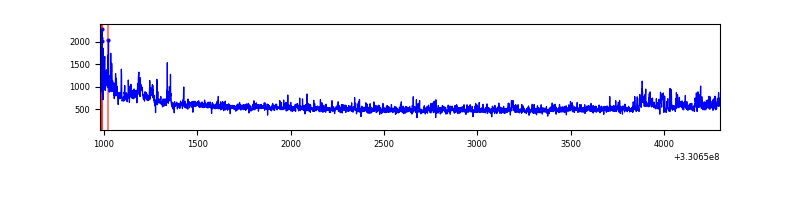 |
| B | 3320 | 3320 | 1 | 1 | 0.03% | 0.03% | 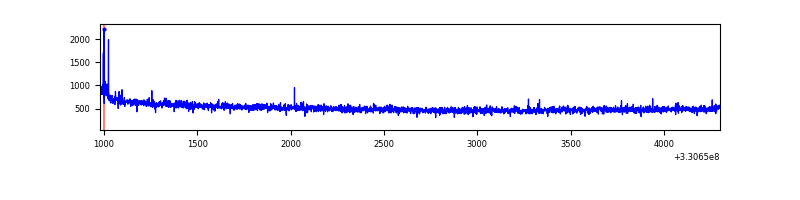 |
| C | 3320 | 3320 | 0 | 0 | 0.00% | 0.00% | 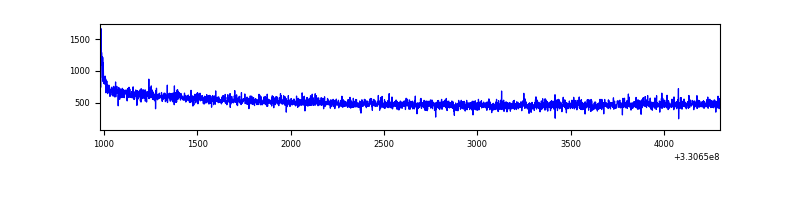 |
| D | 3320 | 3320 | 21 | 21 | 0.63% | 0.63% | 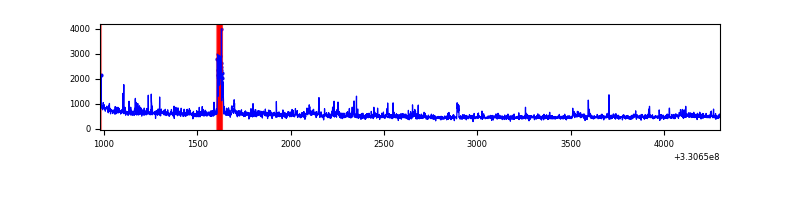 |
Top three noisy pixels from each quadrant. If the there are fewer than three noisy pixels in the level2.evt file, extra rows are filled as -1
| Pixel properties | Quadrant properties | ||||||
|---|---|---|---|---|---|---|---|
| Quadrant | DetID | PixID | Counts | Sigma | Mean | Median | Sigma |
| A | 0 | 13 | 181118 | 2107.18 | 425 | 418 | 85.8 |
| A | 8 | 192 | 71862 | 833.12 | 425 | 418 | 85.8 |
| A | 6 | 16 | 15379 | 174.46 | 425 | 418 | 85.8 |
| B | 12 | 111 | 9246 | 109.63 | 433 | 424 | 80.5 |
| B | 11 | 111 | 8232 | 97.03 | 433 | 424 | 80.5 |
| B | 14 | 111 | 7588 | 89.03 | 433 | 424 | 80.5 |
| C | 14 | 238 | 68800 | 718.89 | 410 | 413 | 95.1 |
| C | 0 | 10 | 6429 | 63.24 | 410 | 413 | 95.1 |
| C | 3 | 233 | 5813 | 56.77 | 410 | 413 | 95.1 |
| D | 8 | 195 | 158198 | 1584.01 | 405 | 394 | 99.6 |
| D | 1 | 52 | 71000 | 708.73 | 405 | 394 | 99.6 |
| D | 7 | 238 | 61742 | 615.8 | 405 | 394 | 99.6 |
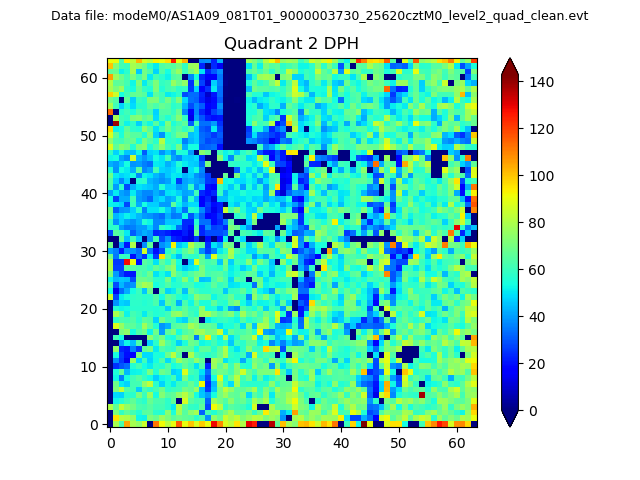
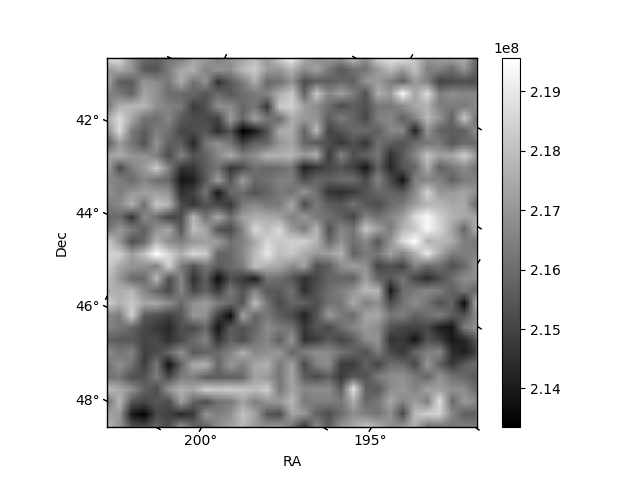
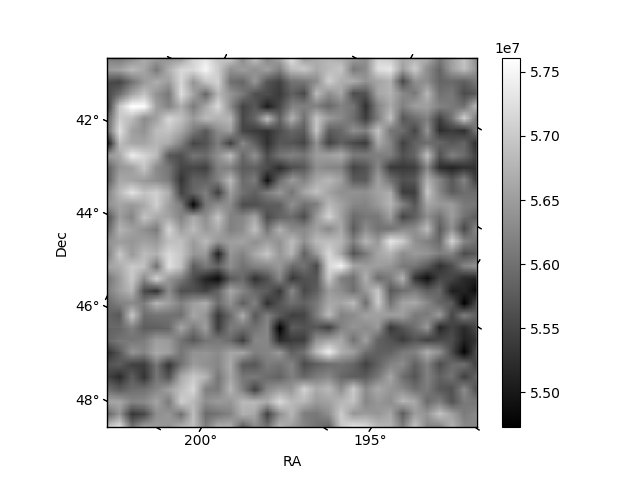
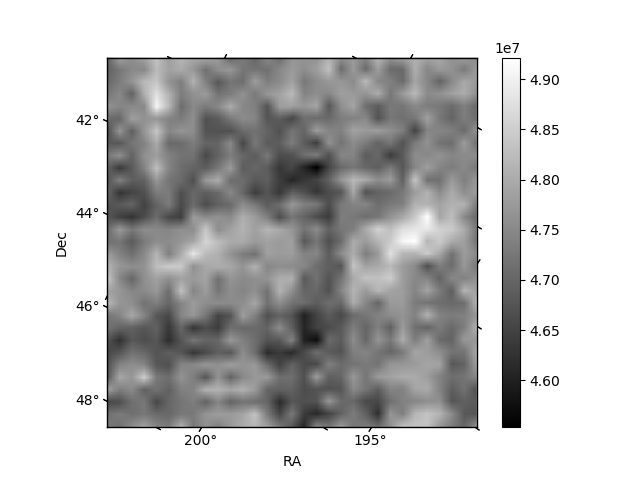
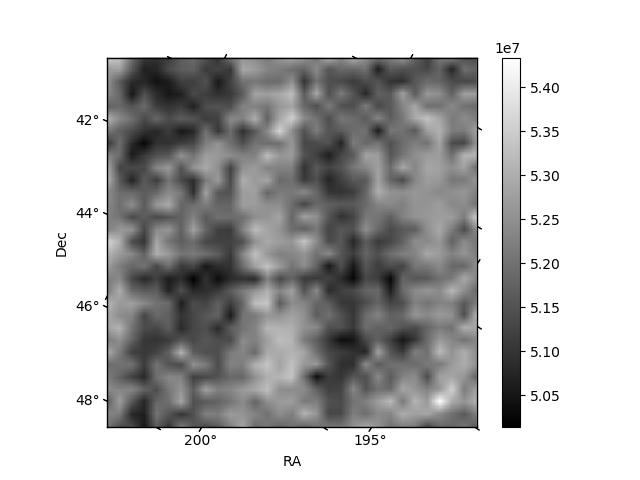
Histogram calculated using DETX and DETY for each event in the final _common_clean file
| Quadrant A | 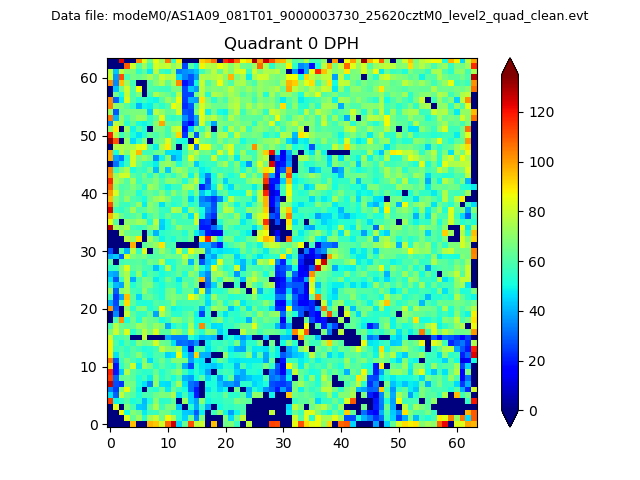 |
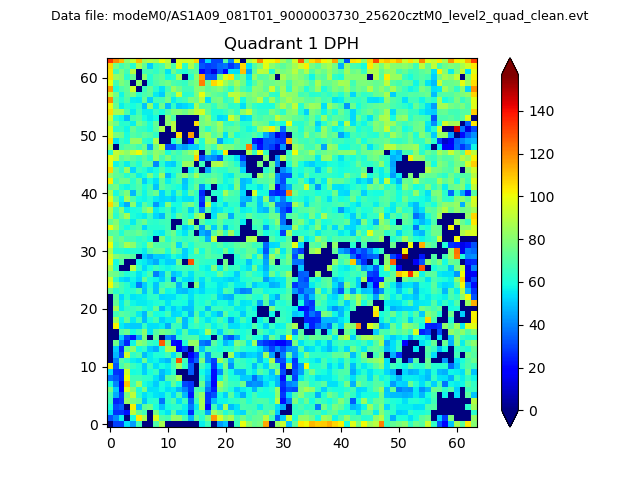 |
Quadrant B |
|---|---|---|---|
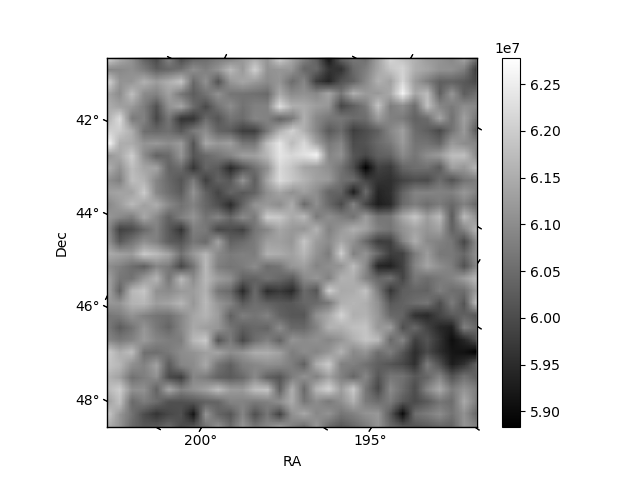
| Quadrant D | 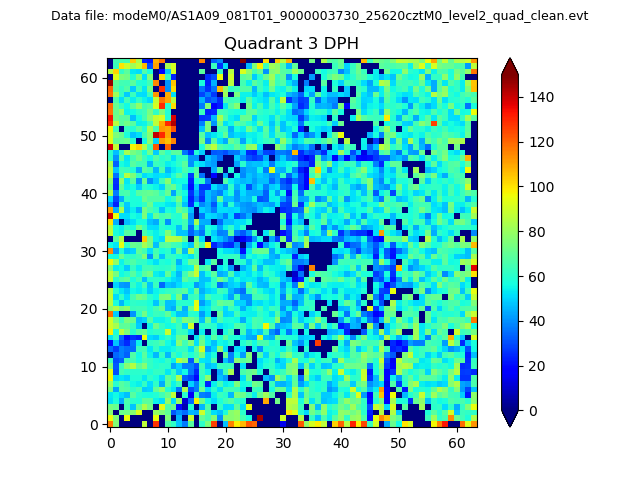 |
 |
Quadrant C |
| Plot type | Count rate plots | Images |
|---|---|---|
| Comparison with Poisson distribution Blue bars denote a histogram of data divided into 1 sec bins. Red curve is a Poisson curve with rate = median count rate of data. |
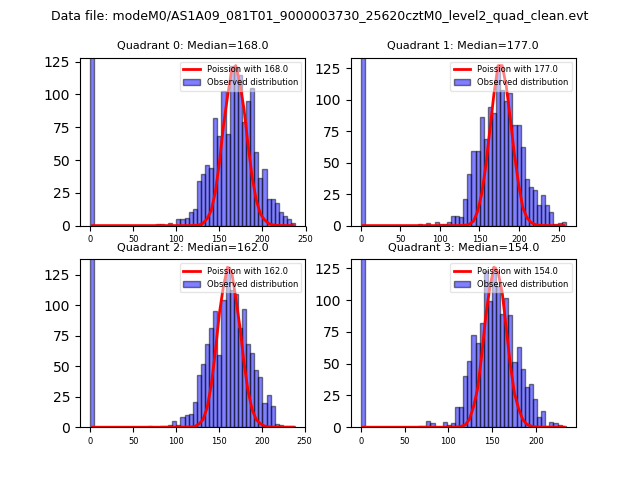 |
 |
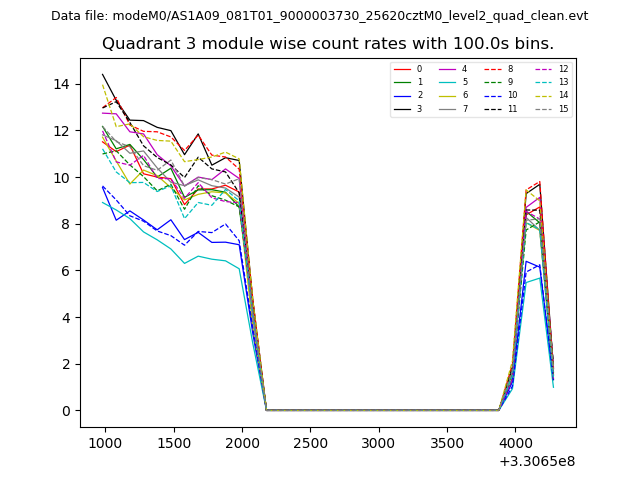
| Quadrant-wise count rates Data is divided into 100 sec bins |
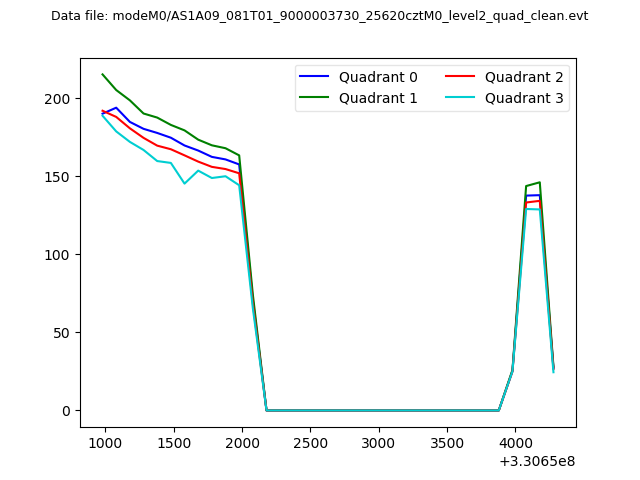 |
|
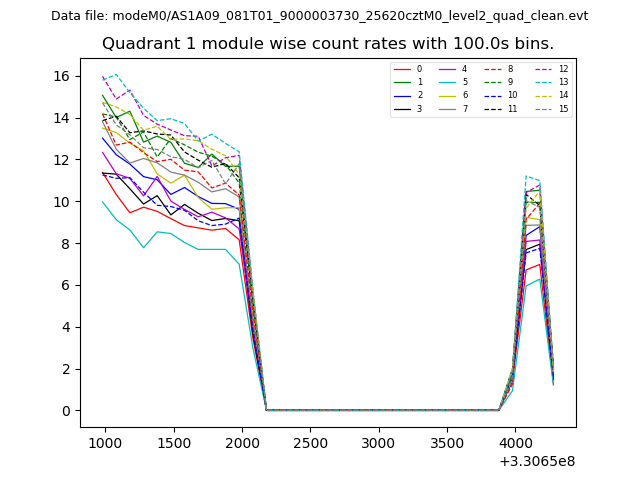
| Module-wise count rates for Quadrant A Data is divided into 100 sec bins |
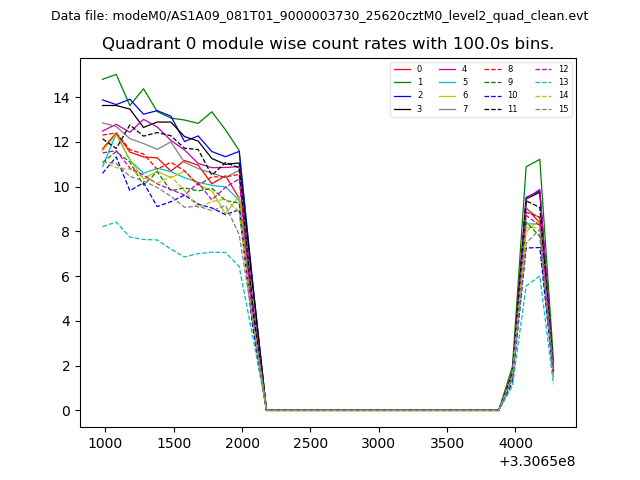 |
 |
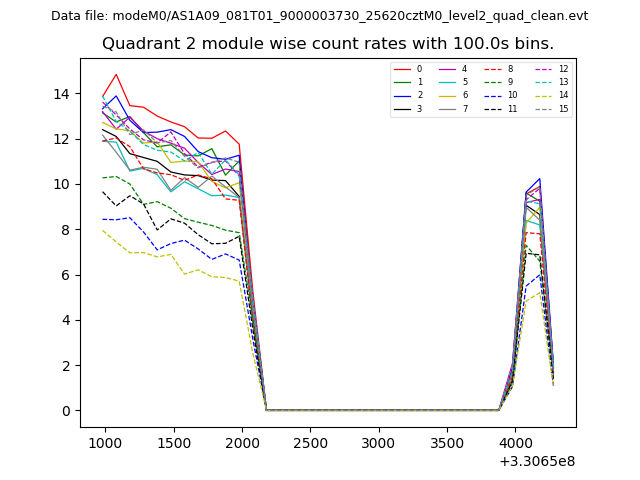
| Module-wise count rates for Quadrant B Data is divided into 100 sec bins |
 |
 |
| Module-wise count rates for Quadrant C Data is divided into 100 sec bins |
 |
 |
| Module-wise count rates for Quadrant D Data is divided into 100 sec bins |
 |
 |
| Parameter | Plot |
|---|---|
| CZT HV Monitor | 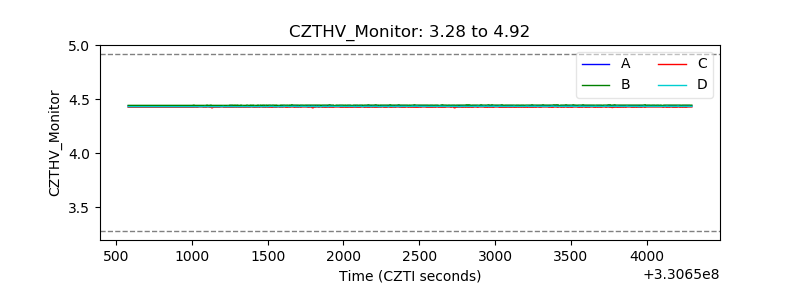 |
| D_VDD | 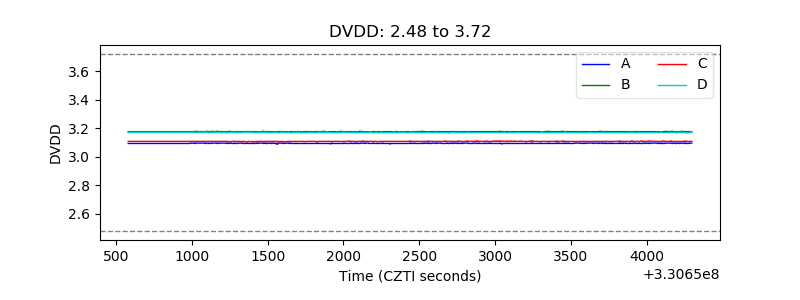 |
| Temperature 1 | 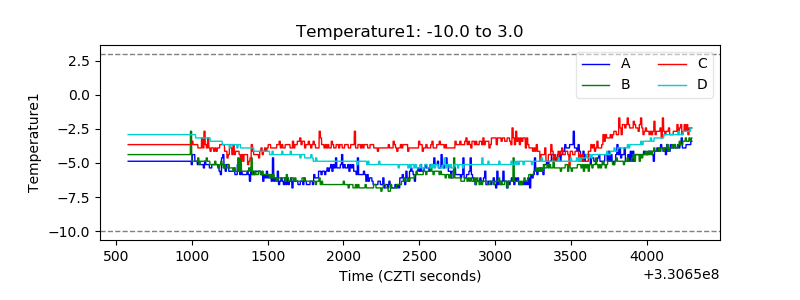 |
| Veto HV Monitor | 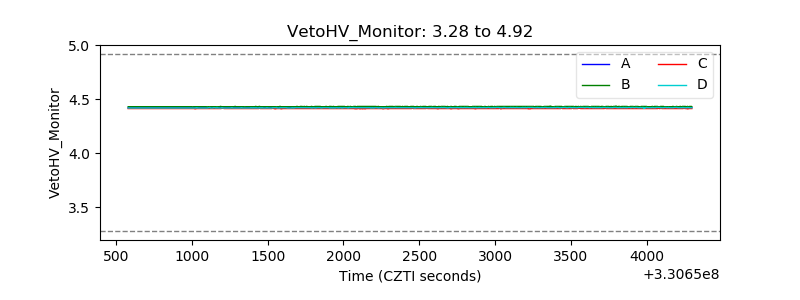 |
| Veto LLD | 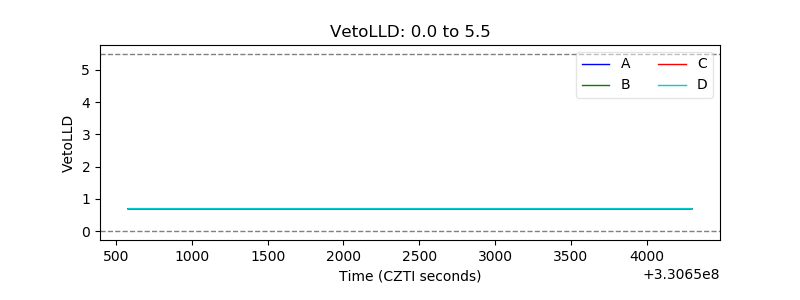 |
| Alpha Counter | 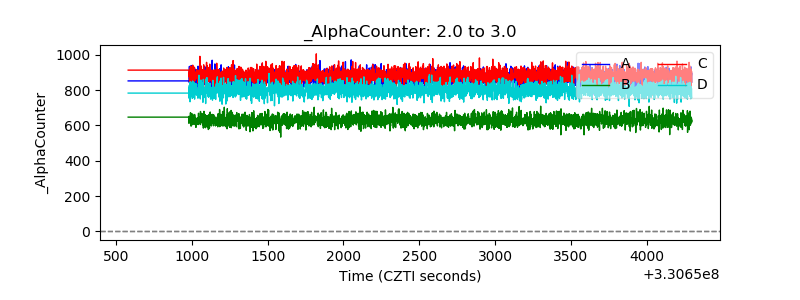 |
| _CPM_Rate | 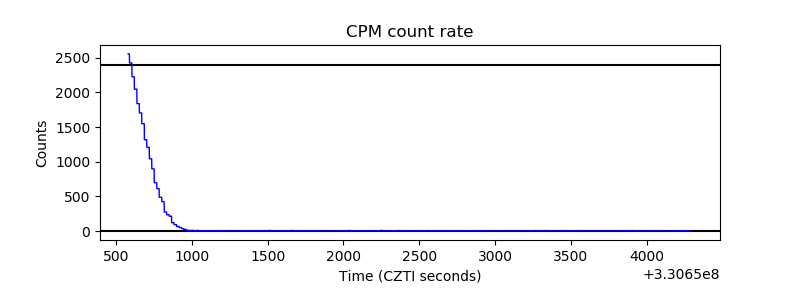 |
| CZT Counter | 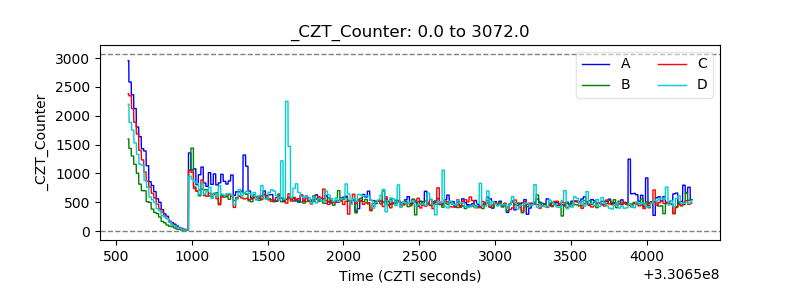 |
| +2.5 Volts monitor | 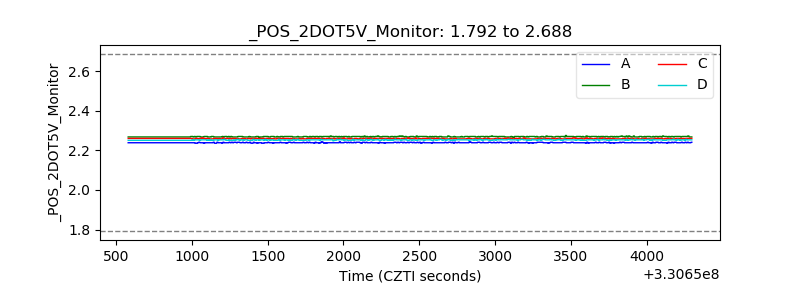 |
| +5 Volts monitor | 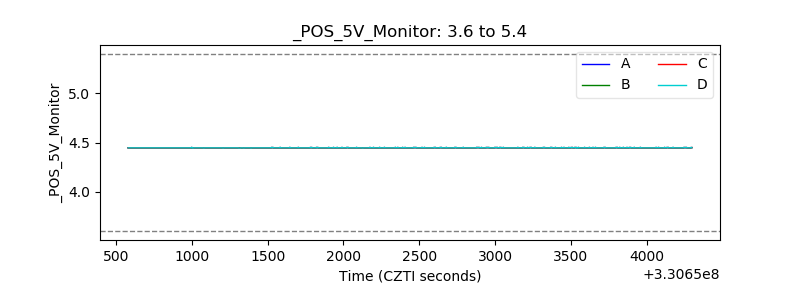 |
| _ROLL_ROT | 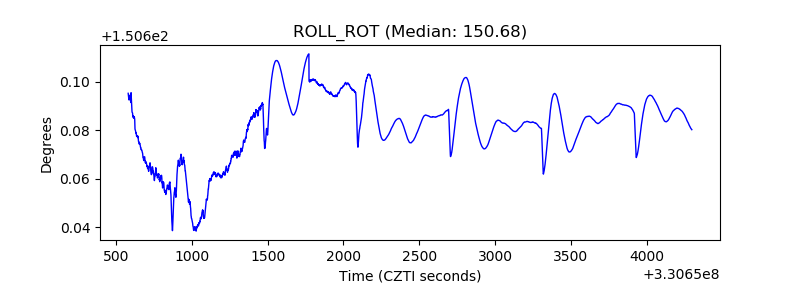 |
| _Roll_DEC | 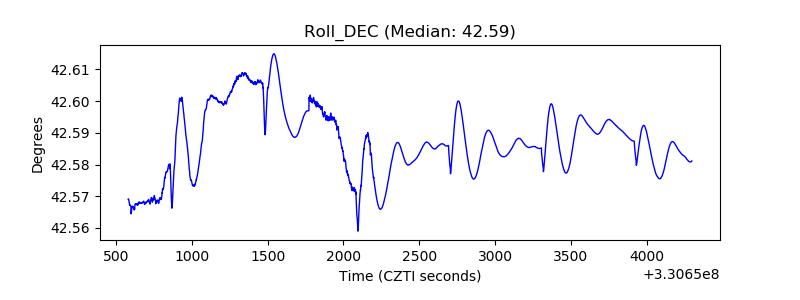 |
| _Roll_RA | 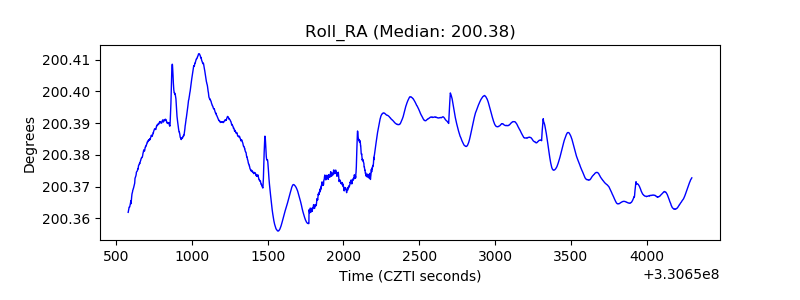 |
| Veto Counter | 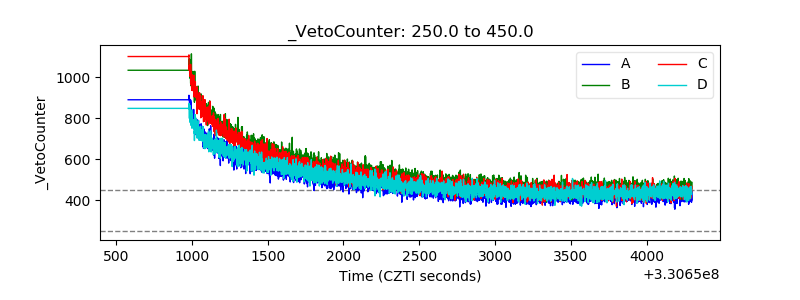 |