| Param | Original file | Final file |
|---|---|---|
| Filename | modeM0/AS1A07_127T03_9000003732cztM0_level2.fits | modeM0/AS1A07_127T03_9000003732cztM0_level2_quad_clean.evt |
| Size (bytes) | 650,053,440 | 490,728,960 |
| Size | 619.9 MB | 468.0 MB |
| Events in quadrant A | 3,320,180 | 2,809,635 |
| Events in quadrant B | 3,200,687 | 2,838,697 |
| Events in quadrant C | 6,654,102 | 3,124,790 |
| Events in quadrant D | 2,761,118 | 2,337,493 |
| Mode M9 | |||
|---|---|---|---|
| Quadrant | BADHDUFLAG | Total packets | Discarded packets |
| A | 0 | 86 | 0 |
| B | 0 | 84 | 0 |
| C | 0 | 83 | 0 |
| D | 0 | 85 | 0 |
| Mode M0 | |||
|---|---|---|---|
| Quadrant | BADHDUFLAG | Total packets | Discarded packets |
| A | 0 | 122347 | 0 |
| B | 0 | 114774 | 0 |
| C | 0 | 113986 | 0 |
| D | 0 | 178642 | 0 |
| Mode SS | |||
|---|---|---|---|
| Quadrant | BADHDUFLAG | Total packets | Discarded packets |
| A | 0 | 1114 | 0 |
| B | 0 | 1116 | 0 |
| C | 0 | 1120 | 0 |
| D | 0 | 1112 | 0 |
| Quadrant | Total seconds | Saturated seconds | Saturation percentage |
|---|---|---|---|
| A | 54677 | 1039 | 1.900251% |
| B | 54674 | 1019 | 1.863774% |
| C | 54724 | 1089 | 1.989986% |
| D | 54561 | 4223 | 7.739961% |
Noise dominated data is calculated using 1-second bins in cleaned event files. If a bin has >2000 counts, and if more than 50% of those come from <1% of pixels, then it is considered to be noise-dominated and hence unusable.
| Quadrant | # 1 sec bins | Bins with >0 counts | Bins with >2000 counts | High rate bins dominated by noise | Noise dominated (total time) | Noise dominated (detector-on time) | Marked lightcurve |
|---|---|---|---|---|---|---|---|
| A | 65740 | 54940 | 0 | 0 | 0.00% | 0.00% |  |
| B | 65740 | 54940 | 0 | 0 | 0.00% | 0.00% | 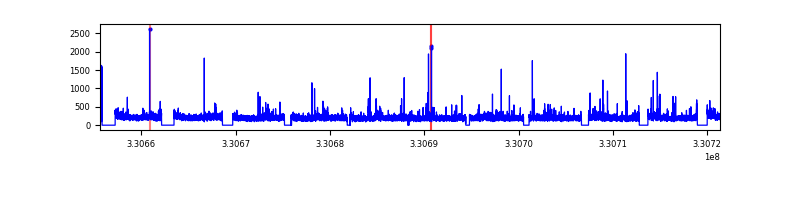 |
| C | 65740 | 55006 | 0 | 0 | 0.00% | 0.00% |  |
| D | 65740 | 54777 | 0 | 0 | 0.00% | 0.00% |  |
Top three noisy pixels from each quadrant. If the there are fewer than three noisy pixels in the level2.evt file, extra rows are filled as -1
| Pixel properties | Quadrant properties | ||||||
|---|---|---|---|---|---|---|---|
| Quadrant | DetID | PixID | Counts | Sigma | Mean | Median | Sigma |
| A | 0 | 29 | 2768 | 9.18 | 864 | 806 | 213.7 |
| A | 7 | 110 | 2656 | 8.66 | 864 | 806 | 213.7 |
| A | 9 | 19 | 2494 | 7.9 | 864 | 806 | 213.7 |
| B | 2 | 9 | 2541 | 10.31 | 845 | 804 | 168.5 |
| B | 3 | 80 | 2123 | 7.83 | 845 | 804 | 168.5 |
| B | 2 | 8 | 2117 | 7.79 | 845 | 804 | 168.5 |
| C | 9 | 209 | 4222 | 6.59 | 1775 | 1757 | 374.2 |
| C | 3 | 187 | 3725 | 5.26 | 1775 | 1757 | 374.2 |
| C | -1 | -1 | -1 | -1.0 | 1775 | 1757 | 374.2 |
| D | 3 | 14 | 2034 | 6.27 | 787 | 718 | 209.9 |
| D | 15 | 46 | 1964 | 5.93 | 787 | 718 | 209.9 |
| D | 13 | 238 | 1957 | 5.9 | 787 | 718 | 209.9 |
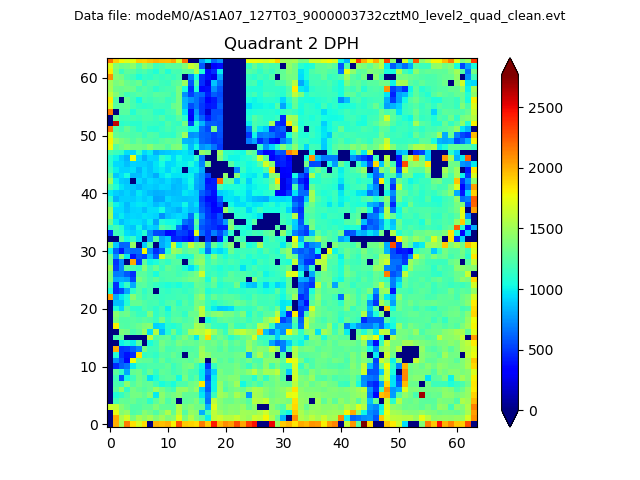
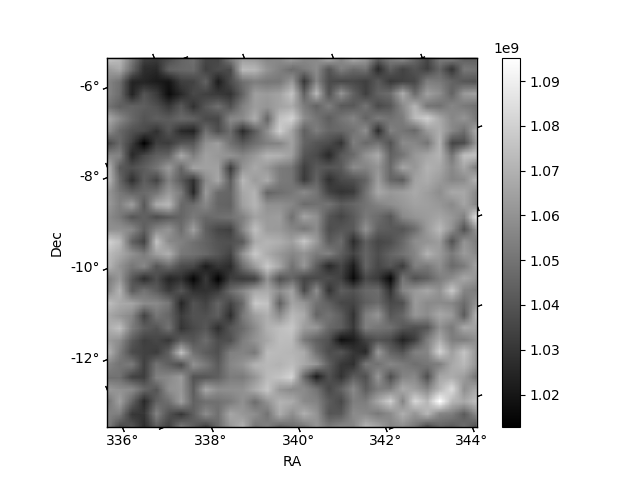
Histogram calculated using DETX and DETY for each event in the final _common_clean file
| Quadrant A |  |
 |
Quadrant B |
|---|---|---|---|
| Quadrant D | 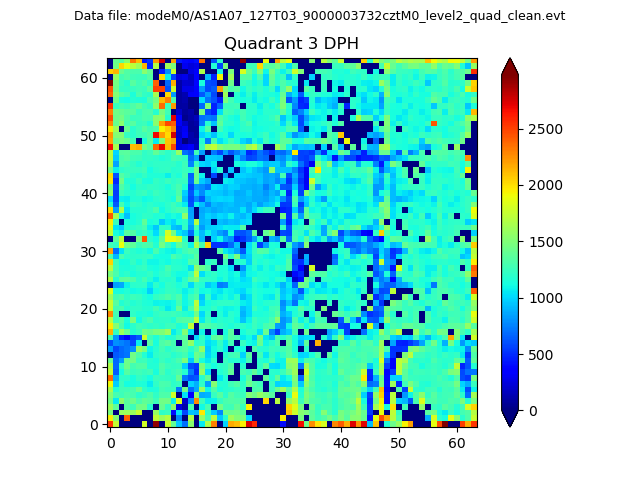 |
 |
Quadrant C |
| Plot type | Count rate plots | Images |
|---|---|---|
| Comparison with Poisson distribution Blue bars denote a histogram of data divided into 1 sec bins. Red curve is a Poisson curve with rate = median count rate of data. |
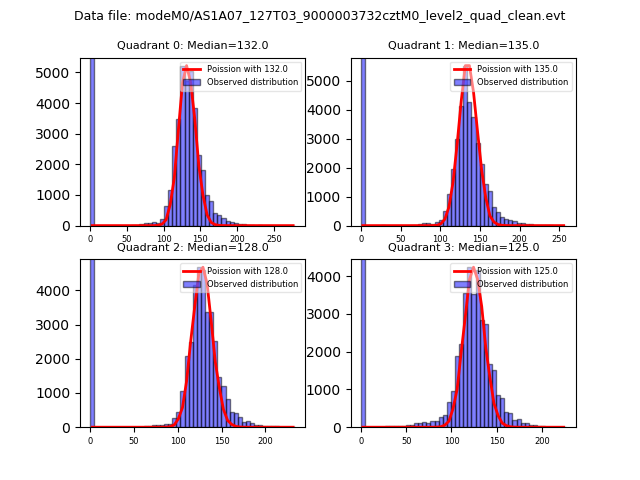 |
 |
| Quadrant-wise count rates Data is divided into 100 sec bins |
 |
|
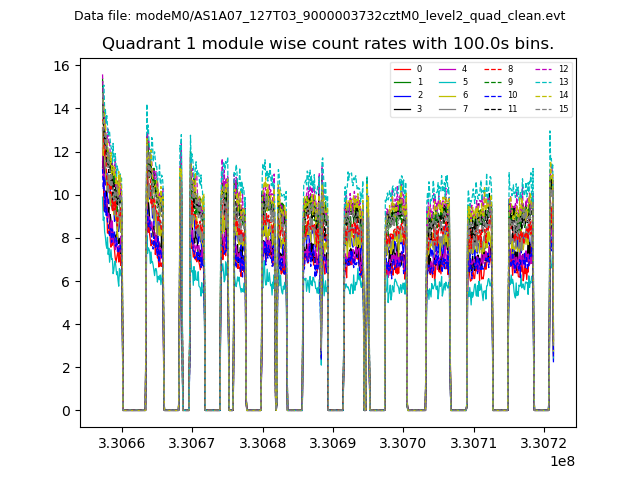
| Module-wise count rates for Quadrant A Data is divided into 100 sec bins |
 |
 |
| Module-wise count rates for Quadrant B Data is divided into 100 sec bins |
 |
 |
| Module-wise count rates for Quadrant C Data is divided into 100 sec bins |
 |
 |
| Module-wise count rates for Quadrant D Data is divided into 100 sec bins |
 |
 |
| Parameter | Plot |
|---|---|
| CZT HV Monitor |  |
| D_VDD | 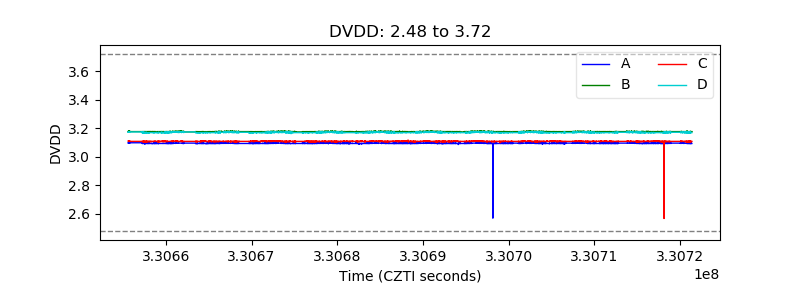 |
| Temperature 1 | 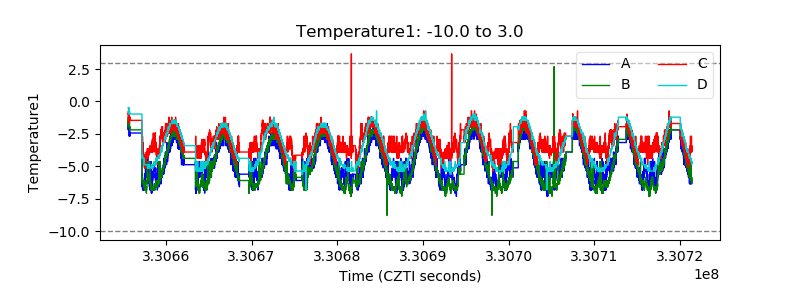 |
| Veto HV Monitor |  |
| Veto LLD |  |
| Alpha Counter |  |
| _CPM_Rate |  |
| CZT Counter |  |
| +2.5 Volts monitor |  |
| +5 Volts monitor |  |
| _ROLL_ROT |  |
| _Roll_DEC | 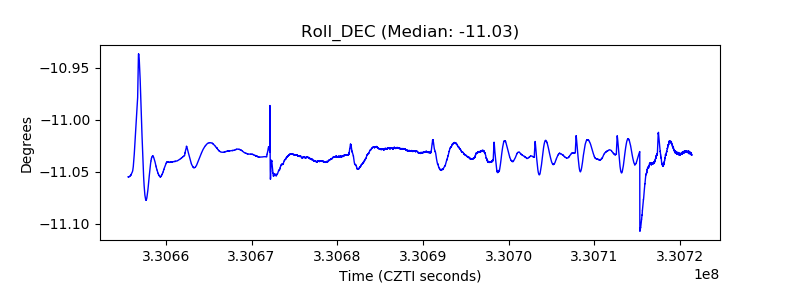 |
| _Roll_RA |  |
| Veto Counter |  |