| Param | Original file | Final file |
|---|---|---|
| Filename | modeM0/AS1A07_127T03_9000003732_25620cztM0_level2.evt | modeM0/AS1A07_127T03_9000003732_25620cztM0_level2_quad_clean.evt |
| Size (bytes) | 133,761,600 | 32,938,560 |
| Size | 127.6 MB | 31.4 MB |
| Events in quadrant A | 941,105 | 223,664 |
| Events in quadrant B | 1,003,106 | 232,858 |
| Events in quadrant C | 908,984 | 217,630 |
| Events in quadrant D | 1,092,198 | 210,587 |
| Mode M9 | |||
|---|---|---|---|
| Quadrant | BADHDUFLAG | Total packets | Discarded packets |
| A | 0 | 14 | 0 |
| B | 0 | 14 | 0 |
| C | 0 | 14 | 0 |
| D | 0 | 14 | 0 |
| Mode M0 | |||
|---|---|---|---|
| Quadrant | BADHDUFLAG | Total packets | Discarded packets |
| A | 0 | 3784 | 0 |
| B | 0 | 3956 | 0 |
| C | 0 | 3719 | 0 |
| D | 0 | 4298 | 0 |
| Quadrant | Total seconds | Saturated seconds | Saturation percentage |
|---|---|---|---|
| A | 1520 | 13 | 0.855263% |
| B | 1520 | 88 | 5.789474% |
| C | 1520 | 35 | 2.302632% |
| D | 1520 | 21 | 1.381579% |
Noise dominated data is calculated using 1-second bins in cleaned event files. If a bin has >2000 counts, and if more than 50% of those come from <1% of pixels, then it is considered to be noise-dominated and hence unusable.
| Quadrant | # 1 sec bins | Bins with >0 counts | Bins with >2000 counts | High rate bins dominated by noise | Noise dominated (total time) | Noise dominated (detector-on time) | Marked lightcurve |
|---|---|---|---|---|---|---|---|
| A | 2910 | 1521 | 0 | 0 | 0.00% | 0.00% | 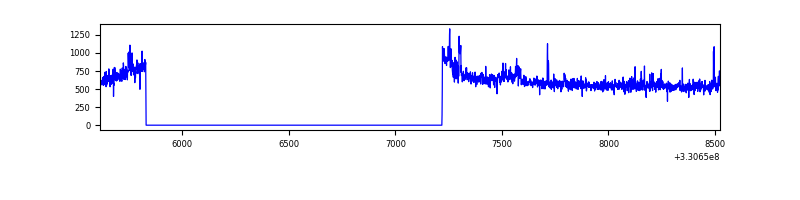 |
| B | 2910 | 1521 | 38 | 38 | 1.31% | 2.50% | 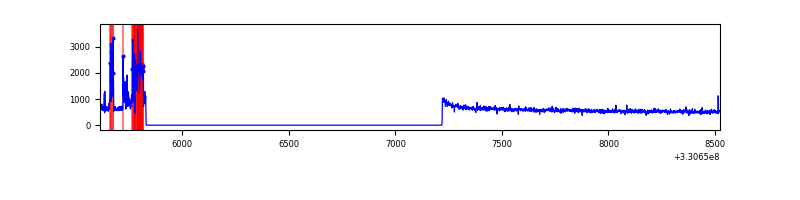 |
| C | 2910 | 1521 | 0 | 0 | 0.00% | 0.00% | 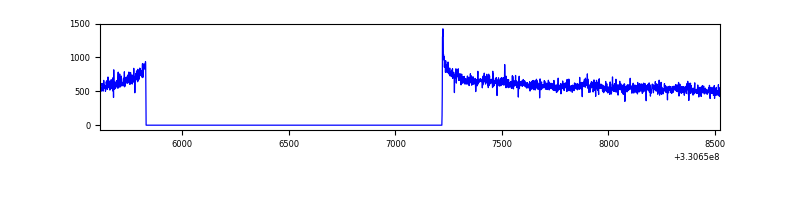 |
| D | 2910 | 1521 | 10 | 10 | 0.34% | 0.66% | 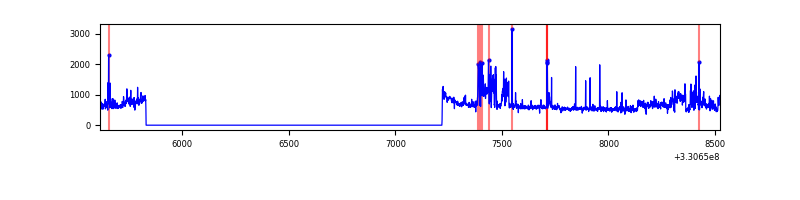 |
Top three noisy pixels from each quadrant. If the there are fewer than three noisy pixels in the level2.evt file, extra rows are filled as -1
| Pixel properties | Quadrant properties | ||||||
|---|---|---|---|---|---|---|---|
| Quadrant | DetID | PixID | Counts | Sigma | Mean | Median | Sigma |
| A | 8 | 192 | 35853 | 765.92 | 225 | 221 | 46.5 |
| A | 0 | 13 | 16276 | 345.11 | 225 | 221 | 46.5 |
| A | 6 | 16 | 14386 | 304.48 | 225 | 221 | 46.5 |
| B | 5 | 172 | 131862 | 3084.54 | 221 | 216 | 42.7 |
| B | 12 | 111 | 4719 | 105.51 | 221 | 216 | 42.7 |
| B | 11 | 111 | 4245 | 94.4 | 221 | 216 | 42.7 |
| C | 14 | 238 | 35056 | 656.15 | 221 | 222 | 53.1 |
| C | 3 | 233 | 10958 | 202.23 | 221 | 222 | 53.1 |
| C | 0 | 10 | 2266 | 38.5 | 221 | 222 | 53.1 |
| D | 1 | 52 | 204085 | 3739.2 | 220 | 214 | 54.5 |
| D | 8 | 195 | 50848 | 928.67 | 220 | 214 | 54.5 |
| D | 2 | 234 | 5157 | 90.65 | 220 | 214 | 54.5 |
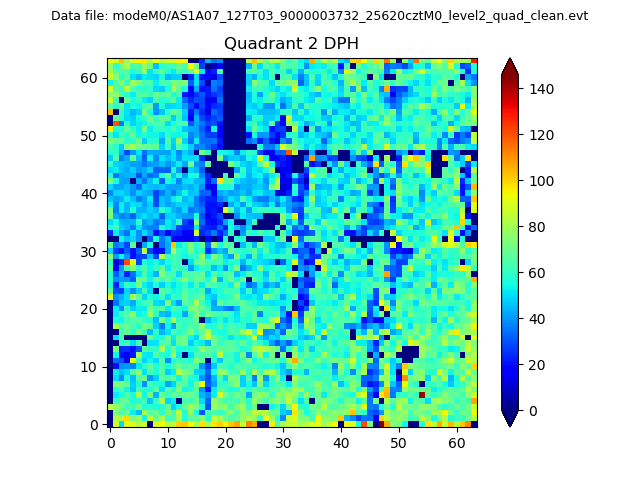
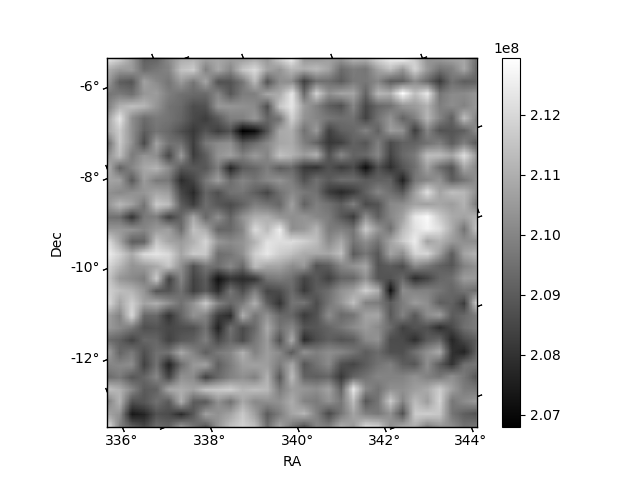
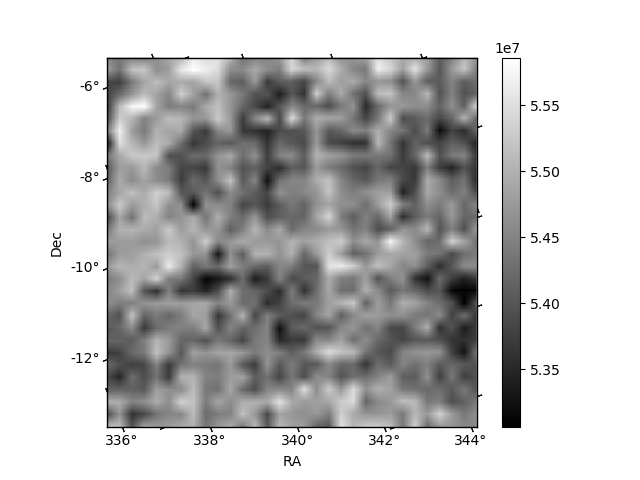
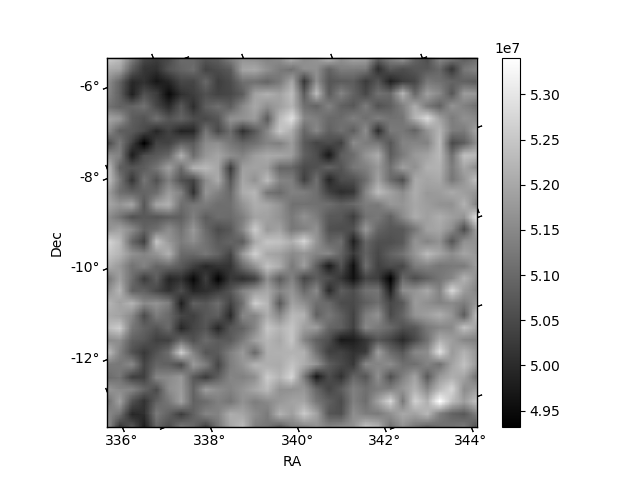
Histogram calculated using DETX and DETY for each event in the final _common_clean file
| Quadrant A | 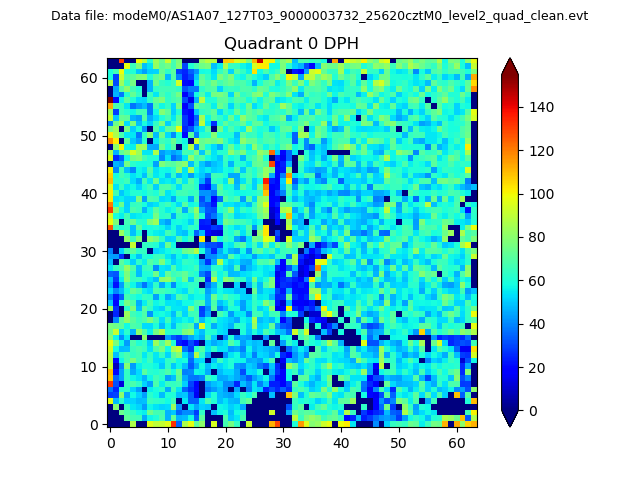 |
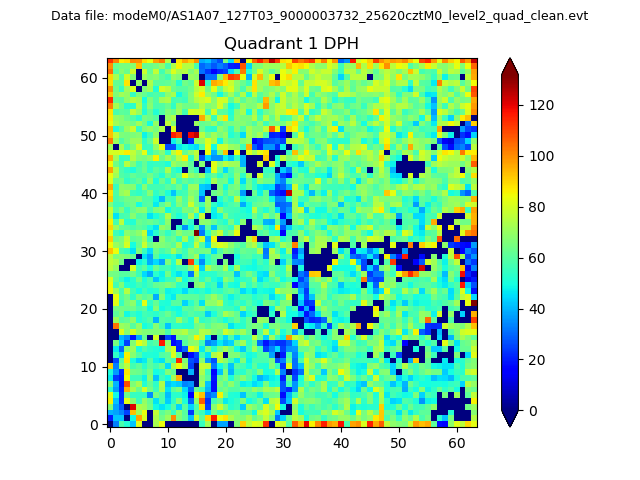 |
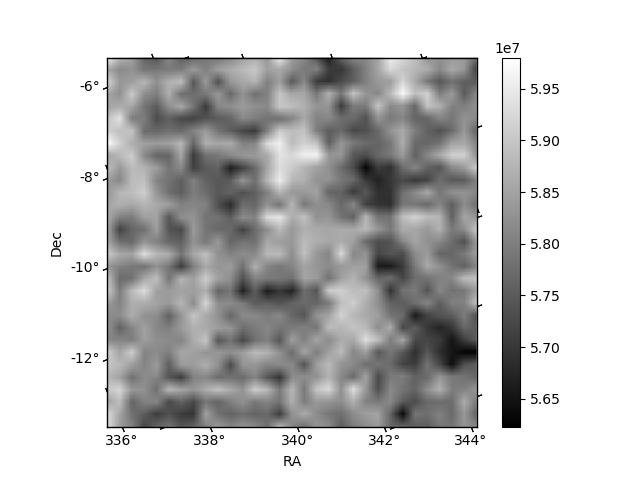
Quadrant B |
|---|---|---|---|
| Quadrant D | 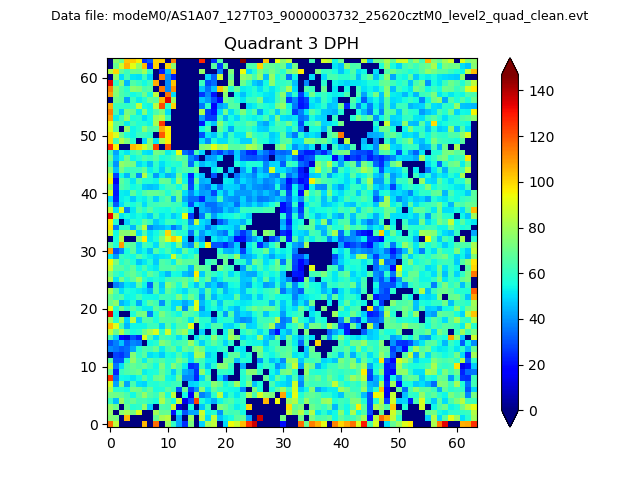 |
 |
Quadrant C |
| Plot type | Count rate plots | Images |
|---|---|---|
| Comparison with Poisson distribution Blue bars denote a histogram of data divided into 1 sec bins. Red curve is a Poisson curve with rate = median count rate of data. |
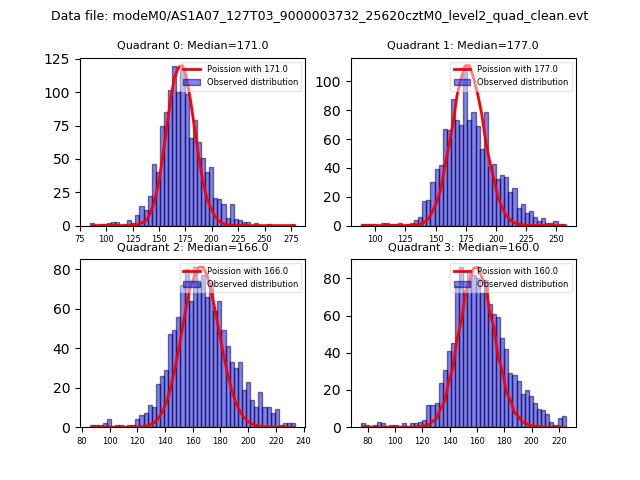 |
 |
| Quadrant-wise count rates Data is divided into 100 sec bins |
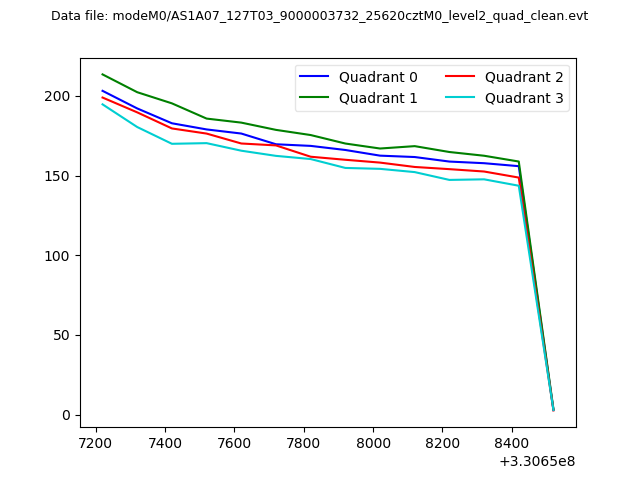 |
|
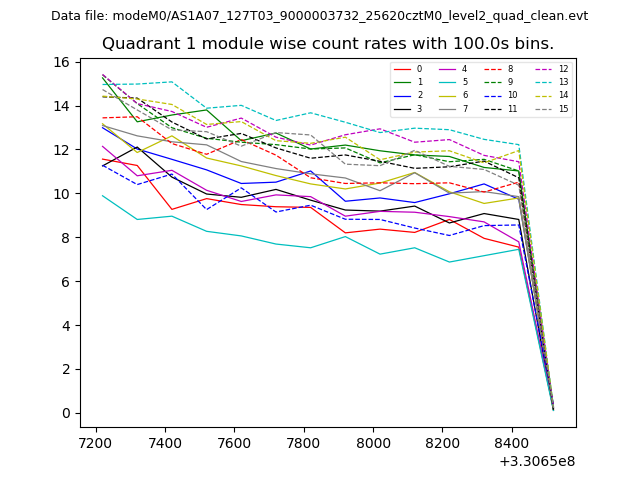
| Module-wise count rates for Quadrant A Data is divided into 100 sec bins |
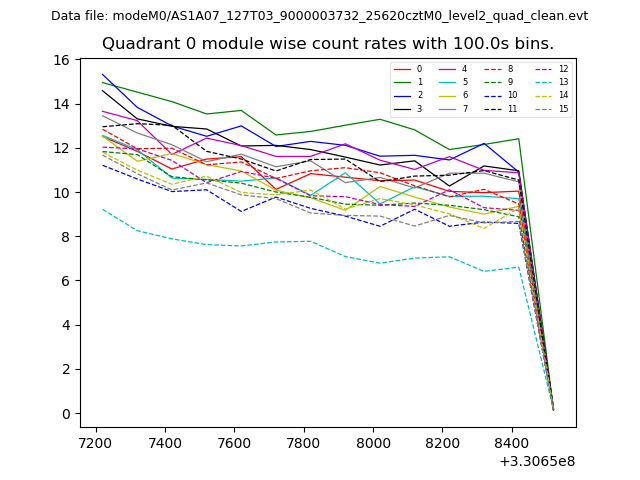 |
 |
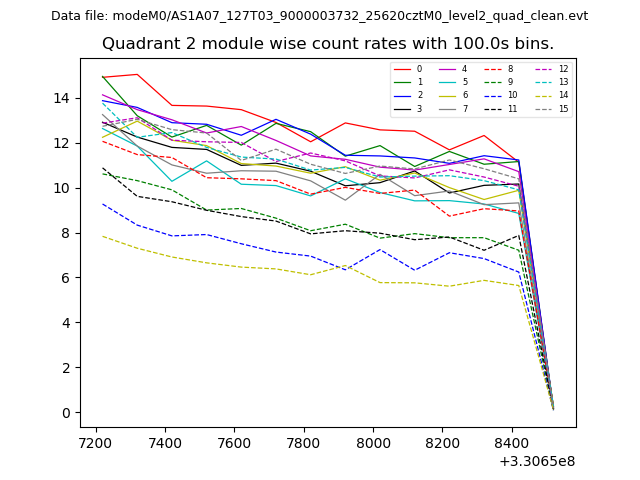
| Module-wise count rates for Quadrant B Data is divided into 100 sec bins |
 |
 |
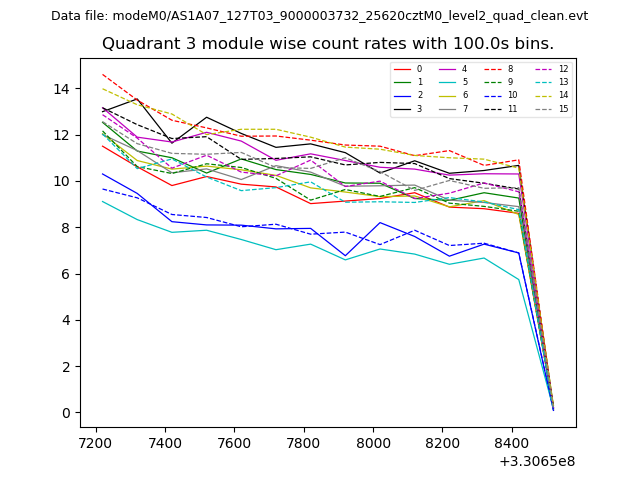
| Module-wise count rates for Quadrant C Data is divided into 100 sec bins |
 |
 |
| Module-wise count rates for Quadrant D Data is divided into 100 sec bins |
 |
 |
| Parameter | Plot |
|---|---|
| CZT HV Monitor | 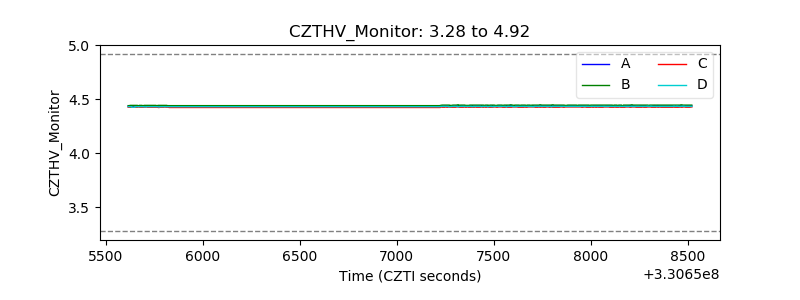 |
| D_VDD | 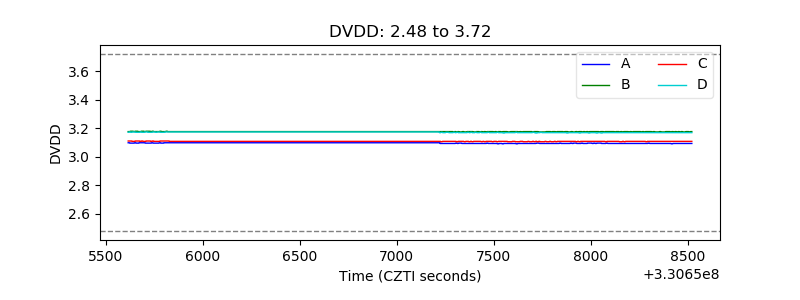 |
| Temperature 1 | 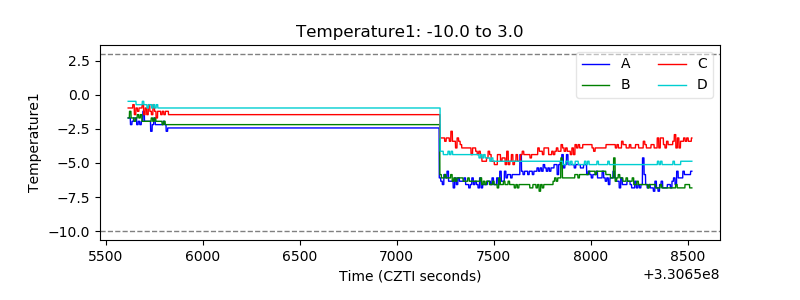 |
| Veto HV Monitor | 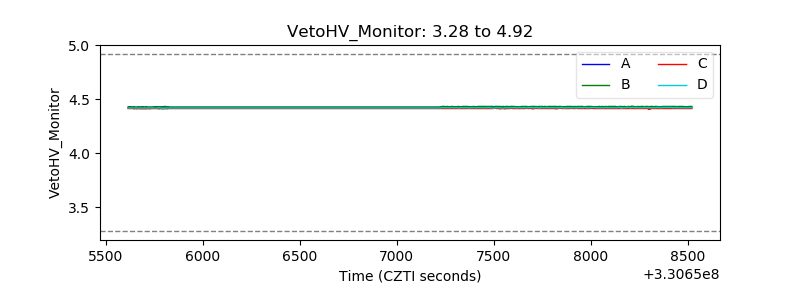 |
| Veto LLD |  |
| Alpha Counter | 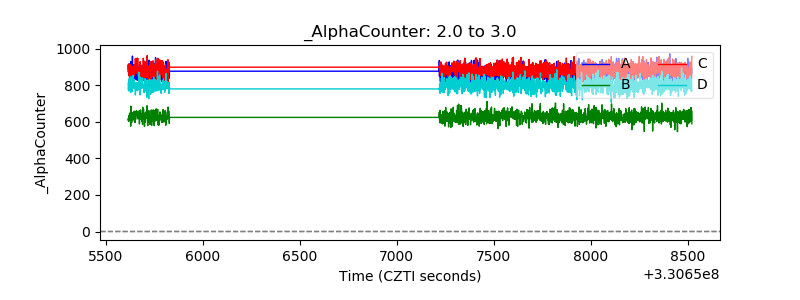 |
| _CPM_Rate | 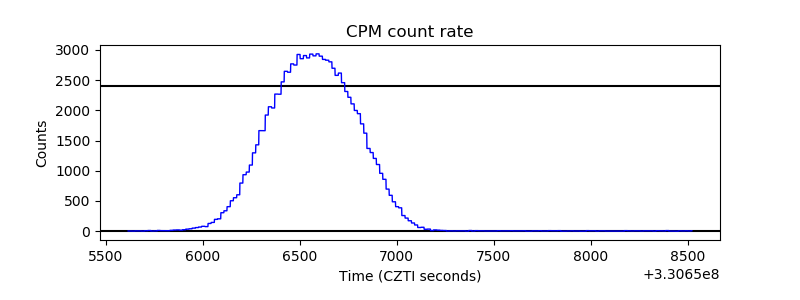 |
| CZT Counter | 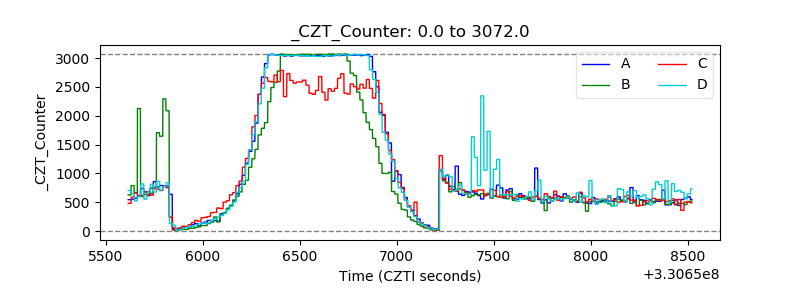 |
| +2.5 Volts monitor |  |
| +5 Volts monitor | 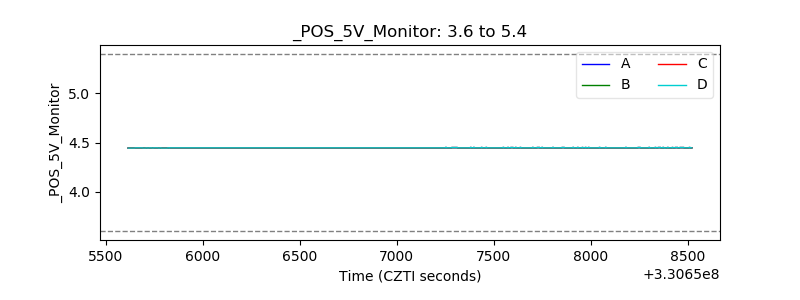 |
| _ROLL_ROT | 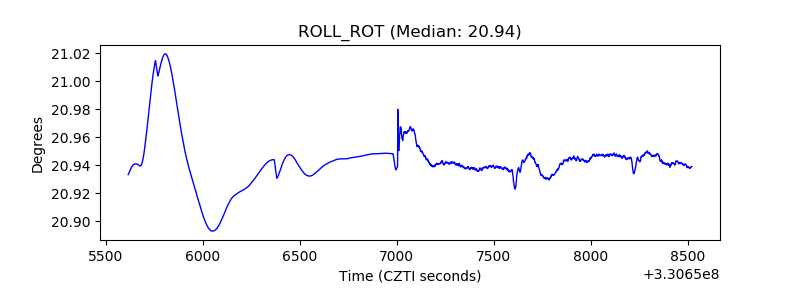 |
| _Roll_DEC | 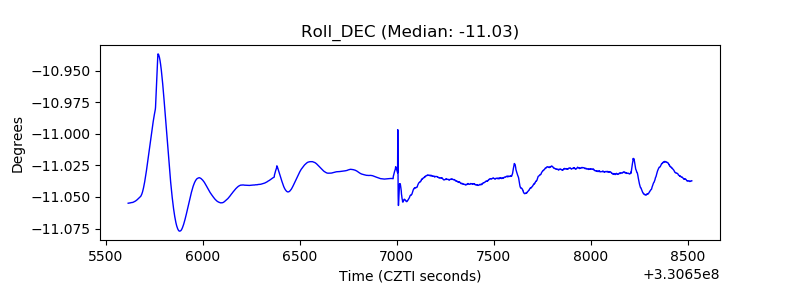 |
| _Roll_RA | 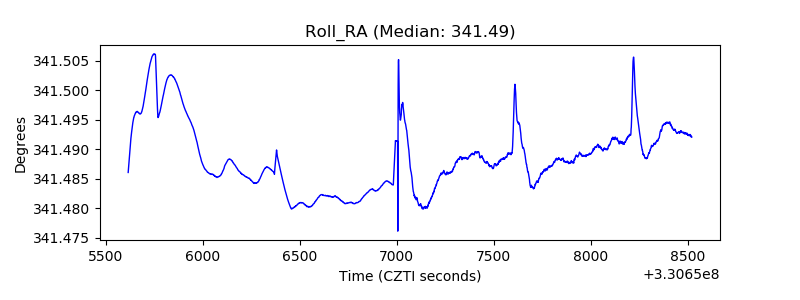 |
| Veto Counter | 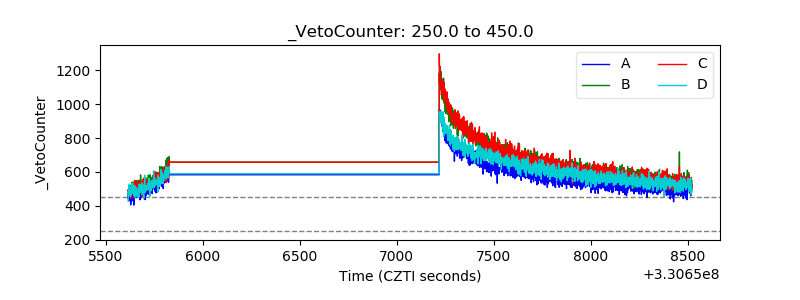 |