| Param | Original file | Final file |
|---|---|---|
| Filename | modeM0/AS1A07_127T03_9000003732_25621cztM0_level2.evt | modeM0/AS1A07_127T03_9000003732_25621cztM0_level2_quad_clean.evt |
| Size (bytes) | 493,015,680 | 100,949,760 |
| Size | 470.2 MB | 96.3 MB |
| Events in quadrant A | 3,689,208 | 661,457 |
| Events in quadrant B | 3,336,618 | 686,556 |
| Events in quadrant C | 3,341,750 | 644,344 |
| Events in quadrant D | 4,136,421 | 625,529 |
| Mode M9 | |||
|---|---|---|---|
| Quadrant | BADHDUFLAG | Total packets | Discarded packets |
| A | 0 | 22 | 0 |
| B | 0 | 23 | 0 |
| C | 0 | 23 | 0 |
| D | 0 | 23 | 0 |
| Mode M0 | |||
|---|---|---|---|
| Quadrant | BADHDUFLAG | Total packets | Discarded packets |
| A | 0 | 14752 | 0 |
| B | 0 | 13662 | 0 |
| C | 0 | 13703 | 0 |
| D | 0 | 16517 | 0 |
| Quadrant | Total seconds | Saturated seconds | Saturation percentage |
|---|---|---|---|
| A | 6296 | 64 | 1.016518% |
| B | 6296 | 63 | 1.000635% |
| C | 6296 | 95 | 1.508895% |
| D | 6296 | 92 | 1.461245% |
Noise dominated data is calculated using 1-second bins in cleaned event files. If a bin has >2000 counts, and if more than 50% of those come from <1% of pixels, then it is considered to be noise-dominated and hence unusable.
| Quadrant | # 1 sec bins | Bins with >0 counts | Bins with >2000 counts | High rate bins dominated by noise | Noise dominated (total time) | Noise dominated (detector-on time) | Marked lightcurve |
|---|---|---|---|---|---|---|---|
| A | 7621 | 6297 | 20 | 20 | 0.26% | 0.32% | 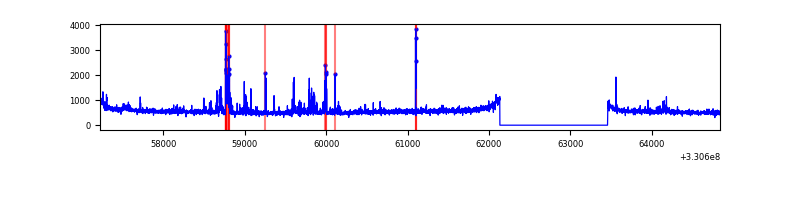 |
| B | 7621 | 6297 | 1 | 1 | 0.01% | 0.02% | 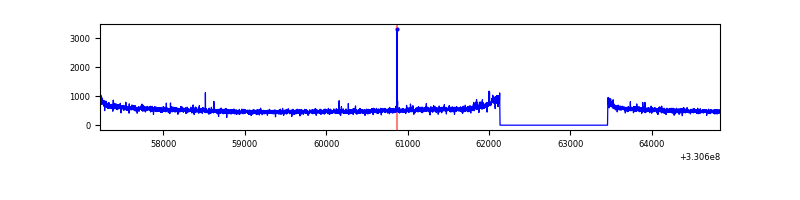 |
| C | 7621 | 6297 | 0 | 0 | 0.00% | 0.00% | 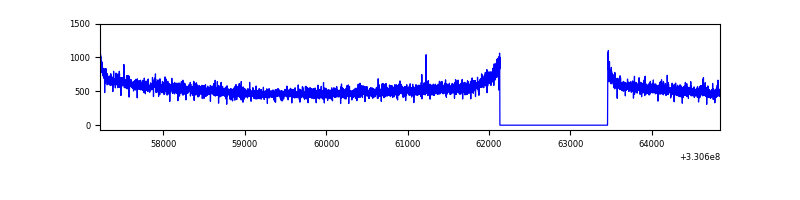 |
| D | 7621 | 6297 | 61 | 61 | 0.80% | 0.97% | 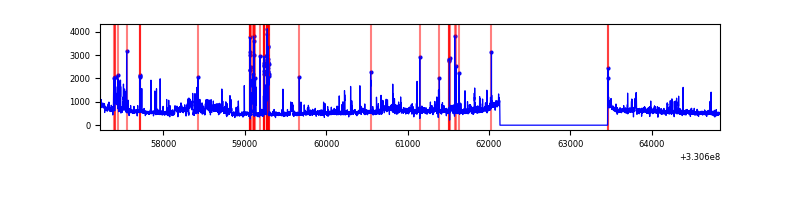 |
Top three noisy pixels from each quadrant. If the there are fewer than three noisy pixels in the level2.evt file, extra rows are filled as -1
| Pixel properties | Quadrant properties | ||||||
|---|---|---|---|---|---|---|---|
| Quadrant | DetID | PixID | Counts | Sigma | Mean | Median | Sigma |
| A | 0 | 13 | 245047 | 1442.96 | 846 | 831 | 169.2 |
| A | 8 | 192 | 138864 | 815.57 | 846 | 831 | 169.2 |
| A | 6 | 16 | 36301 | 209.57 | 846 | 831 | 169.2 |
| B | 12 | 111 | 18751 | 112.33 | 847 | 824 | 159.6 |
| B | 11 | 111 | 16691 | 99.43 | 847 | 824 | 159.6 |
| B | 14 | 111 | 15151 | 89.78 | 847 | 824 | 159.6 |
| C | 14 | 238 | 132282 | 691.67 | 818 | 825 | 190.1 |
| C | 3 | 233 | 19733 | 99.49 | 818 | 825 | 190.1 |
| C | 13 | 61 | 5503 | 24.61 | 818 | 825 | 190.1 |
| D | 1 | 52 | 524031 | 2576.59 | 822 | 803 | 203.1 |
| D | 8 | 195 | 304947 | 1497.73 | 822 | 803 | 203.1 |
| D | 2 | 244 | 195771 | 960.1 | 822 | 803 | 203.1 |
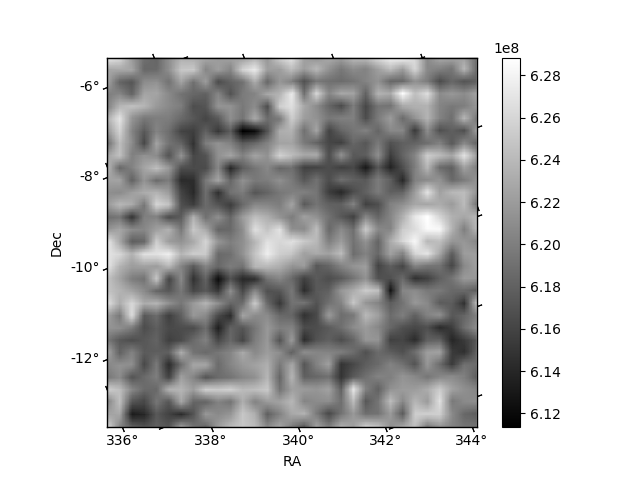
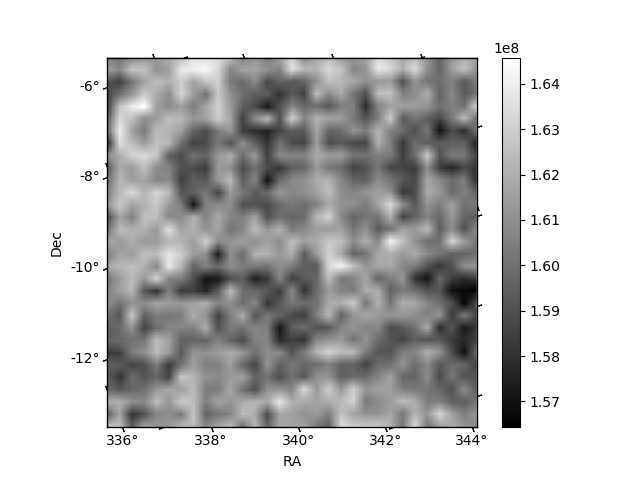
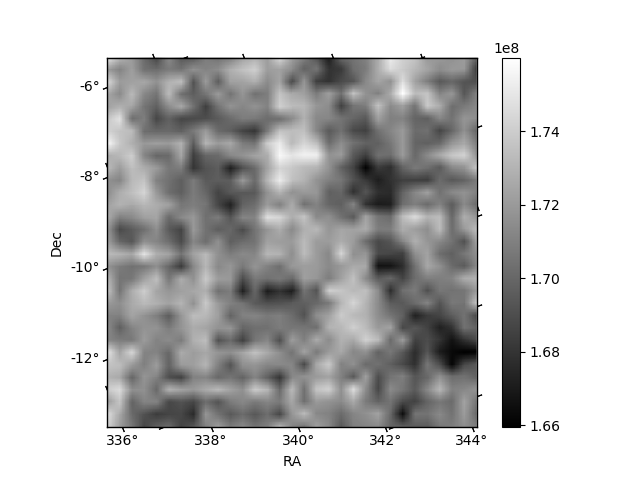
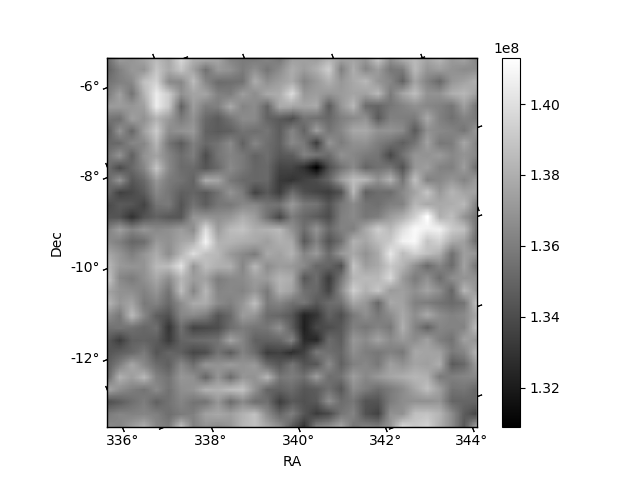
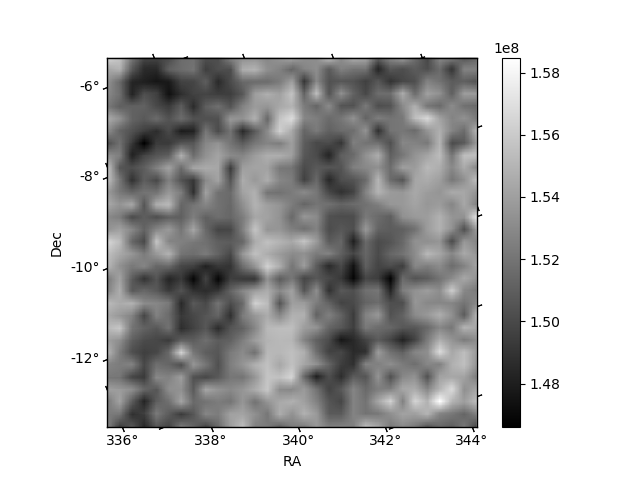
Histogram calculated using DETX and DETY for each event in the final _common_clean file
| Quadrant A | 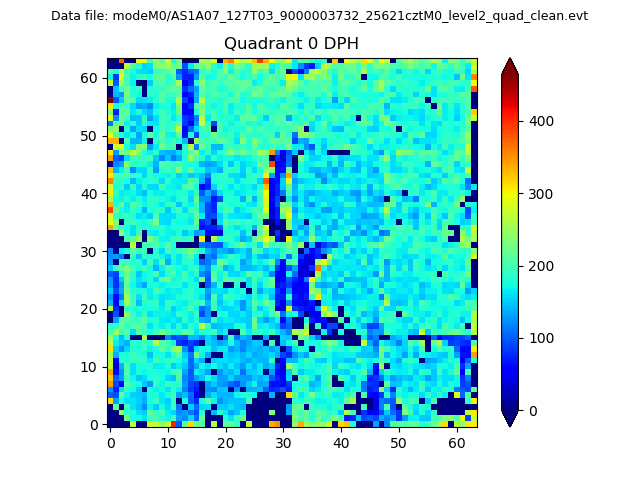 |
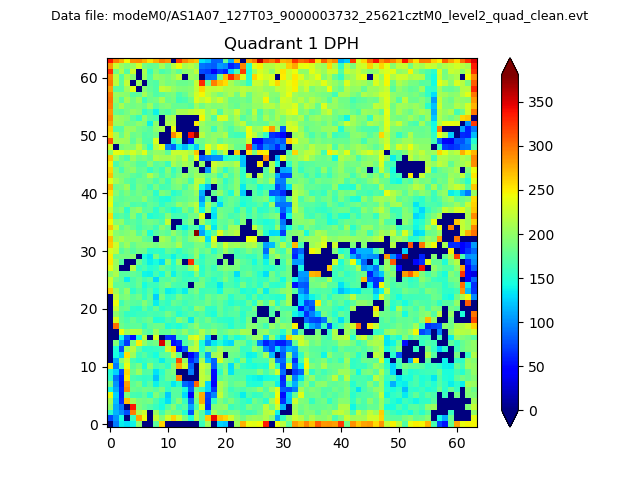 |
Quadrant B |
|---|---|---|---|
| Quadrant D |  |
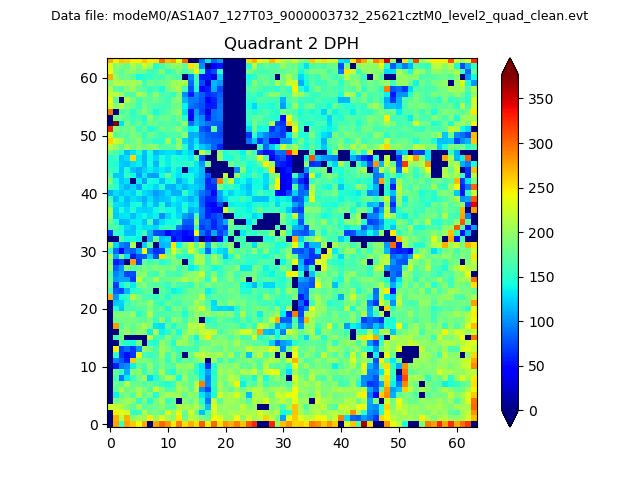 |
Quadrant C |
| Plot type | Count rate plots | Images |
|---|---|---|
| Comparison with Poisson distribution Blue bars denote a histogram of data divided into 1 sec bins. Red curve is a Poisson curve with rate = median count rate of data. |
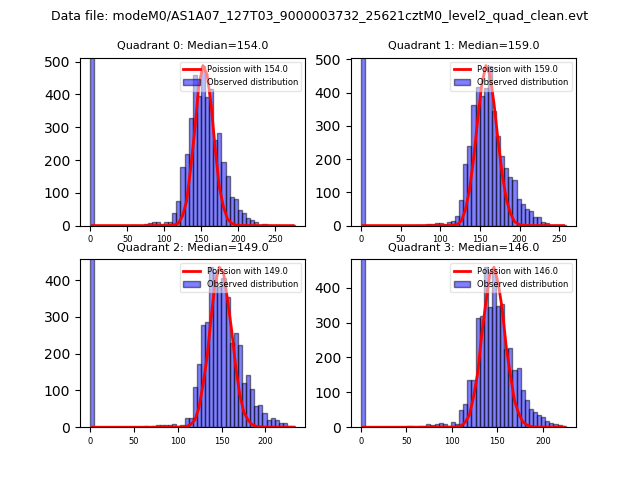 |
 |
| Quadrant-wise count rates Data is divided into 100 sec bins |
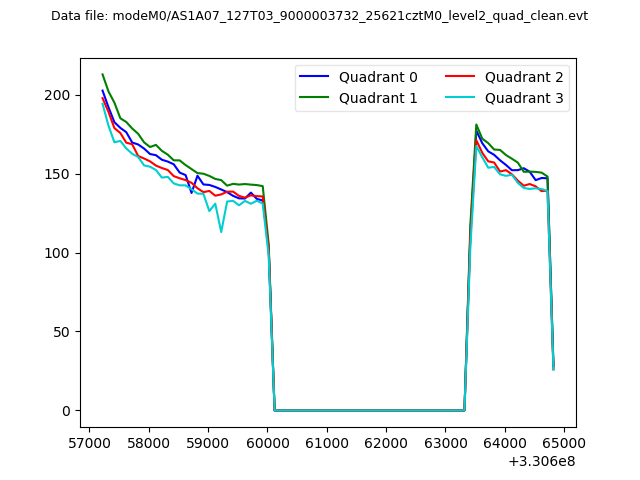 |
|
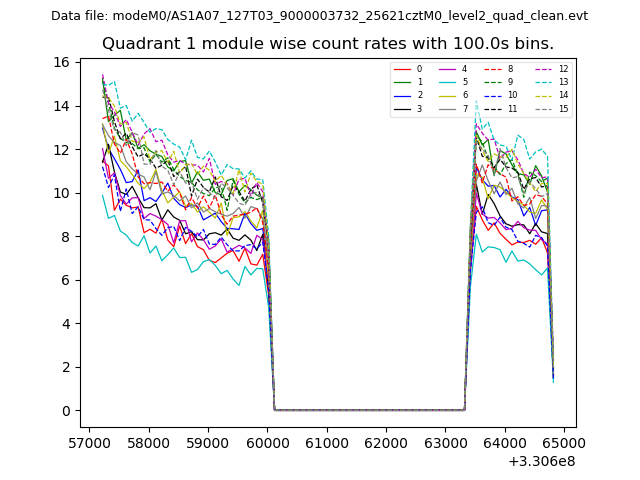
| Module-wise count rates for Quadrant A Data is divided into 100 sec bins |
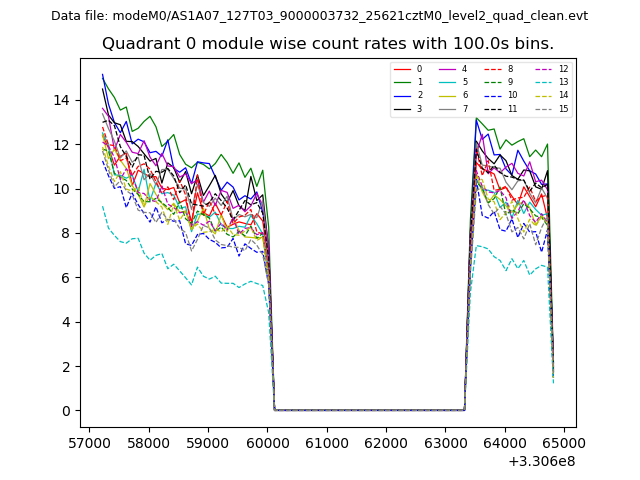 |
 |
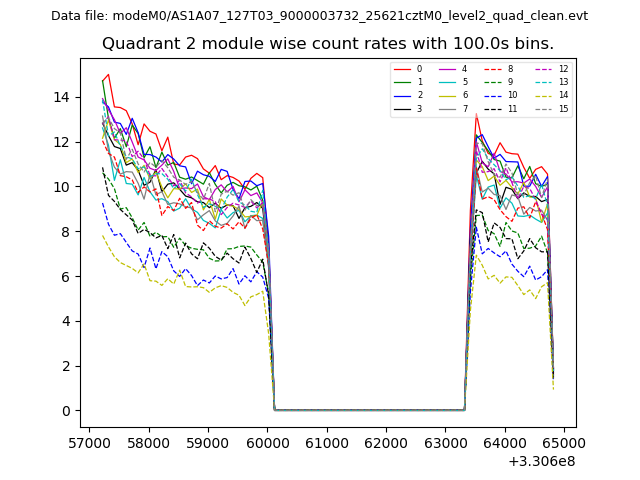
| Module-wise count rates for Quadrant B Data is divided into 100 sec bins |
 |
 |
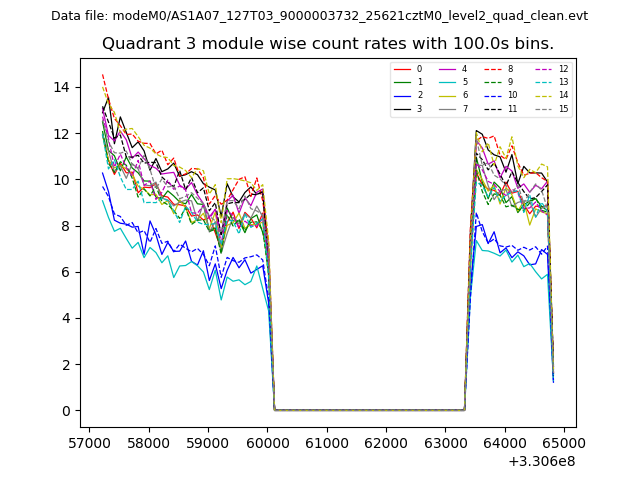
| Module-wise count rates for Quadrant C Data is divided into 100 sec bins |
 |
 |
| Module-wise count rates for Quadrant D Data is divided into 100 sec bins |
 |
 |
| Parameter | Plot |
|---|---|
| CZT HV Monitor | 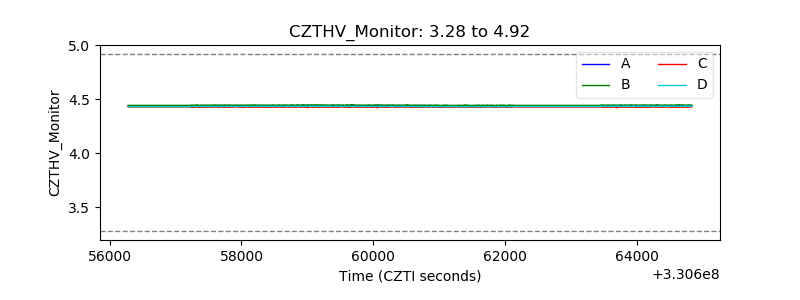 |
| D_VDD | 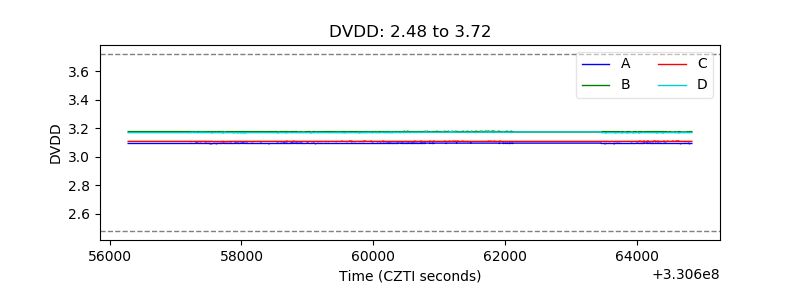 |
| Temperature 1 |  |
| Veto HV Monitor | 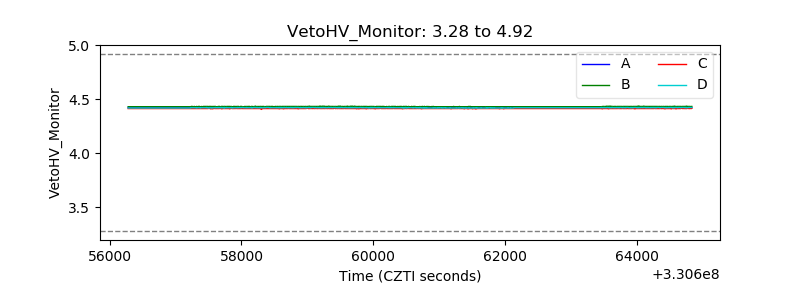 |
| Veto LLD | 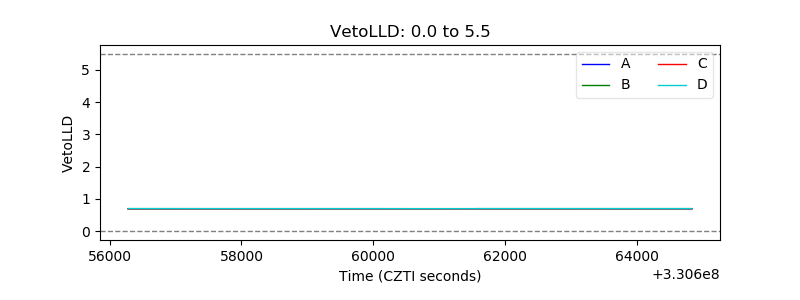 |
| Alpha Counter | 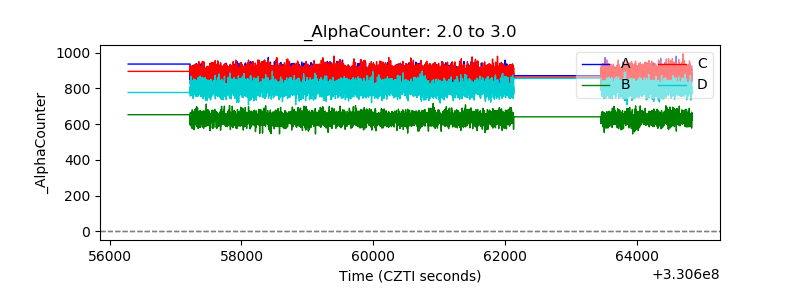 |
| _CPM_Rate | 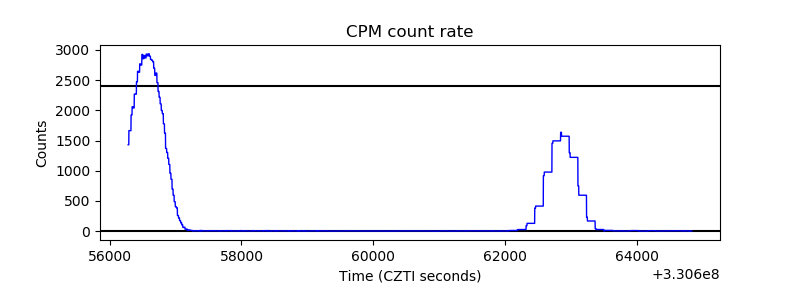 |
| CZT Counter | 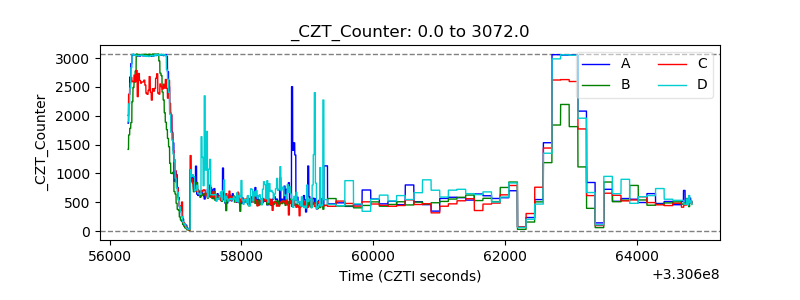 |
| +2.5 Volts monitor |  |
| +5 Volts monitor |  |
| _ROLL_ROT | 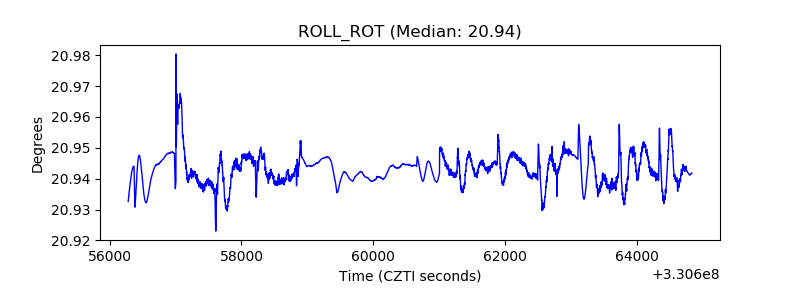 |
| _Roll_DEC | 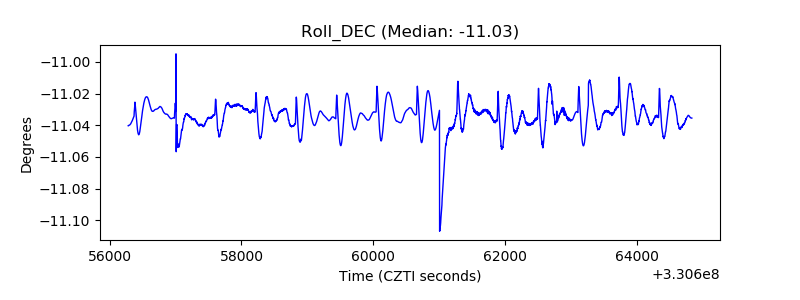 |
| _Roll_RA | 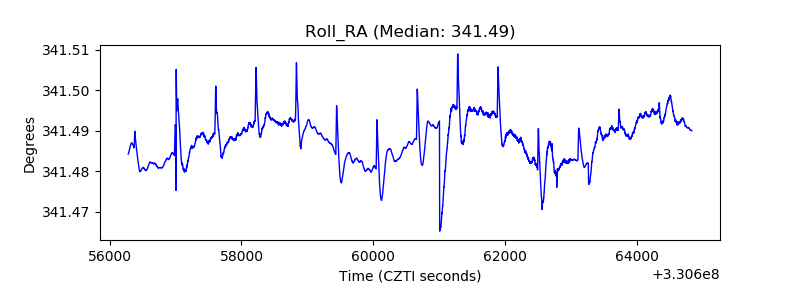 |
| Veto Counter | 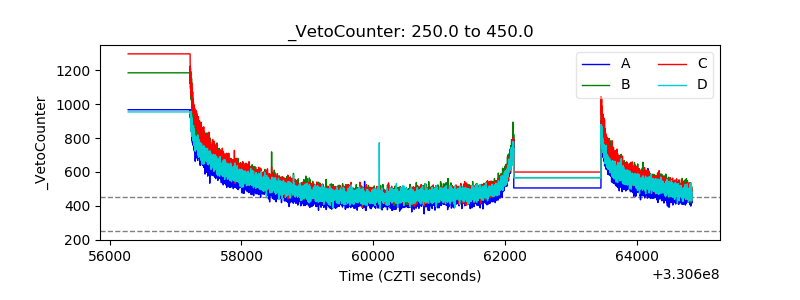 |