| Param | Original file | Final file |
|---|---|---|
| Filename | modeM0/AS1A07_127T03_9000003732_25622cztM0_level2.evt | modeM0/AS1A07_127T03_9000003732_25622cztM0_level2_quad_clean.evt |
| Size (bytes) | 312,318,720 | 75,343,680 |
| Size | 297.9 MB | 71.9 MB |
| Events in quadrant A | 2,270,002 | 487,303 |
| Events in quadrant B | 2,172,280 | 499,736 |
| Events in quadrant C | 2,201,642 | 506,536 |
| Events in quadrant D | 2,502,191 | 466,440 |
| Mode M9 | |||
|---|---|---|---|
| Quadrant | BADHDUFLAG | Total packets | Discarded packets |
| A | 0 | 12 | 3 |
| B | 0 | 16 | 8 |
| C | 0 | 16 | 9 |
| D | 0 | 17 | 8 |
| Mode M0 | |||
|---|---|---|---|
| Quadrant | BADHDUFLAG | Total packets | Discarded packets |
| A | 0 | 9346 | 0 |
| B | 0 | 9184 | 0 |
| C | 0 | 9320 | 0 |
| D | 0 | 10129 | 0 |
| Quadrant | Total seconds | Saturated seconds | Saturation percentage |
|---|---|---|---|
| A | 4457 | 10 | 0.224366% |
| B | 4454 | 18 | 0.404131% |
| C | 4506 | 30 | 0.665779% |
| D | 4342 | 21 | 0.483648% |
Noise dominated data is calculated using 1-second bins in cleaned event files. If a bin has >2000 counts, and if more than 50% of those come from <1% of pixels, then it is considered to be noise-dominated and hence unusable.
| Quadrant | # 1 sec bins | Bins with >0 counts | Bins with >2000 counts | High rate bins dominated by noise | Noise dominated (total time) | Noise dominated (detector-on time) | Marked lightcurve |
|---|---|---|---|---|---|---|---|
| A | 7990 | 4719 | 0 | 0 | 0.00% | 0.00% | 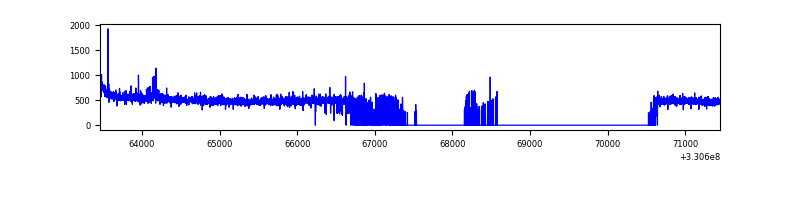 |
| B | 7990 | 4722 | 3 | 3 | 0.04% | 0.06% | 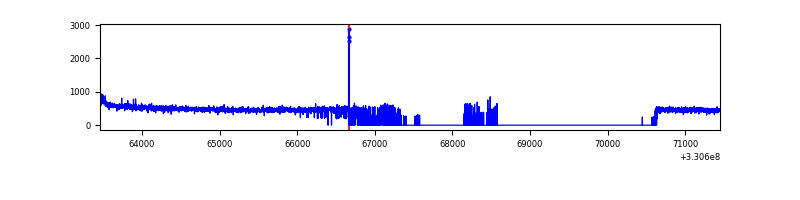 |
| C | 7990 | 4776 | 0 | 0 | 0.00% | 0.00% | 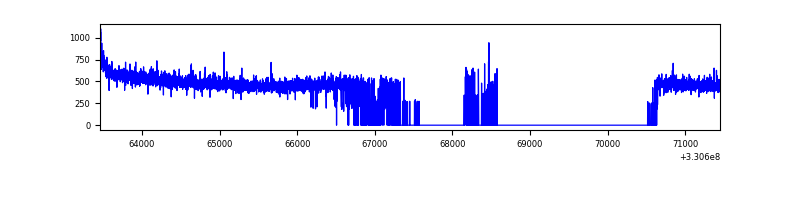 |
| D | 7990 | 4571 | 6 | 6 | 0.08% | 0.13% | 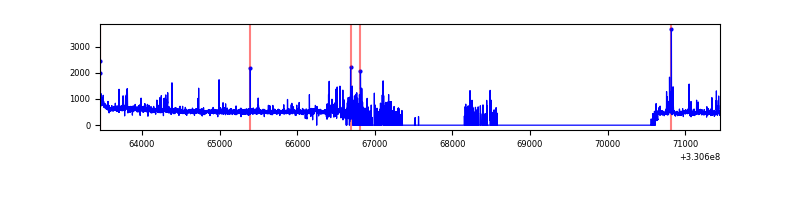 |
Top three noisy pixels from each quadrant. If the there are fewer than three noisy pixels in the level2.evt file, extra rows are filled as -1
| Pixel properties | Quadrant properties | ||||||
|---|---|---|---|---|---|---|---|
| Quadrant | DetID | PixID | Counts | Sigma | Mean | Median | Sigma |
| A | 8 | 192 | 90986 | 805.9 | 556 | 546 | 112.2 |
| A | 0 | 13 | 21372 | 185.58 | 556 | 546 | 112.2 |
| A | 6 | 16 | 11191 | 94.86 | 556 | 546 | 112.2 |
| B | 12 | 111 | 12117 | 110.48 | 551 | 538 | 104.8 |
| B | 11 | 111 | 11099 | 100.77 | 551 | 538 | 104.8 |
| B | 14 | 111 | 10139 | 91.61 | 551 | 538 | 104.8 |
| C | 14 | 238 | 86454 | 674.26 | 541 | 547 | 127.4 |
| C | 3 | 233 | 6390 | 45.86 | 541 | 547 | 127.4 |
| C | 13 | 61 | 3713 | 24.85 | 541 | 547 | 127.4 |
| D | 8 | 195 | 267317 | 1915.99 | 525 | 515 | 139.2 |
| D | 1 | 52 | 167711 | 1200.69 | 525 | 515 | 139.2 |
| D | 2 | 244 | 68988 | 491.73 | 525 | 515 | 139.2 |
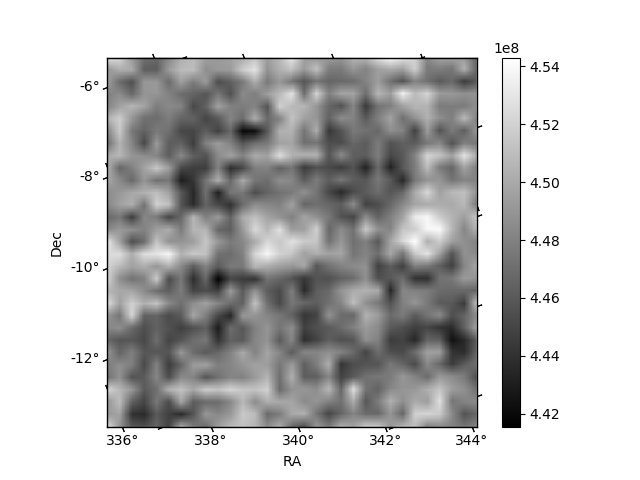
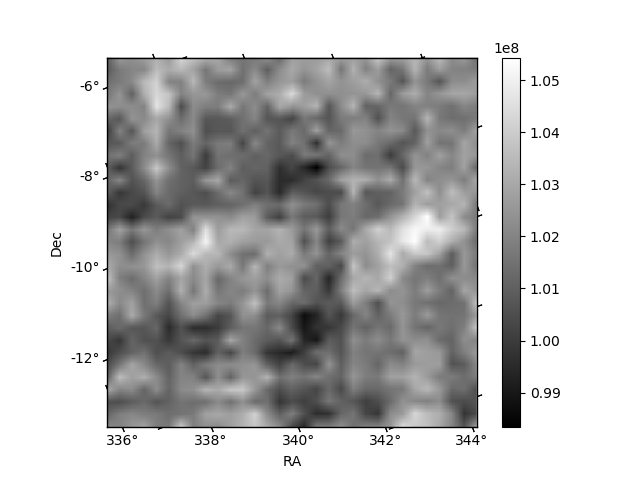
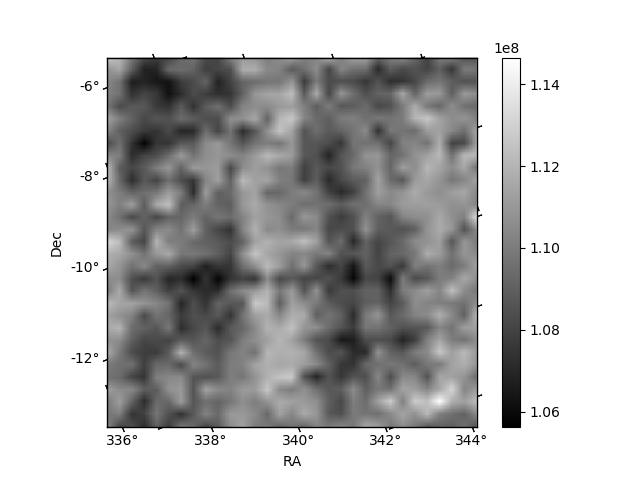
Histogram calculated using DETX and DETY for each event in the final _common_clean file
| Quadrant A | 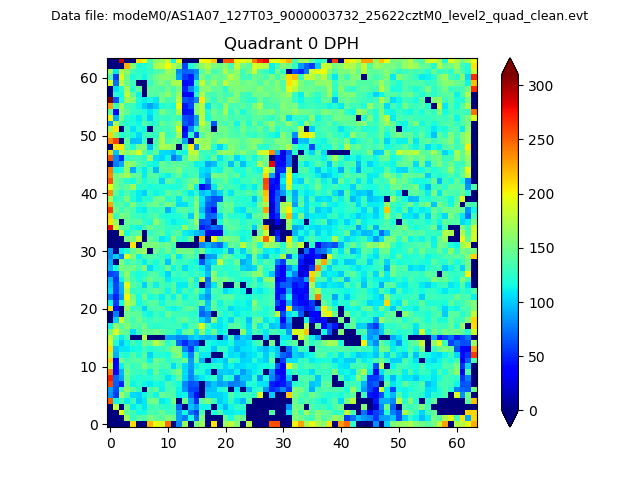 |
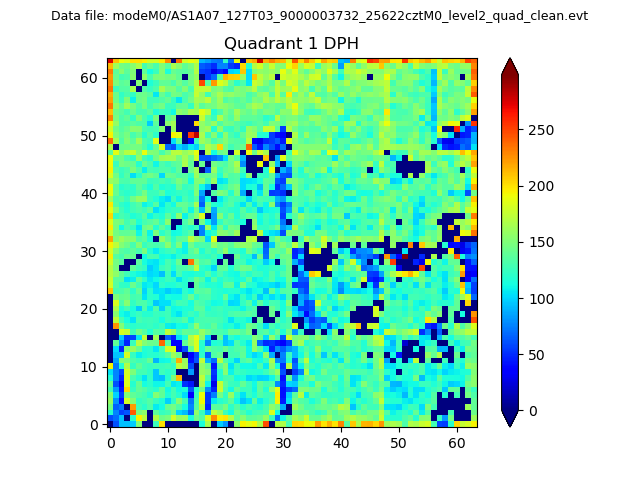 |
Quadrant B |
|---|---|---|---|
| Quadrant D | 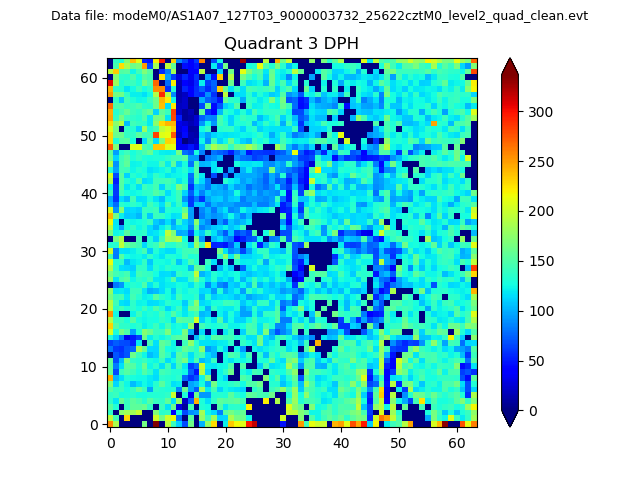 |
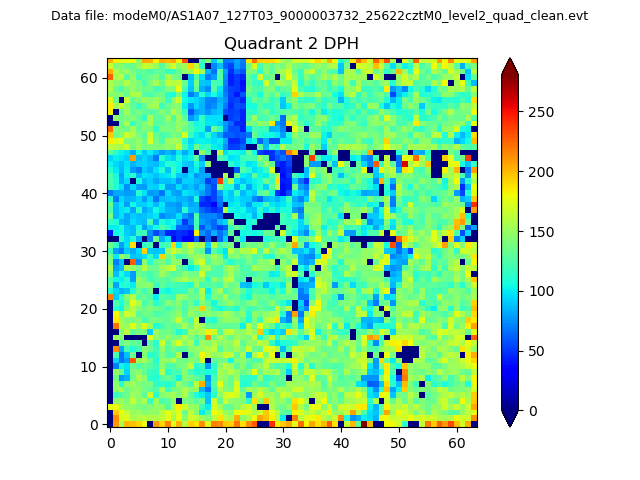 |
Quadrant C |
| Plot type | Count rate plots | Images |
|---|---|---|
| Comparison with Poisson distribution Blue bars denote a histogram of data divided into 1 sec bins. Red curve is a Poisson curve with rate = median count rate of data. |
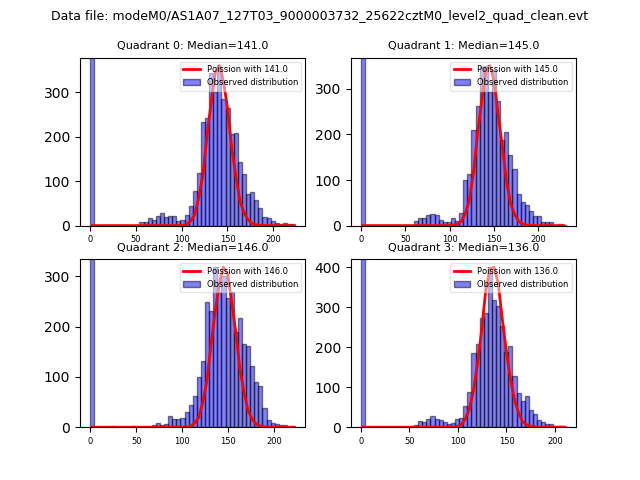 |
 |
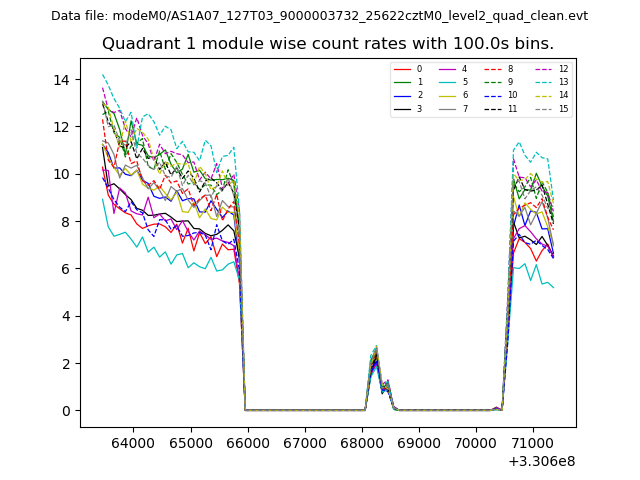
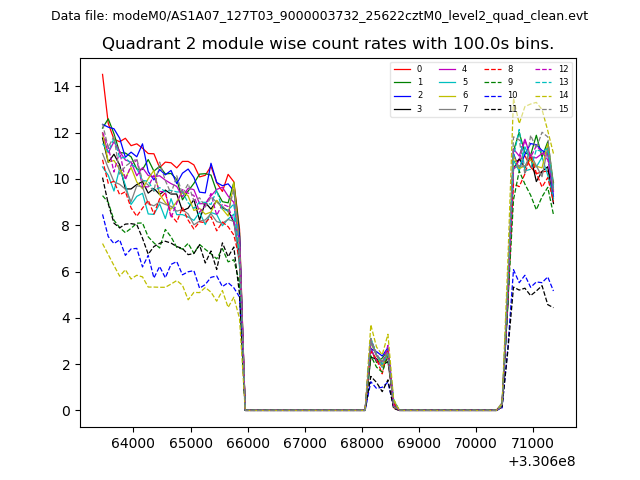
| Quadrant-wise count rates Data is divided into 100 sec bins |
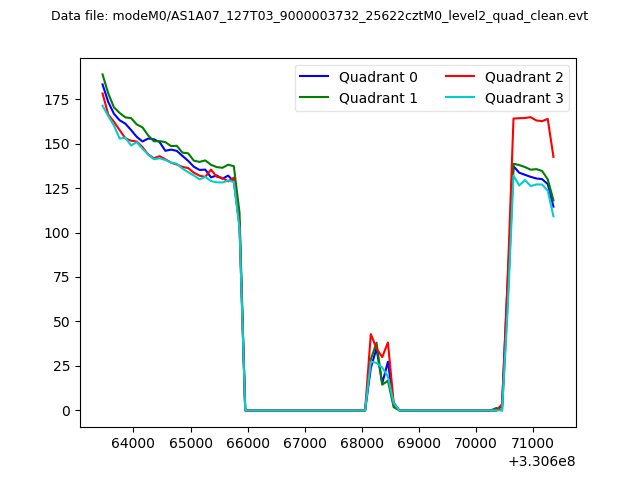 |
|
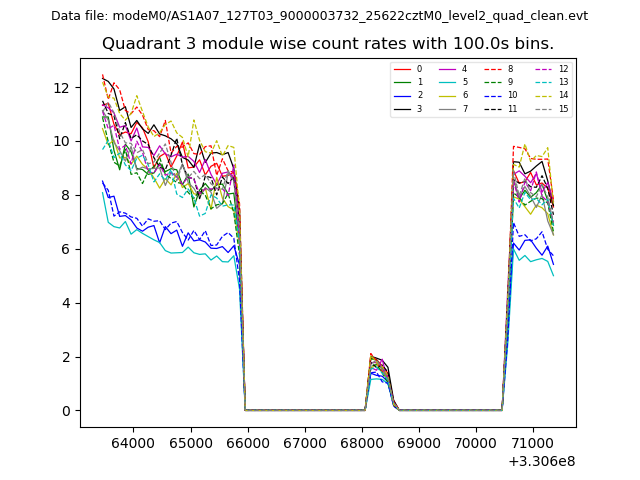
| Module-wise count rates for Quadrant A Data is divided into 100 sec bins |
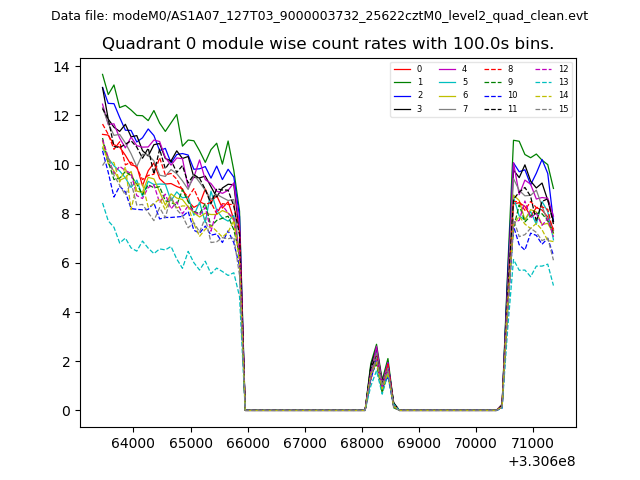 |
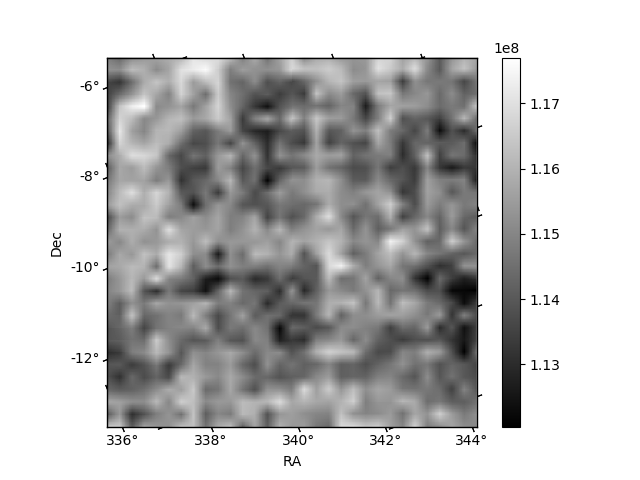 |
| Module-wise count rates for Quadrant B Data is divided into 100 sec bins |
 |
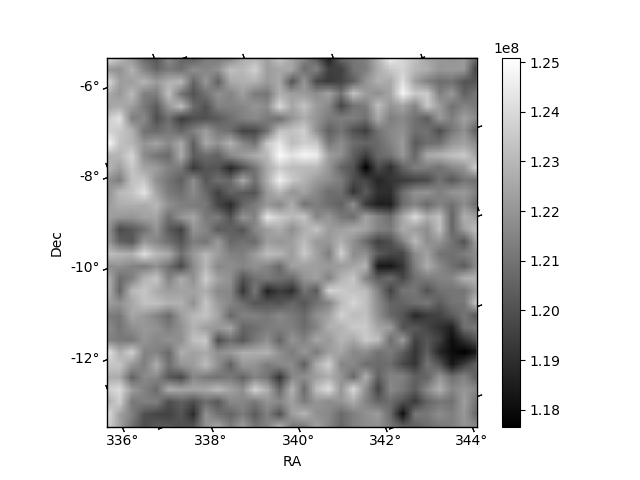 |
| Module-wise count rates for Quadrant C Data is divided into 100 sec bins |
 |
 |
| Module-wise count rates for Quadrant D Data is divided into 100 sec bins |
 |
 |
| Parameter | Plot |
|---|---|
| CZT HV Monitor | 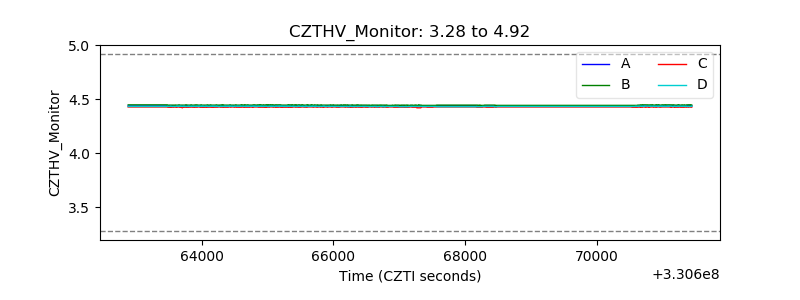 |
| D_VDD |  |
| Temperature 1 | 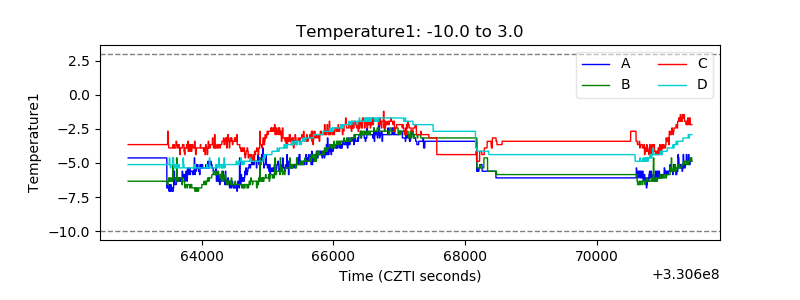 |
| Veto HV Monitor | 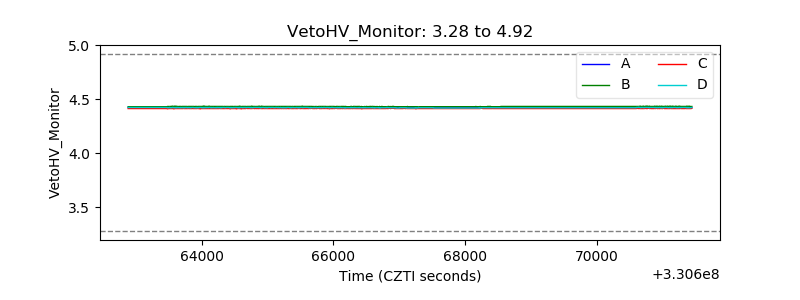 |
| Veto LLD | 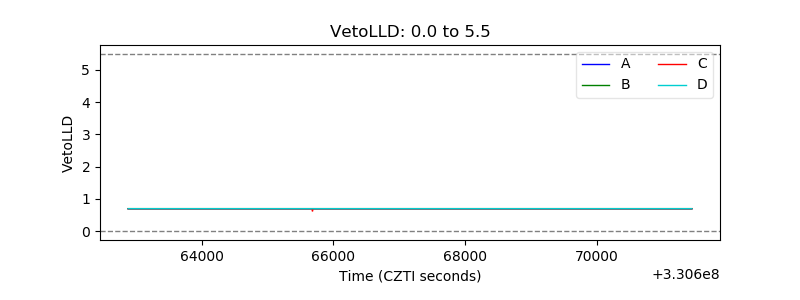 |
| Alpha Counter | 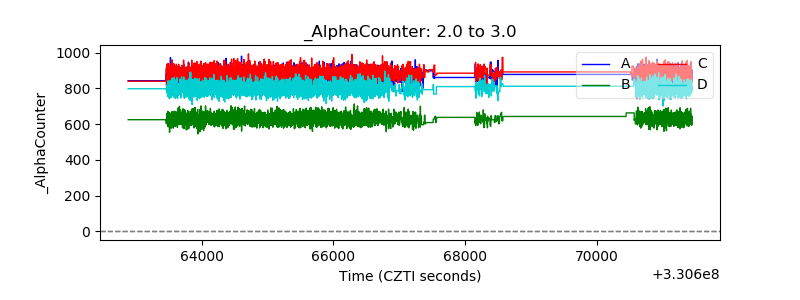 |
| _CPM_Rate | 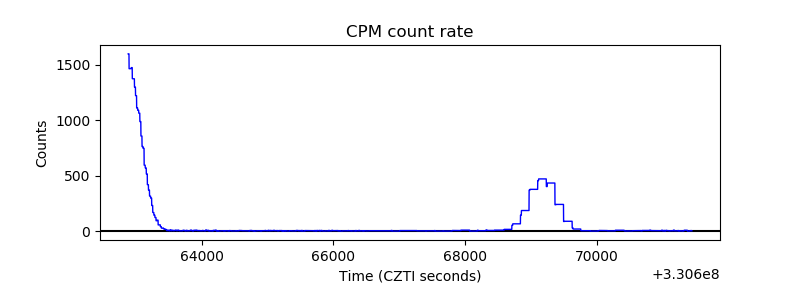 |
| CZT Counter | 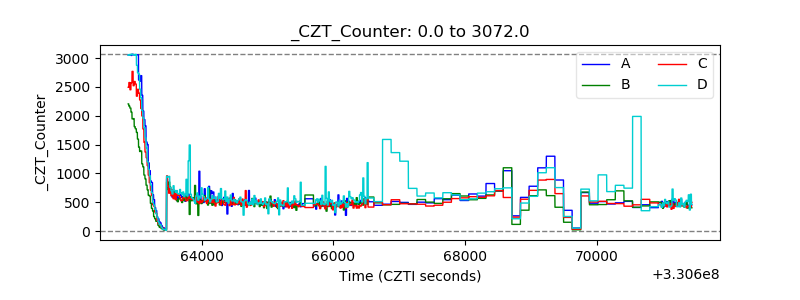 |
| +2.5 Volts monitor |  |
| +5 Volts monitor |  |
| _ROLL_ROT | 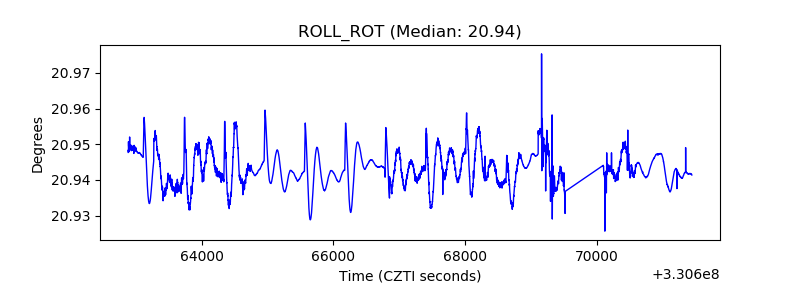 |
| _Roll_DEC | 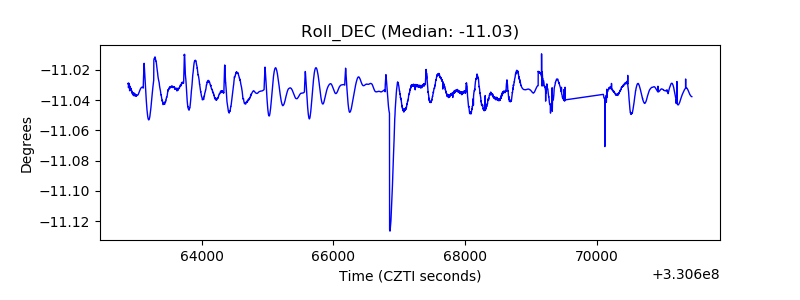 |
| _Roll_RA | 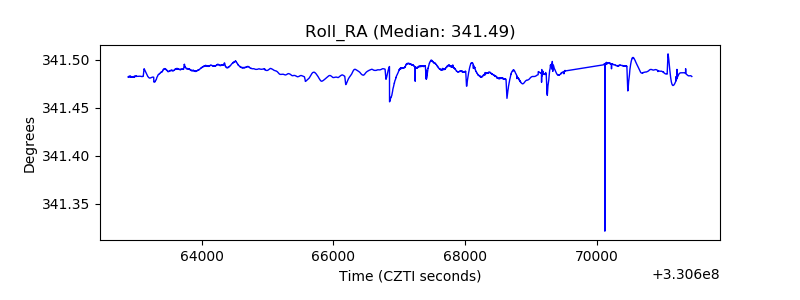 |
| Veto Counter | 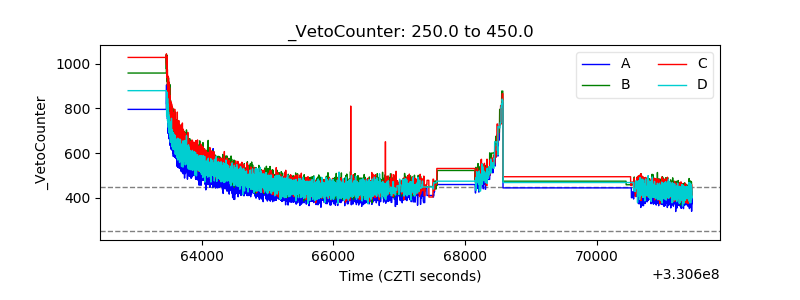 |