| Param | Original file | Final file |
|---|---|---|
| Filename | modeM0/AS1A07_127T03_9000003732_25623cztM0_level2.evt | modeM0/AS1A07_127T03_9000003732_25623cztM0_level2_quad_clean.evt |
| Size (bytes) | 873,181,440 | 153,578,880 |
| Size | 832.7 MB | 146.5 MB |
| Events in quadrant A | 6,280,927 | 971,948 |
| Events in quadrant B | 5,821,919 | 998,675 |
| Events in quadrant C | 5,778,561 | 943,528 |
| Events in quadrant D | 7,776,694 | 932,672 |
| Mode M9 | |||
|---|---|---|---|
| Quadrant | BADHDUFLAG | Total packets | Discarded packets |
| A | 0 | 18 | 0 |
| B | 0 | 18 | 0 |
| C | 0 | 18 | 0 |
| D | 0 | 18 | 0 |
| Mode M0 | |||
|---|---|---|---|
| Quadrant | BADHDUFLAG | Total packets | Discarded packets |
| A | 0 | 25545 | 0 |
| B | 0 | 24375 | 0 |
| C | 0 | 24262 | 0 |
| D | 0 | 30733 | 0 |
| Quadrant | Total seconds | Saturated seconds | Saturation percentage |
|---|---|---|---|
| A | 11627 | 229 | 1.969554% |
| B | 11628 | 230 | 1.977984% |
| C | 11628 | 243 | 2.089783% |
| D | 11628 | 274 | 2.356381% |
Noise dominated data is calculated using 1-second bins in cleaned event files. If a bin has >2000 counts, and if more than 50% of those come from <1% of pixels, then it is considered to be noise-dominated and hence unusable.
| Quadrant | # 1 sec bins | Bins with >0 counts | Bins with >2000 counts | High rate bins dominated by noise | Noise dominated (total time) | Noise dominated (detector-on time) | Marked lightcurve |
|---|---|---|---|---|---|---|---|
| A | 13462 | 11630 | 21 | 21 | 0.16% | 0.18% | 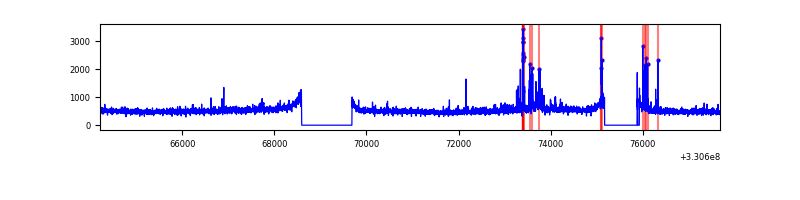 |
| B | 13463 | 11631 | 5 | 5 | 0.04% | 0.04% | 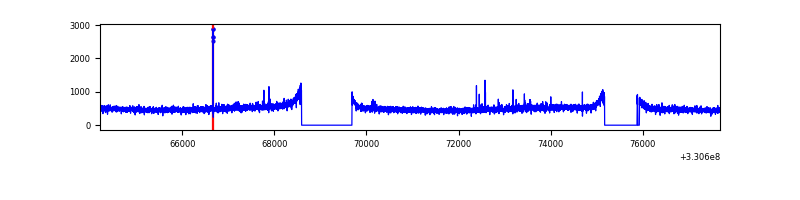 |
| C | 13463 | 11631 | 0 | 0 | 0.00% | 0.00% | 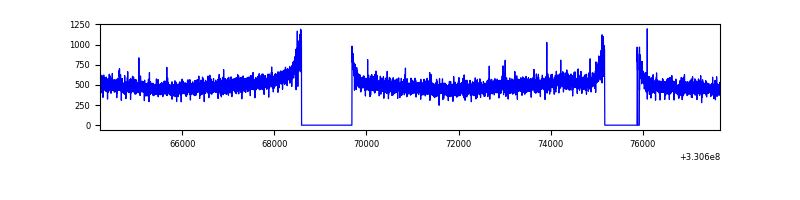 |
| D | 13463 | 11631 | 100 | 100 | 0.74% | 0.86% | 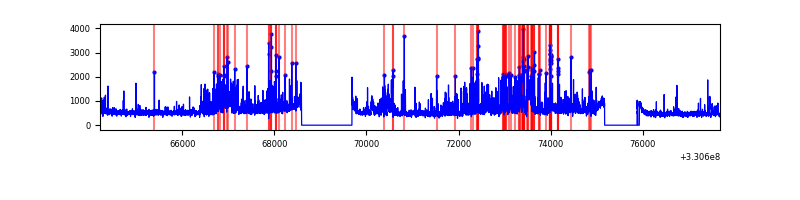 |
Top three noisy pixels from each quadrant. If the there are fewer than three noisy pixels in the level2.evt file, extra rows are filled as -1
| Pixel properties | Quadrant properties | ||||||
|---|---|---|---|---|---|---|---|
| Quadrant | DetID | PixID | Counts | Sigma | Mean | Median | Sigma |
| A | 0 | 13 | 245474 | 820.18 | 1485 | 1456 | 297.5 |
| A | 8 | 192 | 239119 | 798.82 | 1485 | 1456 | 297.5 |
| A | 6 | 16 | 58393 | 191.37 | 1485 | 1456 | 297.5 |
| B | 12 | 111 | 34312 | 116.61 | 1472 | 1436 | 281.9 |
| B | 11 | 111 | 31489 | 106.6 | 1472 | 1436 | 281.9 |
| B | 0 | 190 | 28453 | 95.83 | 1472 | 1436 | 281.9 |
| C | 14 | 238 | 226167 | 675.0 | 1420 | 1433 | 332.9 |
| C | 3 | 233 | 21422 | 60.04 | 1420 | 1433 | 332.9 |
| C | 13 | 61 | 9745 | 24.97 | 1420 | 1433 | 332.9 |
| D | 1 | 52 | 1228354 | 3214.01 | 1435 | 1409 | 381.7 |
| D | 8 | 195 | 577208 | 1508.32 | 1435 | 1409 | 381.7 |
| D | 2 | 244 | 491926 | 1284.92 | 1435 | 1409 | 381.7 |
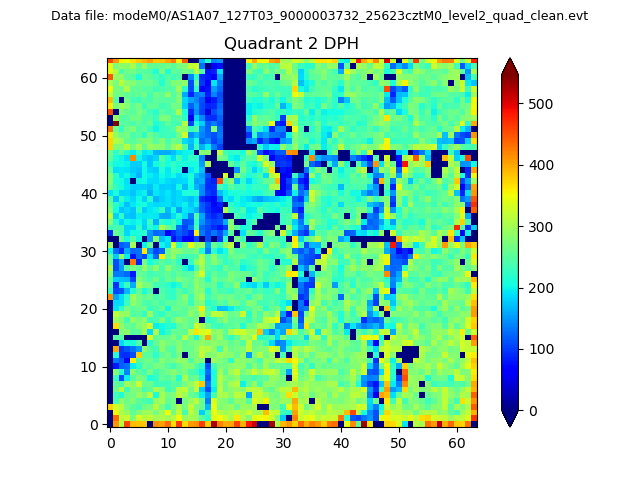
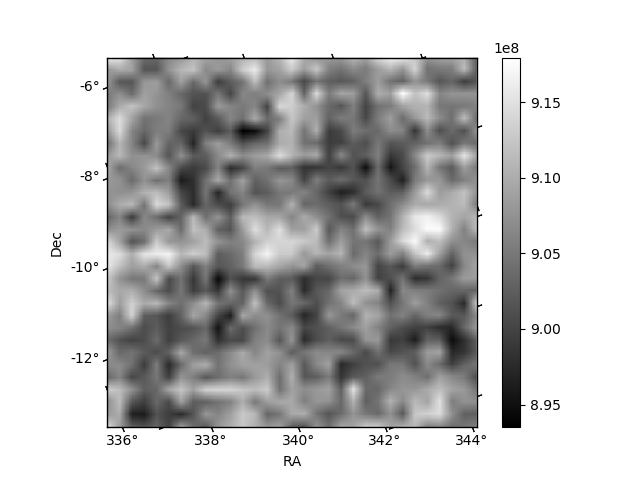
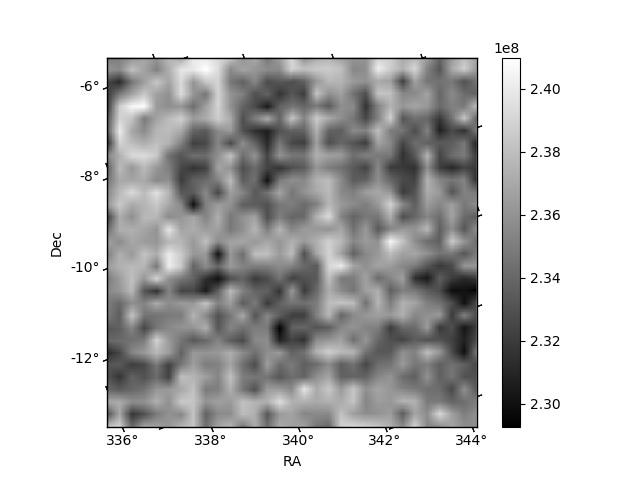
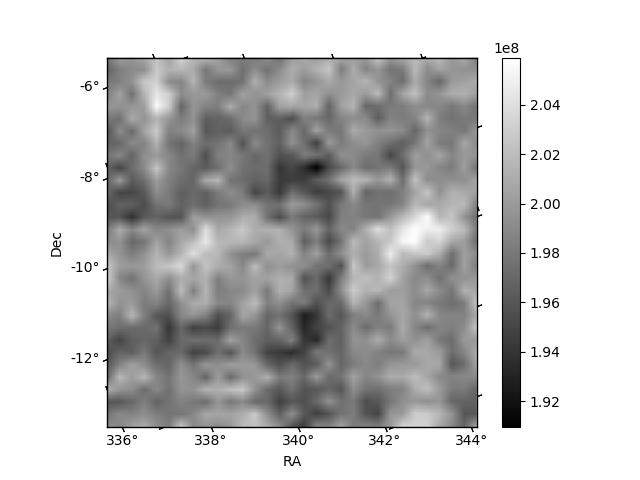
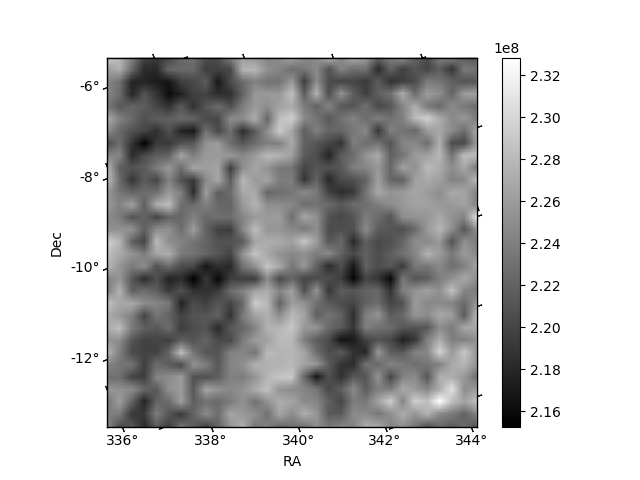
Histogram calculated using DETX and DETY for each event in the final _common_clean file
| Quadrant A | 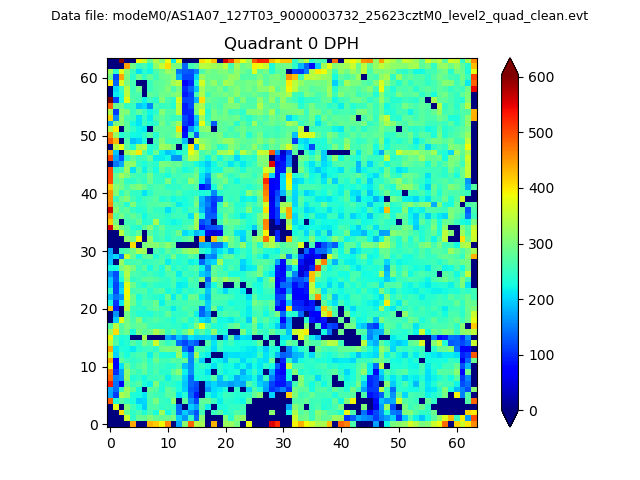 |
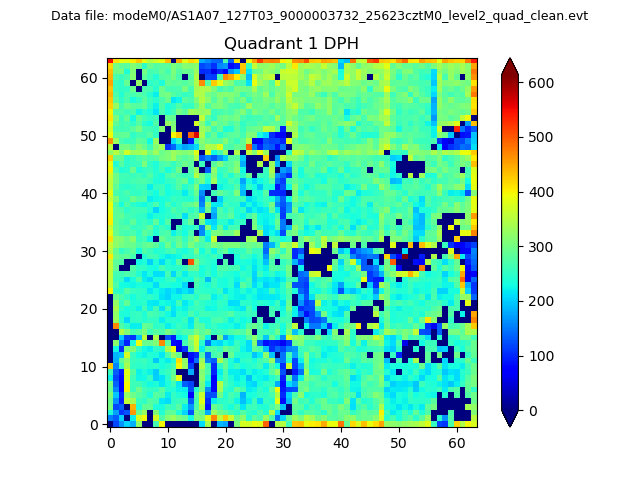 |
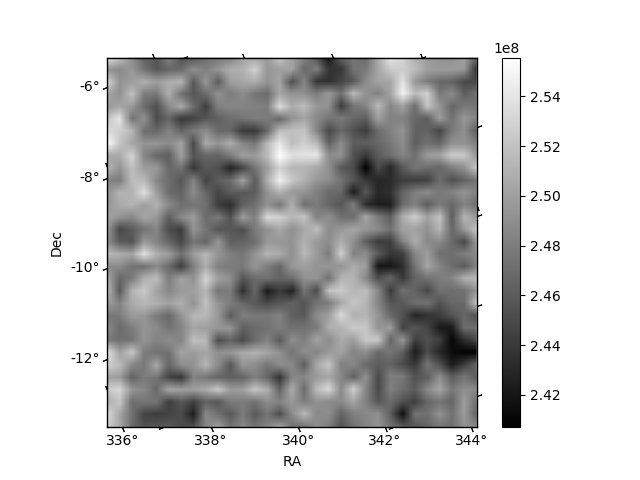
Quadrant B |
|---|---|---|---|
| Quadrant D | 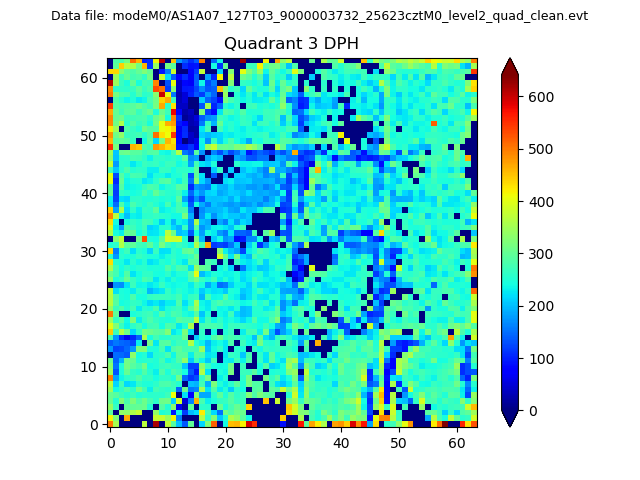 |
 |
Quadrant C |
| Plot type | Count rate plots | Images |
|---|---|---|
| Comparison with Poisson distribution Blue bars denote a histogram of data divided into 1 sec bins. Red curve is a Poisson curve with rate = median count rate of data. |
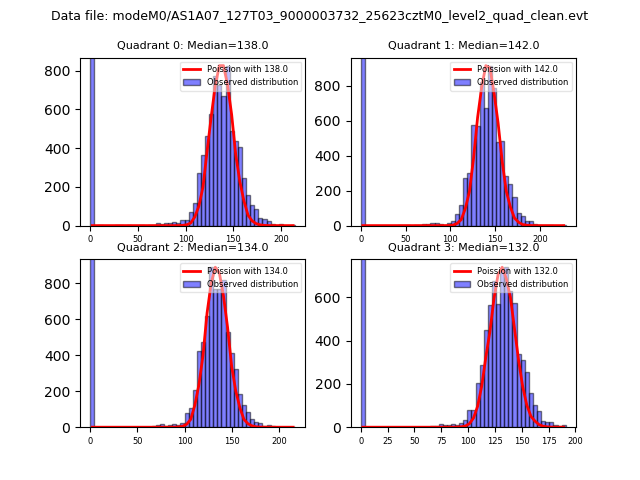 |
 |
| Quadrant-wise count rates Data is divided into 100 sec bins |
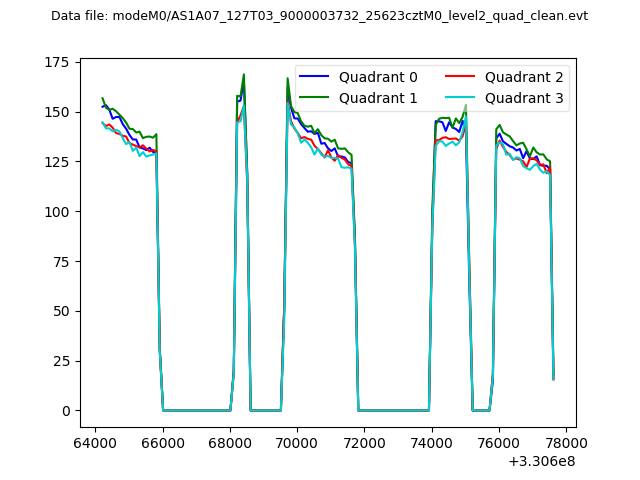 |
|
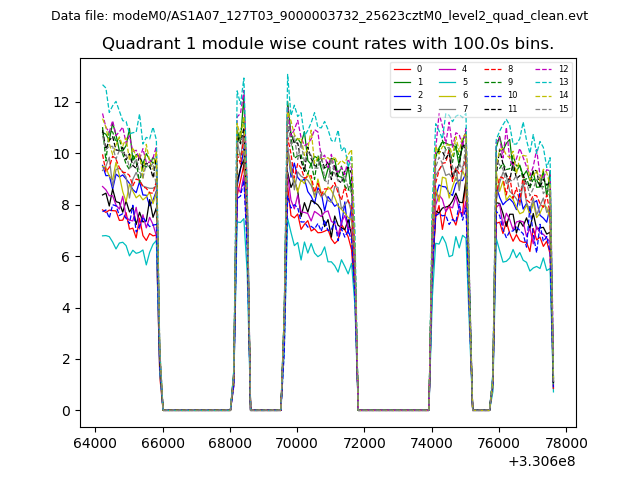
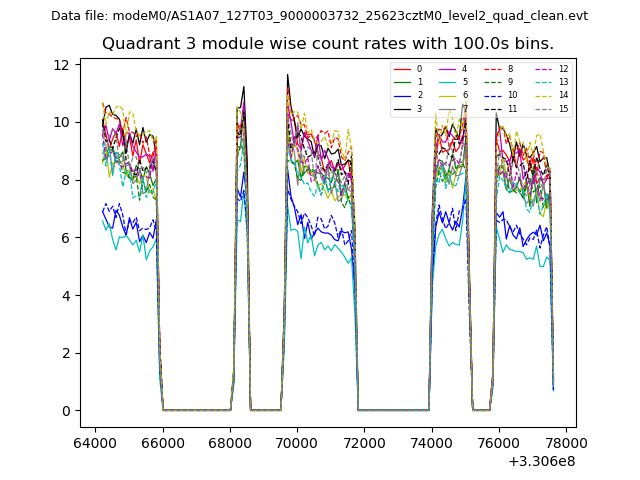
| Module-wise count rates for Quadrant A Data is divided into 100 sec bins |
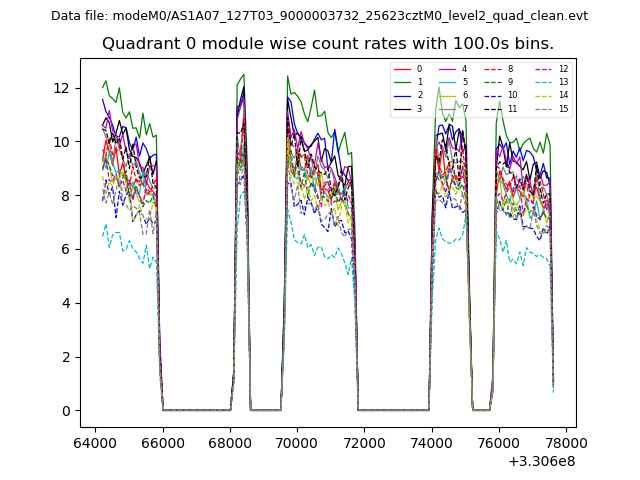 |
 |
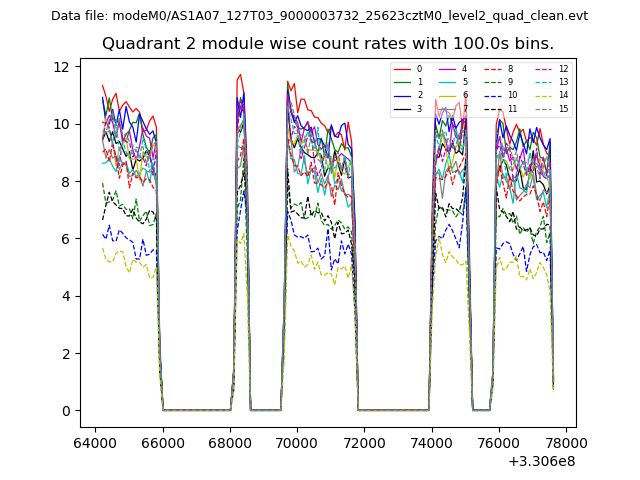
| Module-wise count rates for Quadrant B Data is divided into 100 sec bins |
 |
 |
| Module-wise count rates for Quadrant C Data is divided into 100 sec bins |
 |
 |
| Module-wise count rates for Quadrant D Data is divided into 100 sec bins |
 |
 |
| Parameter | Plot |
|---|---|
| CZT HV Monitor | 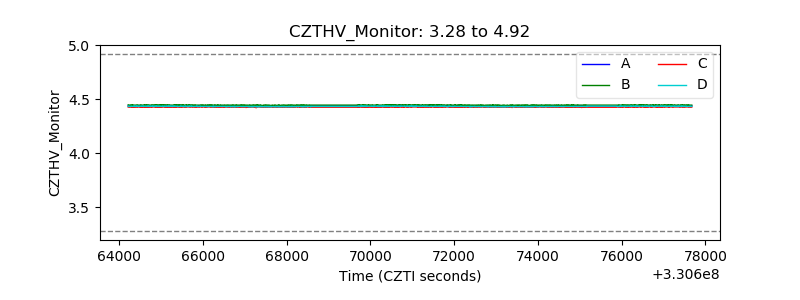 |
| D_VDD | 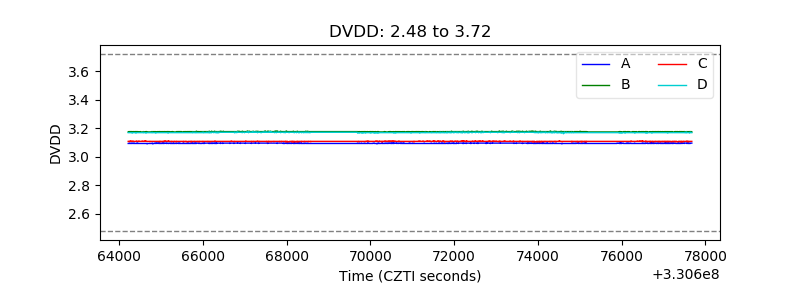 |
| Temperature 1 | 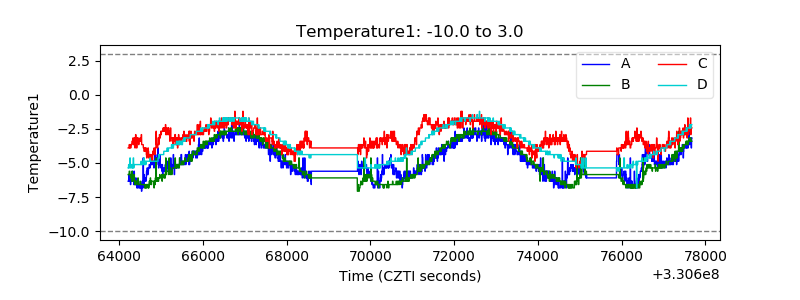 |
| Veto HV Monitor | 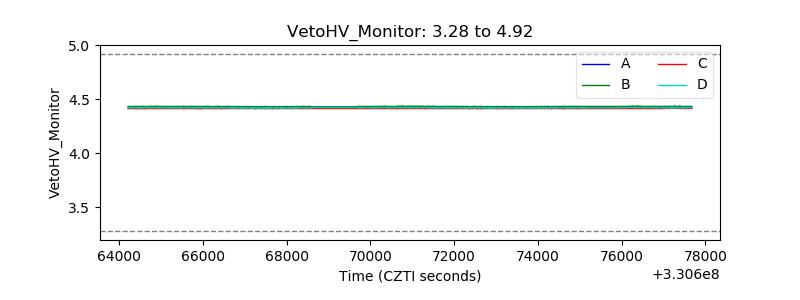 |
| Veto LLD | 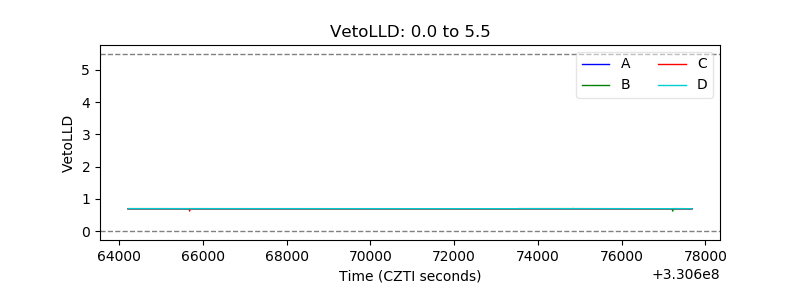 |
| Alpha Counter | 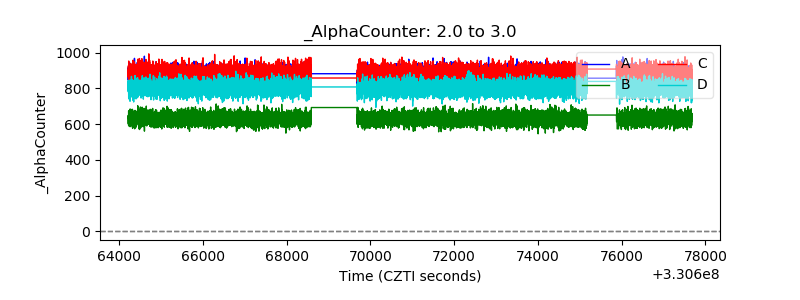 |
| _CPM_Rate | 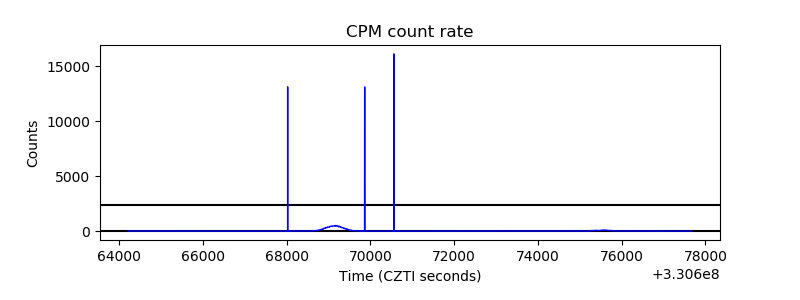 |
| CZT Counter | 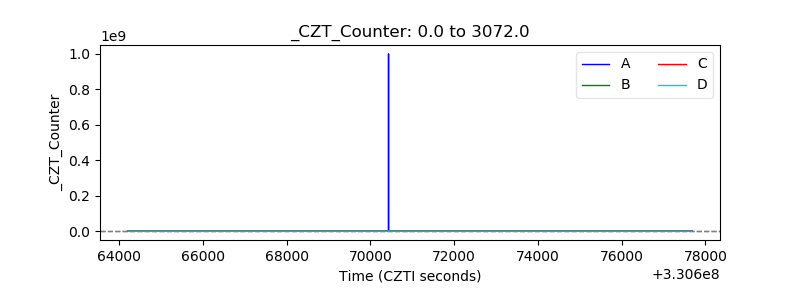 |
| +2.5 Volts monitor |  |
| +5 Volts monitor |  |
| _ROLL_ROT | 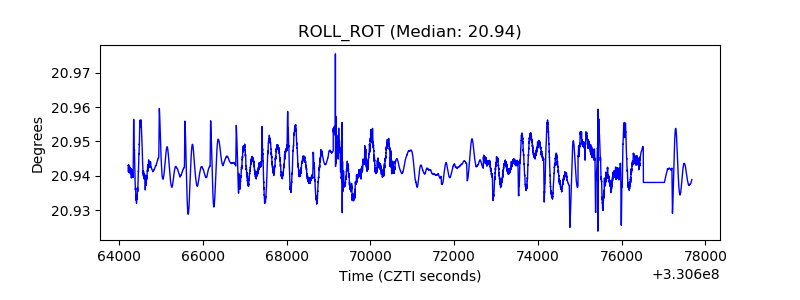 |
| _Roll_DEC |  |
| _Roll_RA | 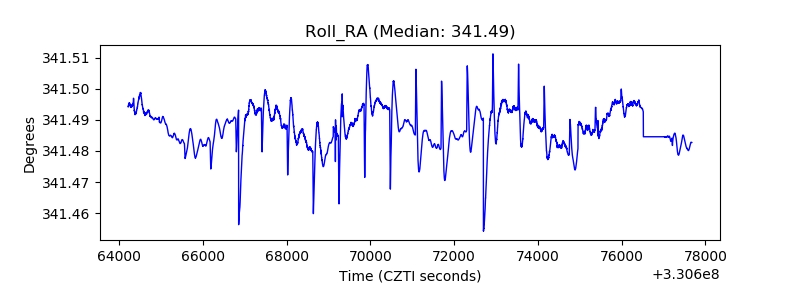 |
| Veto Counter | 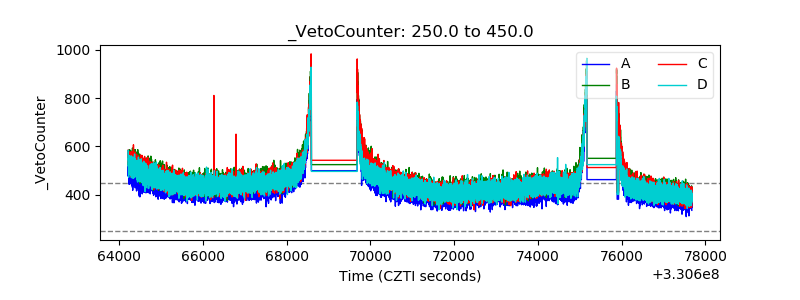 |