| Param | Original file | Final file |
|---|---|---|
| Filename | modeM0/AS1A07_127T03_9000003732_25624cztM0_level2.evt | modeM0/AS1A07_127T03_9000003732_25624cztM0_level2_quad_clean.evt |
| Size (bytes) | 516,136,320 | 83,839,680 |
| Size | 492.2 MB | 80.0 MB |
| Events in quadrant A | 3,550,713 | 524,353 |
| Events in quadrant B | 3,207,234 | 538,485 |
| Events in quadrant C | 3,175,965 | 512,415 |
| Events in quadrant D | 5,249,187 | 503,153 |
| Mode M9 | |||
|---|---|---|---|
| Quadrant | BADHDUFLAG | Total packets | Discarded packets |
| A | 0 | 3 | 0 |
| B | 0 | 3 | 0 |
| C | 0 | 3 | 0 |
| D | 0 | 3 | 0 |
| Mode M0 | |||
|---|---|---|---|
| Quadrant | BADHDUFLAG | Total packets | Discarded packets |
| A | 0 | 14754 | 0 |
| B | 0 | 13599 | 0 |
| C | 0 | 13558 | 0 |
| D | 0 | 19968 | 0 |
| Quadrant | Total seconds | Saturated seconds | Saturation percentage |
|---|---|---|---|
| A | 6597 | 190 | 2.880097% |
| B | 6597 | 181 | 2.743671% |
| C | 6597 | 196 | 2.971047% |
| D | 6597 | 766 | 11.611338% |
Noise dominated data is calculated using 1-second bins in cleaned event files. If a bin has >2000 counts, and if more than 50% of those come from <1% of pixels, then it is considered to be noise-dominated and hence unusable.
| Quadrant | # 1 sec bins | Bins with >0 counts | Bins with >2000 counts | High rate bins dominated by noise | Noise dominated (total time) | Noise dominated (detector-on time) | Marked lightcurve |
|---|---|---|---|---|---|---|---|
| A | 6892 | 6598 | 2 | 2 | 0.03% | 0.03% | 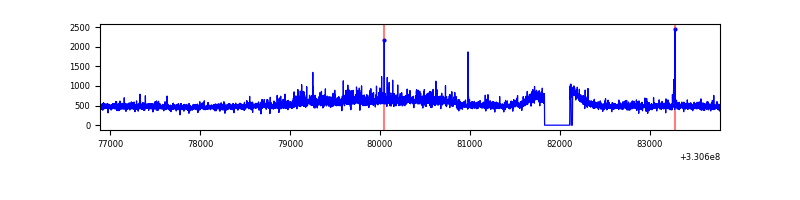 |
| B | 6892 | 6599 | 0 | 0 | 0.00% | 0.00% | 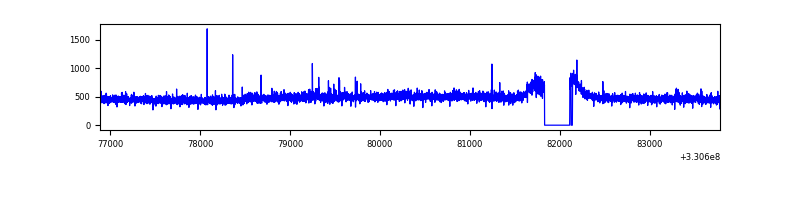 |
| C | 6892 | 6599 | 0 | 0 | 0.00% | 0.00% | 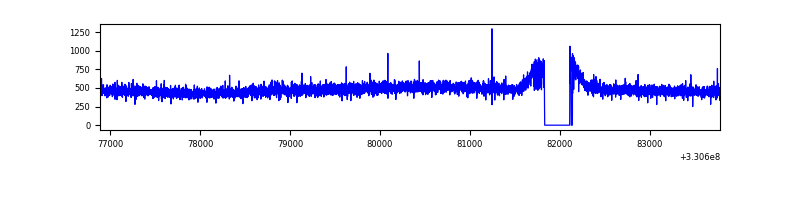 |
| D | 6892 | 6599 | 539 | 539 | 7.82% | 8.17% | 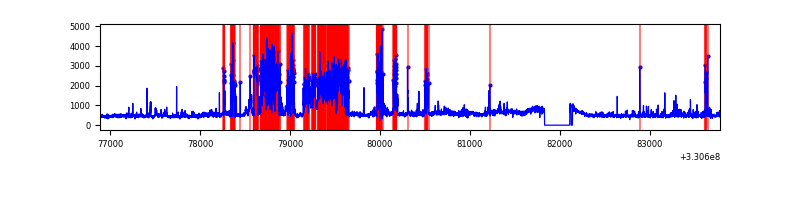 |
Top three noisy pixels from each quadrant. If the there are fewer than three noisy pixels in the level2.evt file, extra rows are filled as -1
| Pixel properties | Quadrant properties | ||||||
|---|---|---|---|---|---|---|---|
| Quadrant | DetID | PixID | Counts | Sigma | Mean | Median | Sigma |
| A | 8 | 192 | 340077 | 2061.8 | 816 | 797 | 164.6 |
| A | 6 | 16 | 31487 | 186.5 | 816 | 797 | 164.6 |
| A | 4 | 2 | 15603 | 89.98 | 816 | 797 | 164.6 |
| B | 12 | 111 | 19327 | 117.56 | 810 | 788 | 157.7 |
| B | 11 | 111 | 17963 | 108.91 | 810 | 788 | 157.7 |
| B | 14 | 111 | 15915 | 95.92 | 810 | 788 | 157.7 |
| C | 14 | 238 | 123179 | 661.83 | 781 | 785 | 184.9 |
| C | 3 | 233 | 8480 | 41.61 | 781 | 785 | 184.9 |
| C | 13 | 61 | 5325 | 24.55 | 781 | 785 | 184.9 |
| D | 1 | 52 | 2036116 | 10359.55 | 766 | 747 | 196.5 |
| D | 8 | 195 | 181708 | 921.05 | 766 | 747 | 196.5 |
| D | 2 | 244 | 117326 | 593.36 | 766 | 747 | 196.5 |
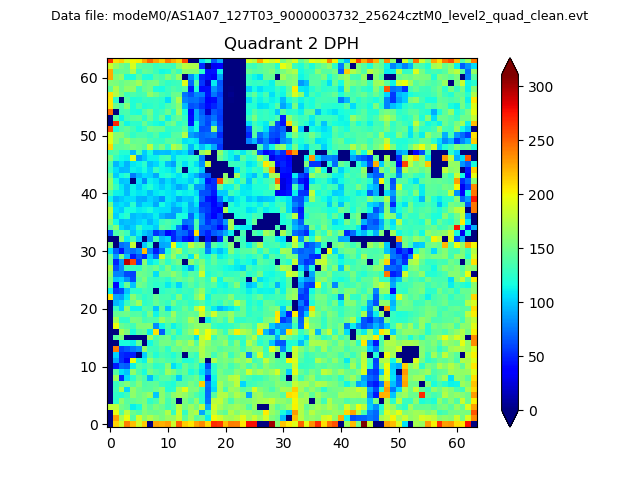
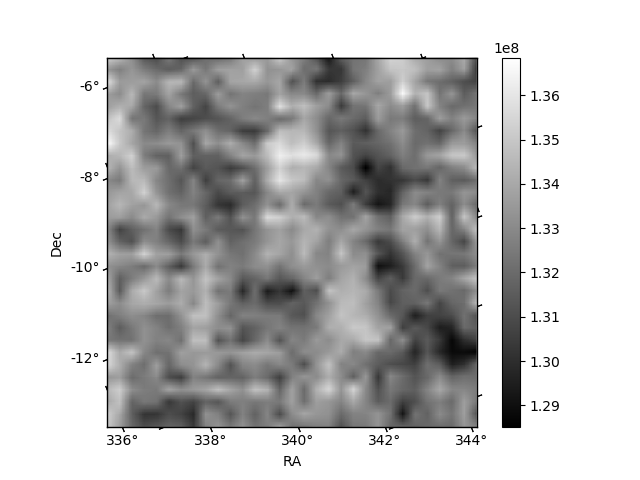
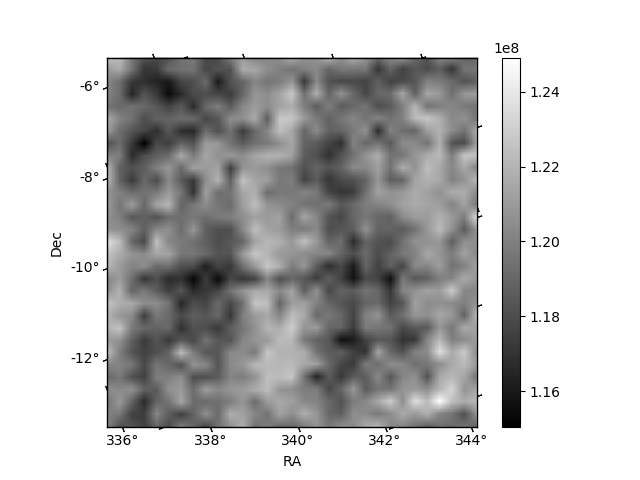
Histogram calculated using DETX and DETY for each event in the final _common_clean file
| Quadrant A | 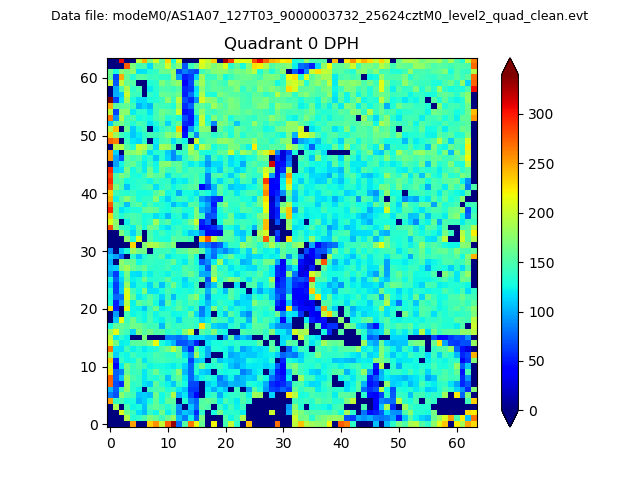 |
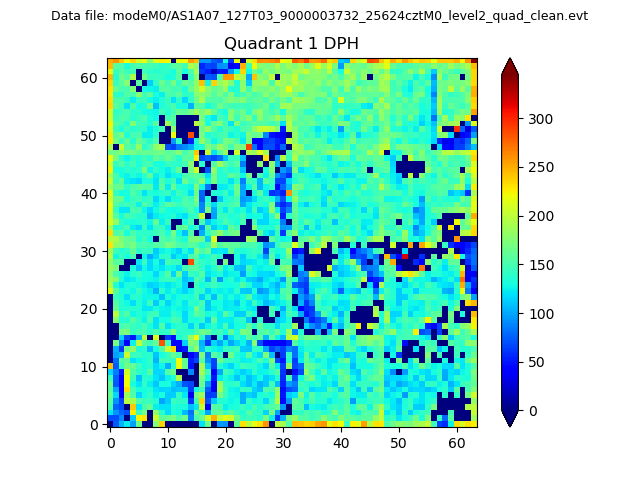 |
Quadrant B |
|---|---|---|---|
| Quadrant D | 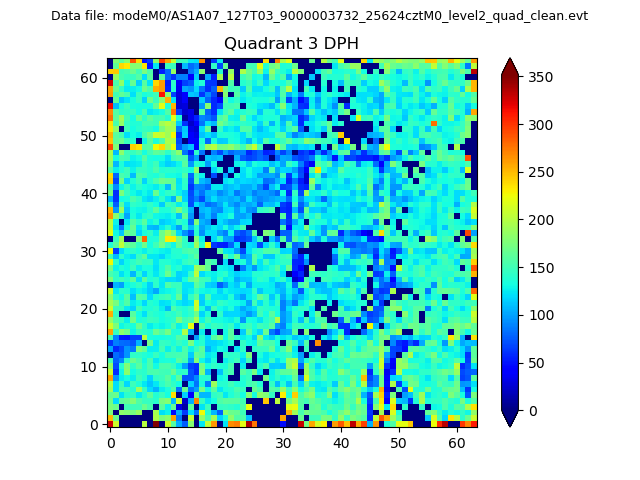 |
 |
Quadrant C |
| Plot type | Count rate plots | Images |
|---|---|---|
| Comparison with Poisson distribution Blue bars denote a histogram of data divided into 1 sec bins. Red curve is a Poisson curve with rate = median count rate of data. |
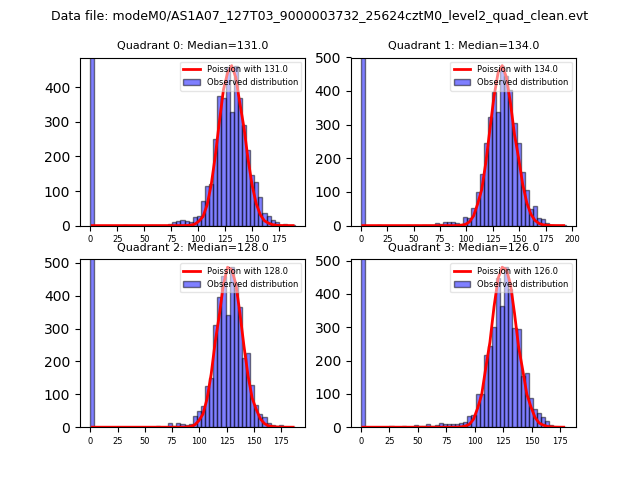 |
 |
| Quadrant-wise count rates Data is divided into 100 sec bins |
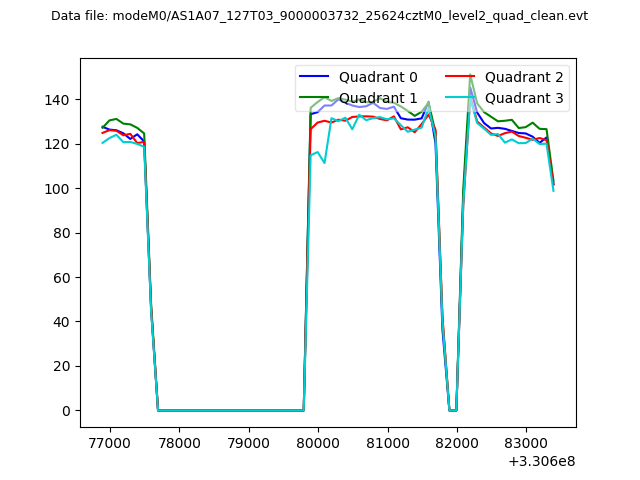 |
|
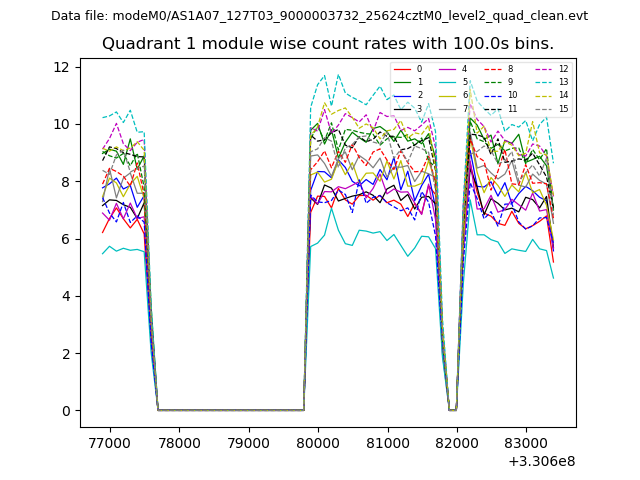
| Module-wise count rates for Quadrant A Data is divided into 100 sec bins |
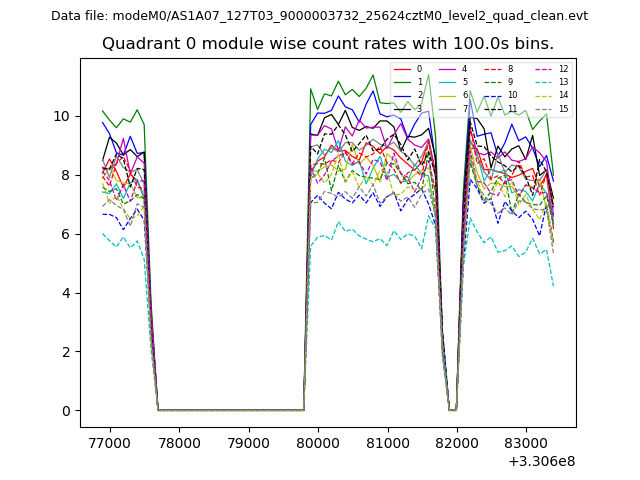 |
 |
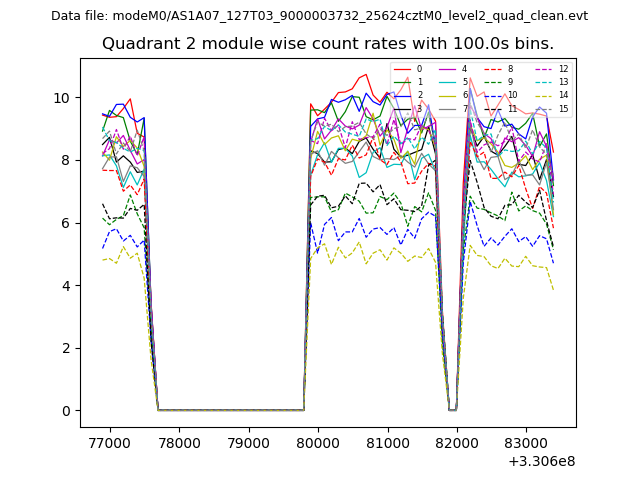
| Module-wise count rates for Quadrant B Data is divided into 100 sec bins |
 |
 |
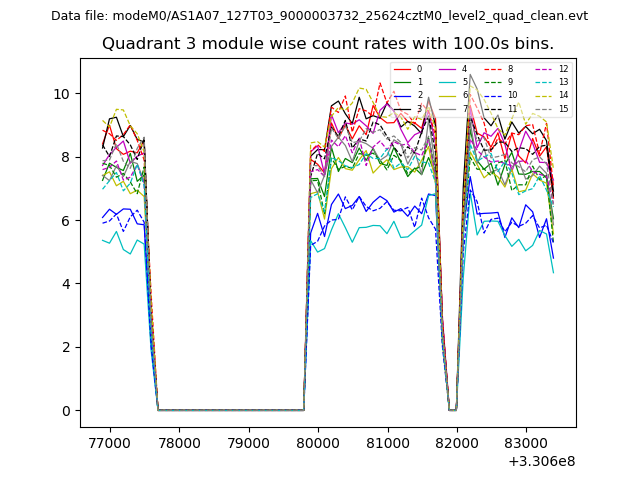
| Module-wise count rates for Quadrant C Data is divided into 100 sec bins |
 |
 |
| Module-wise count rates for Quadrant D Data is divided into 100 sec bins |
 |
 |
| Parameter | Plot |
|---|---|
| CZT HV Monitor | 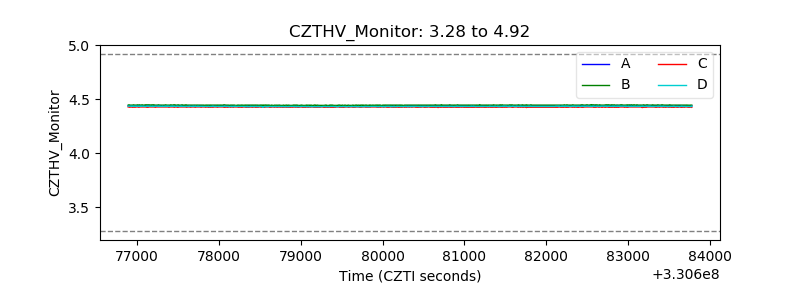 |
| D_VDD | 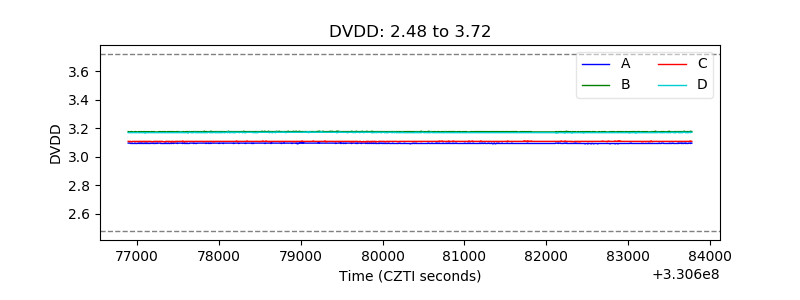 |
| Temperature 1 | 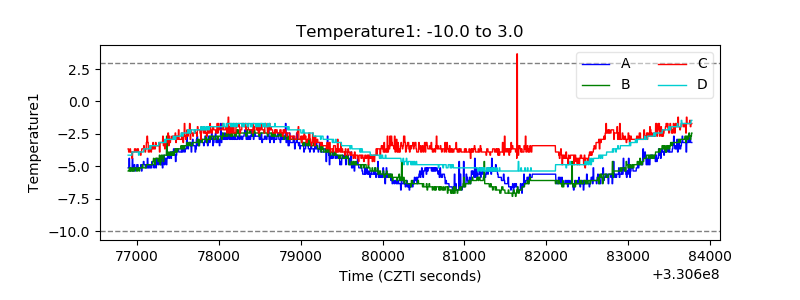 |
| Veto HV Monitor |  |
| Veto LLD | 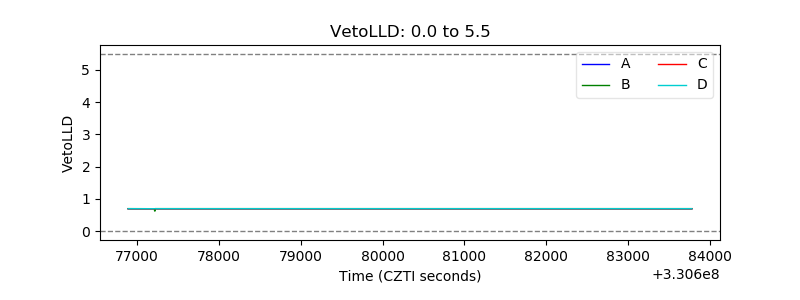 |
| Alpha Counter | 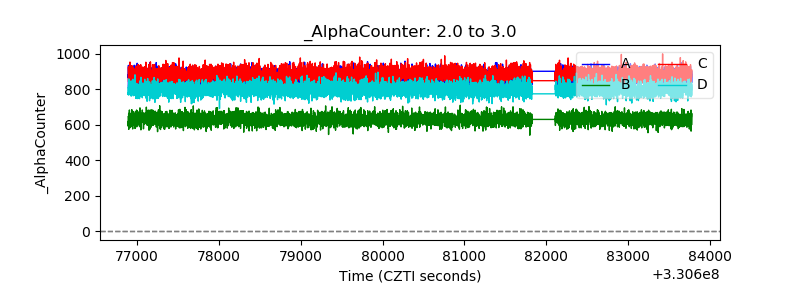 |
| _CPM_Rate | 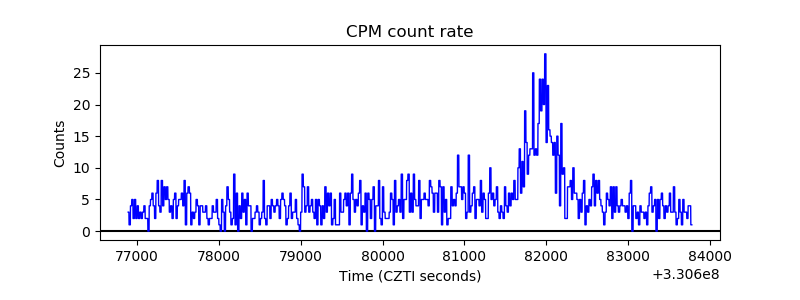 |
| CZT Counter | 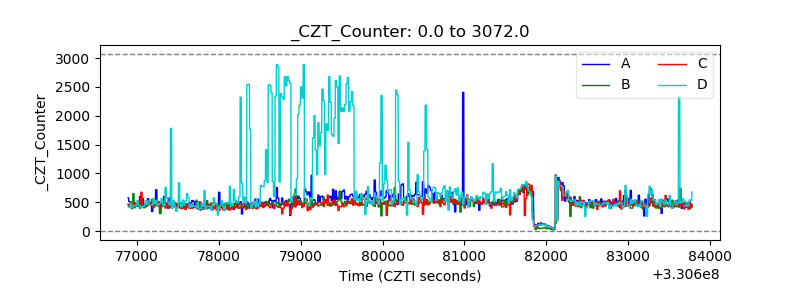 |
| +2.5 Volts monitor |  |
| +5 Volts monitor |  |
| _ROLL_ROT | 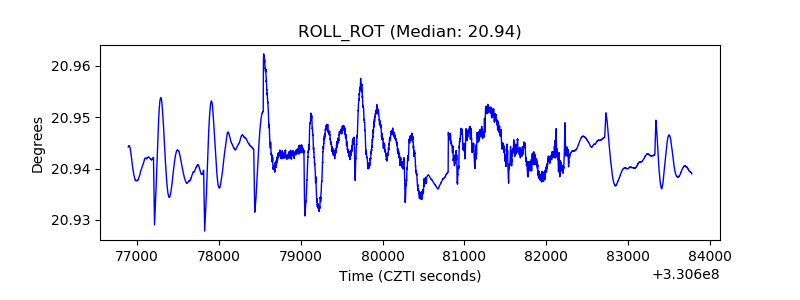 |
| _Roll_DEC | 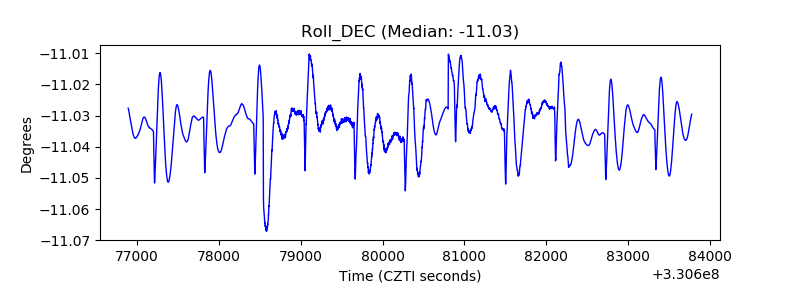 |
| _Roll_RA | 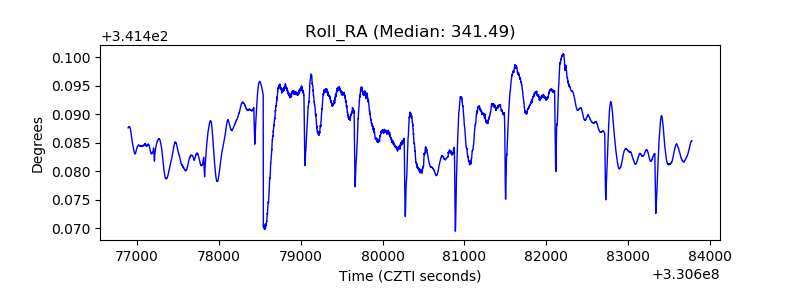 |
| Veto Counter | 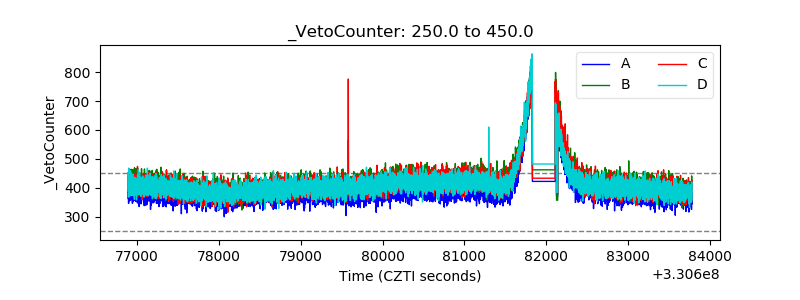 |