| Param | Original file | Final file |
|---|---|---|
| Filename | modeM0/AS1A07_127T03_9000003732_25625cztM0_level2.evt | modeM0/AS1A07_127T03_9000003732_25625cztM0_level2_quad_clean.evt |
| Size (bytes) | 516,755,520 | 91,267,200 |
| Size | 492.8 MB | 87.0 MB |
| Events in quadrant A | 3,800,465 | 567,291 |
| Events in quadrant B | 3,631,681 | 580,554 |
| Events in quadrant C | 3,591,954 | 554,479 |
| Events in quadrant D | 4,126,179 | 549,064 |
| Mode M9 | |||
|---|---|---|---|
| Quadrant | BADHDUFLAG | Total packets | Discarded packets |
| A | 0 | 1 | 0 |
| B | 0 | 1 | 0 |
| C | 0 | 1 | 0 |
| D | 0 | 1 | 0 |
| Mode M0 | |||
|---|---|---|---|
| Quadrant | BADHDUFLAG | Total packets | Discarded packets |
| A | 0 | 15616 | 0 |
| B | 0 | 15365 | 0 |
| C | 0 | 15279 | 0 |
| D | 0 | 16912 | 0 |
| Quadrant | Total seconds | Saturated seconds | Saturation percentage |
|---|---|---|---|
| A | 7359 | 262 | 3.560266% |
| B | 7360 | 265 | 3.600543% |
| C | 7360 | 268 | 3.641304% |
| D | 7360 | 235 | 3.192935% |
Noise dominated data is calculated using 1-second bins in cleaned event files. If a bin has >2000 counts, and if more than 50% of those come from <1% of pixels, then it is considered to be noise-dominated and hence unusable.
| Quadrant | # 1 sec bins | Bins with >0 counts | Bins with >2000 counts | High rate bins dominated by noise | Noise dominated (total time) | Noise dominated (detector-on time) | Marked lightcurve |
|---|---|---|---|---|---|---|---|
| A | 7449 | 7361 | 1 | 1 | 0.01% | 0.01% | 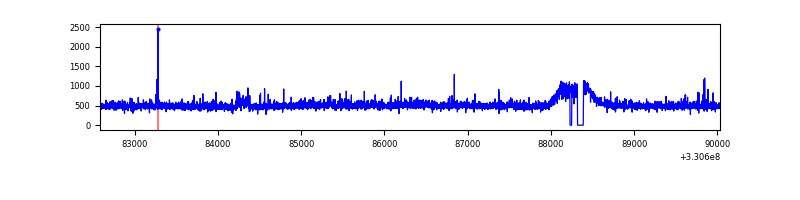 |
| B | 7450 | 7362 | 1 | 1 | 0.01% | 0.01% | 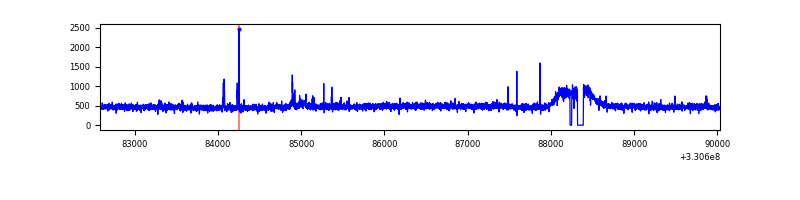 |
| C | 7450 | 7362 | 0 | 0 | 0.00% | 0.00% | 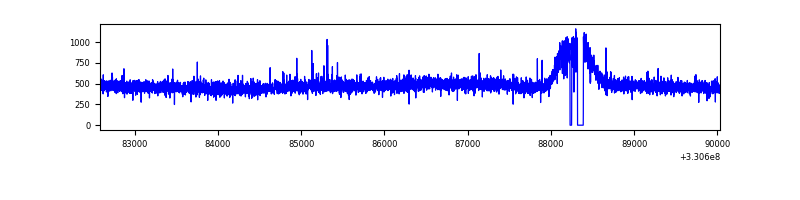 |
| D | 7450 | 7362 | 17 | 17 | 0.23% | 0.23% | 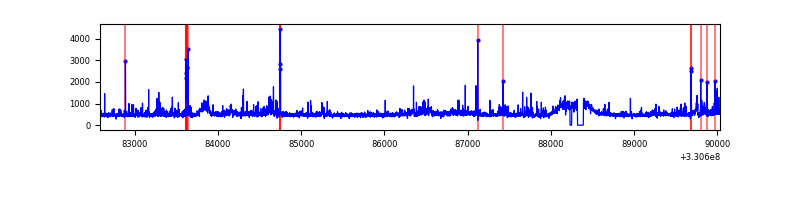 |
Top three noisy pixels from each quadrant. If the there are fewer than three noisy pixels in the level2.evt file, extra rows are filled as -1
| Pixel properties | Quadrant properties | ||||||
|---|---|---|---|---|---|---|---|
| Quadrant | DetID | PixID | Counts | Sigma | Mean | Median | Sigma |
| A | 8 | 192 | 171450 | 917.51 | 920 | 900 | 185.9 |
| A | 6 | 16 | 33779 | 176.88 | 920 | 900 | 185.9 |
| A | 3 | 1 | 22507 | 116.24 | 920 | 900 | 185.9 |
| B | 0 | 190 | 47383 | 262.26 | 909 | 884 | 177.3 |
| B | 12 | 111 | 22218 | 120.33 | 909 | 884 | 177.3 |
| B | 11 | 111 | 20136 | 108.58 | 909 | 884 | 177.3 |
| C | 14 | 238 | 139219 | 661.05 | 882 | 886 | 209.3 |
| C | 2 | 16 | 14221 | 63.72 | 882 | 886 | 209.3 |
| C | 13 | 61 | 6143 | 25.12 | 882 | 886 | 209.3 |
| D | 1 | 52 | 374560 | 1634.03 | 896 | 873 | 228.7 |
| D | 8 | 195 | 175267 | 762.58 | 896 | 873 | 228.7 |
| D | 2 | 244 | 165156 | 718.37 | 896 | 873 | 228.7 |
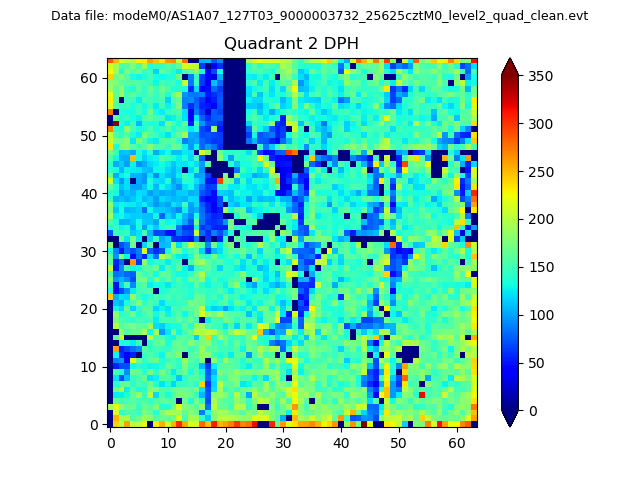
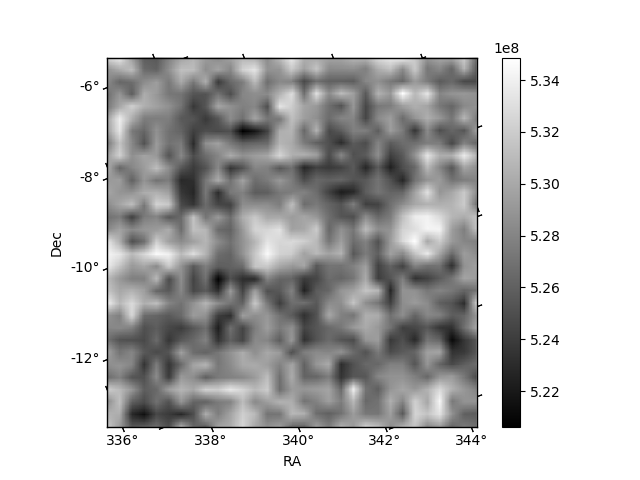
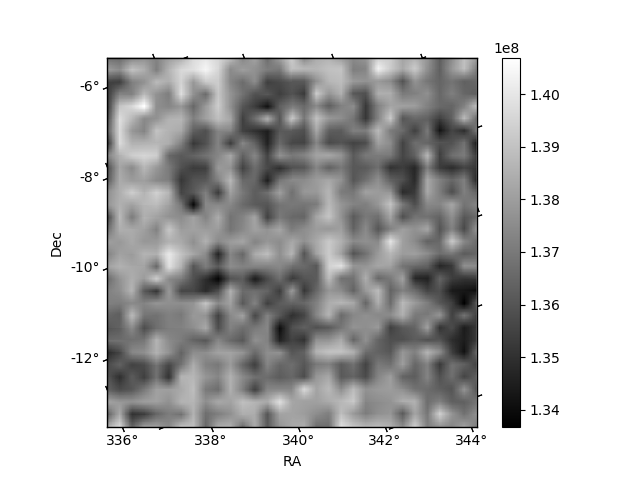
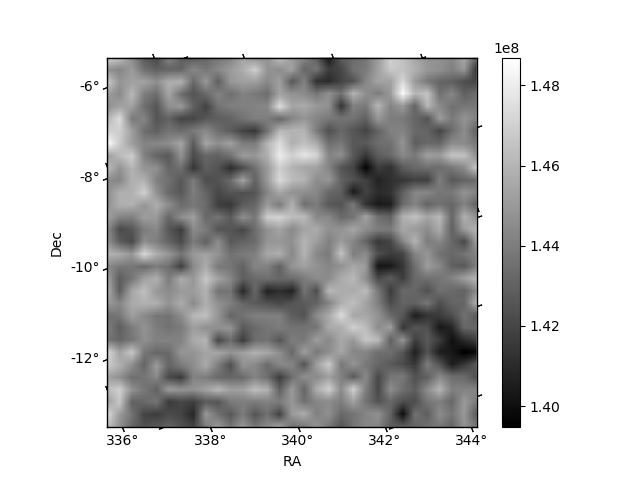
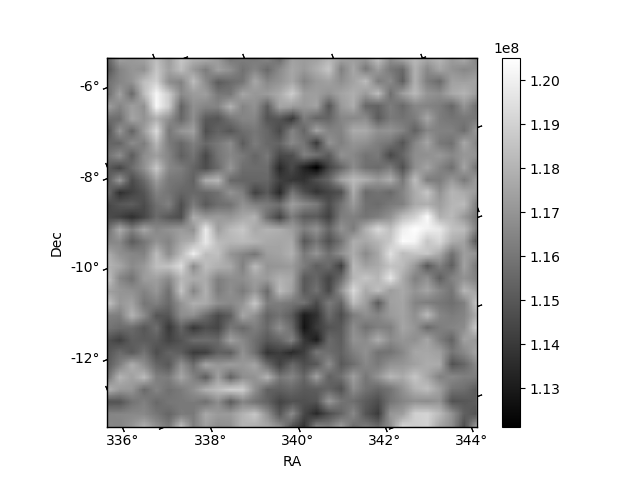
Histogram calculated using DETX and DETY for each event in the final _common_clean file
| Quadrant A | 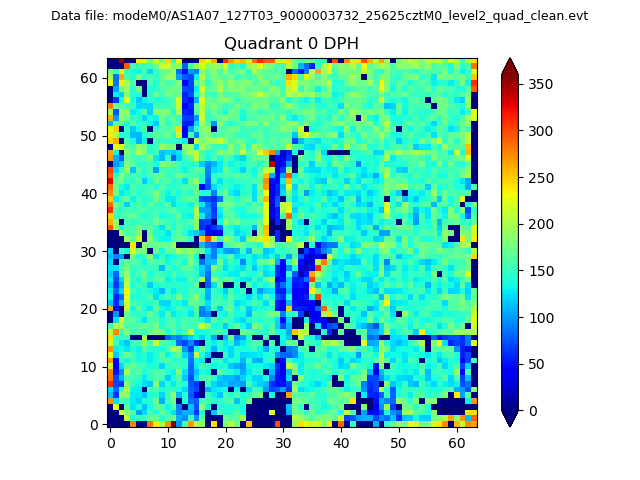 |
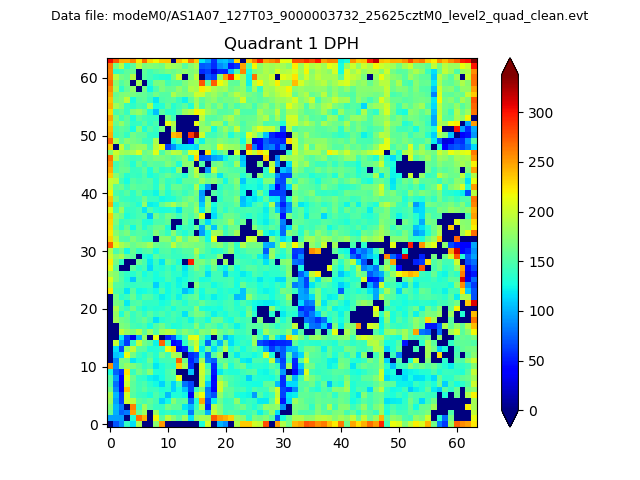 |
Quadrant B |
|---|---|---|---|
| Quadrant D | 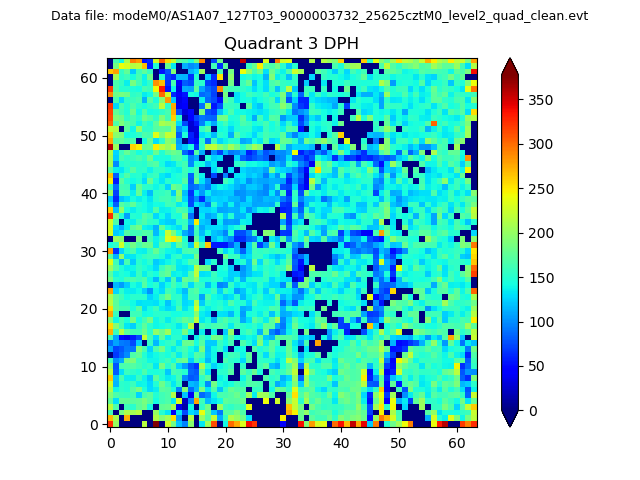 |
 |
Quadrant C |
| Plot type | Count rate plots | Images |
|---|---|---|
| Comparison with Poisson distribution Blue bars denote a histogram of data divided into 1 sec bins. Red curve is a Poisson curve with rate = median count rate of data. |
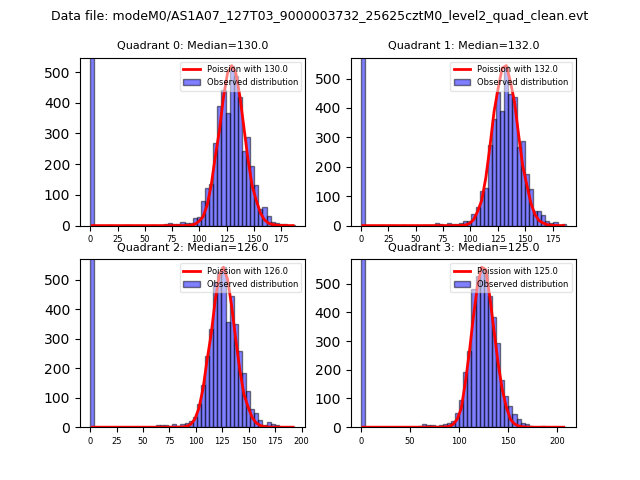 |
 |
| Quadrant-wise count rates Data is divided into 100 sec bins |
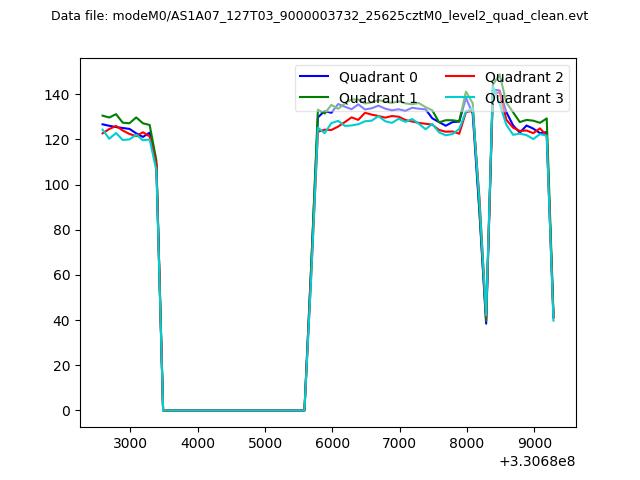 |
|
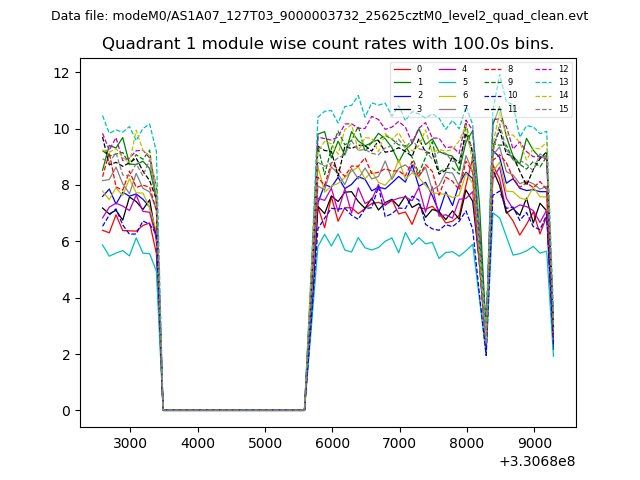
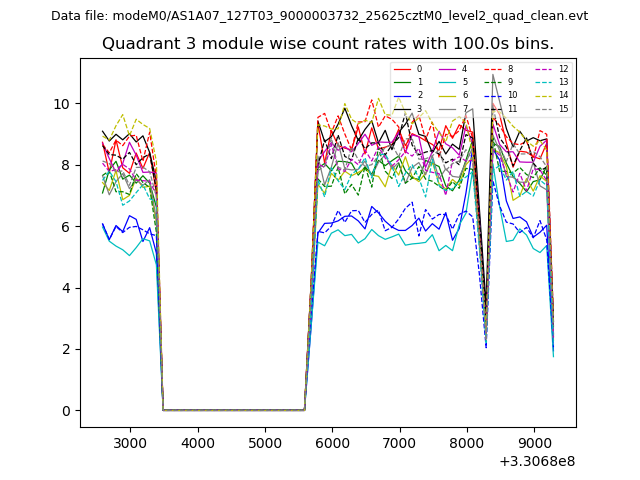
| Module-wise count rates for Quadrant A Data is divided into 100 sec bins |
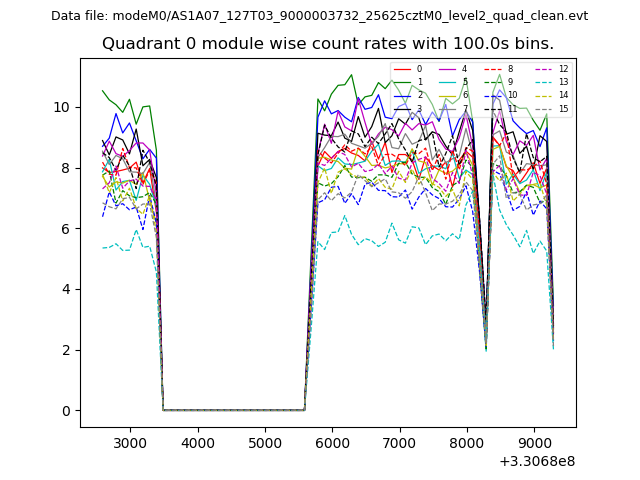 |
 |
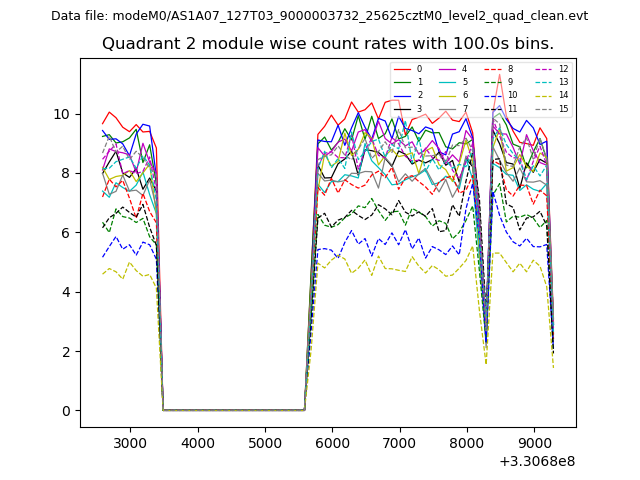
| Module-wise count rates for Quadrant B Data is divided into 100 sec bins |
 |
 |
| Module-wise count rates for Quadrant C Data is divided into 100 sec bins |
 |
 |
| Module-wise count rates for Quadrant D Data is divided into 100 sec bins |
 |
 |
| Parameter | Plot |
|---|---|
| CZT HV Monitor | 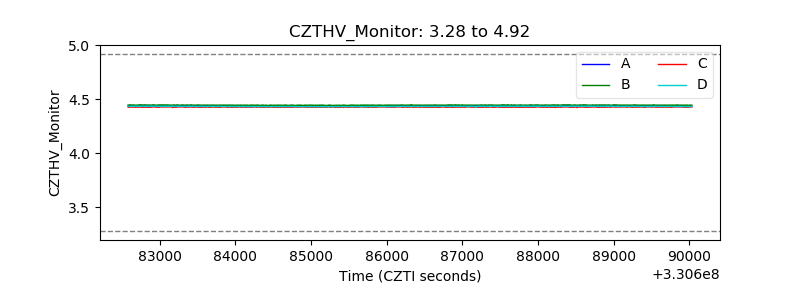 |
| D_VDD | 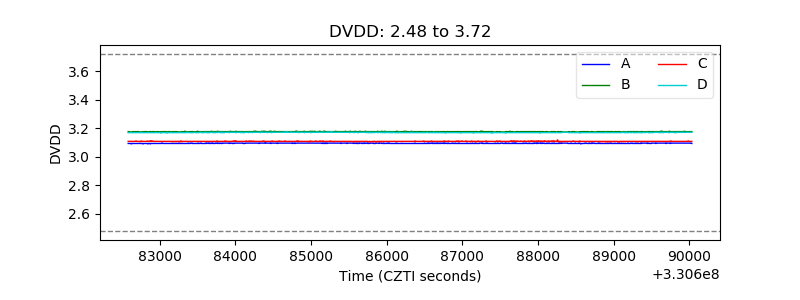 |
| Temperature 1 | 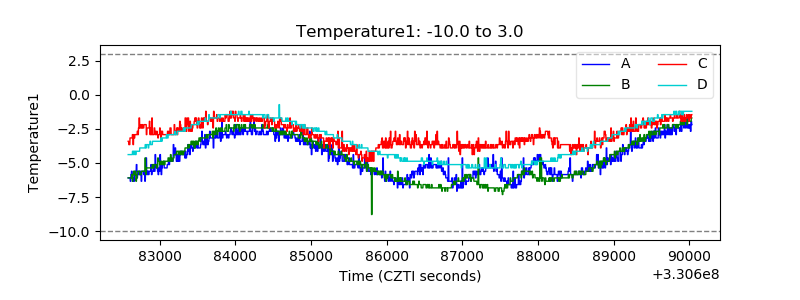 |
| Veto HV Monitor | 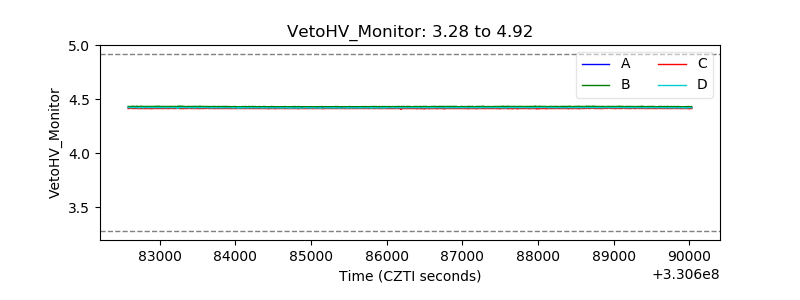 |
| Veto LLD | 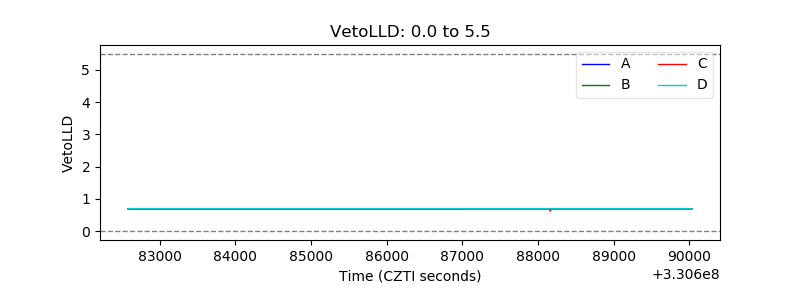 |
| Alpha Counter | 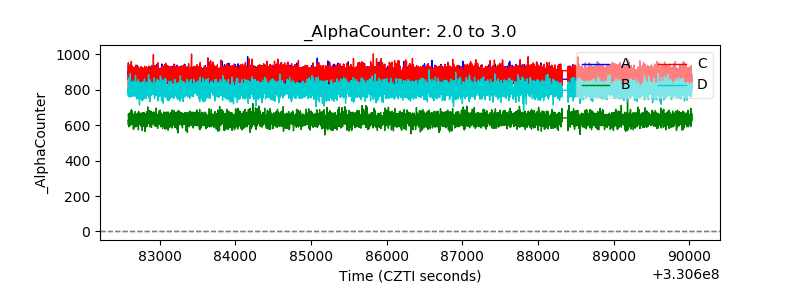 |
| _CPM_Rate | 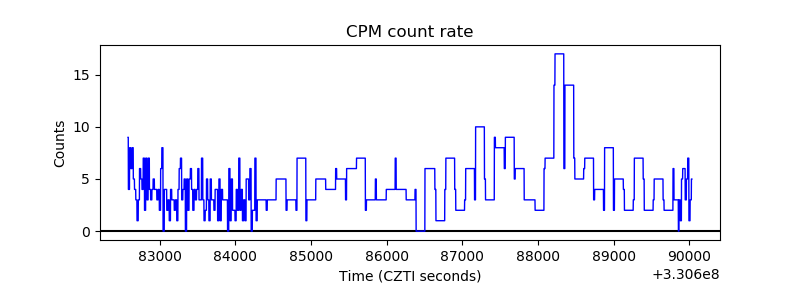 |
| CZT Counter | 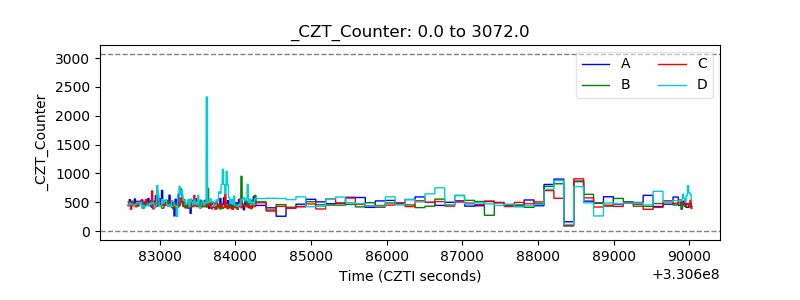 |
| +2.5 Volts monitor |  |
| +5 Volts monitor | 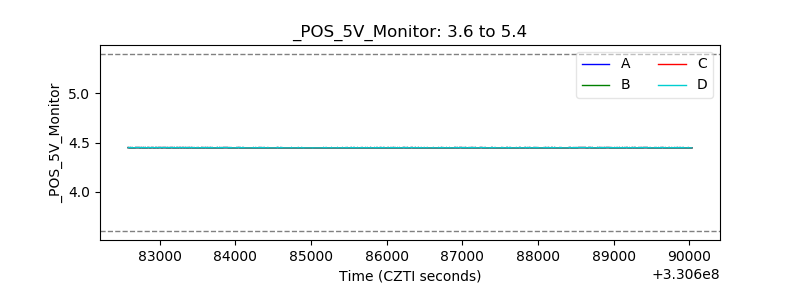 |
| _ROLL_ROT | 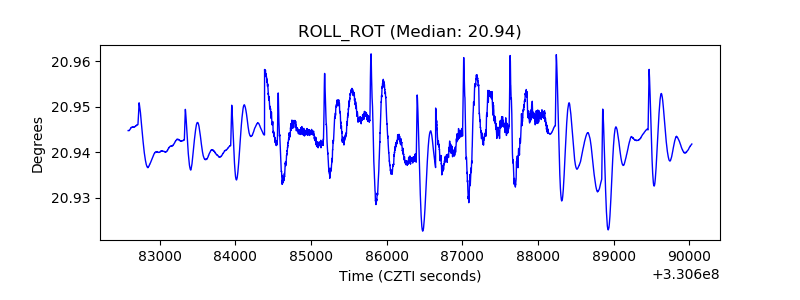 |
| _Roll_DEC | 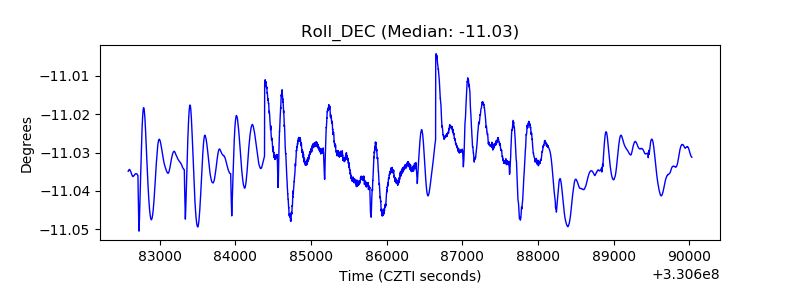 |
| _Roll_RA | 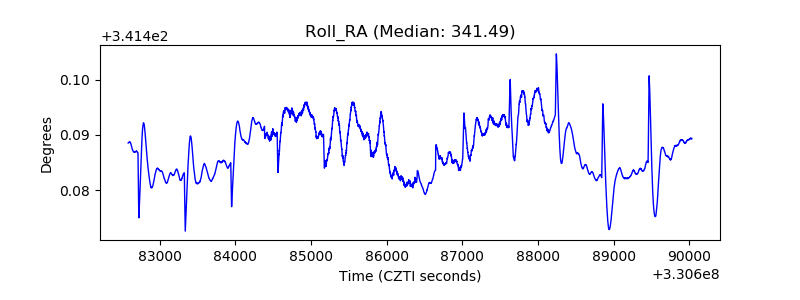 |
| Veto Counter | 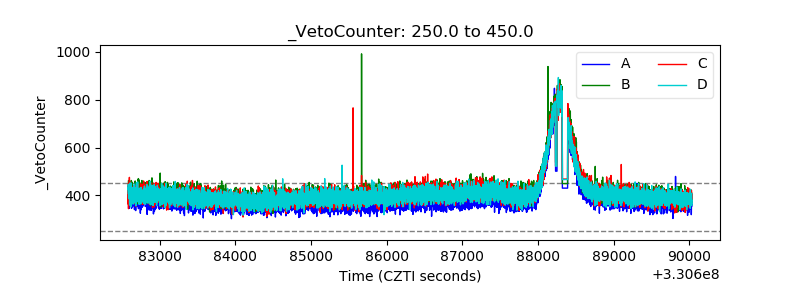 |