| Param | Original file | Final file |
|---|---|---|
| Filename | modeM0/AS1A07_127T03_9000003732_25626cztM0_level2.evt | modeM0/AS1A07_127T03_9000003732_25626cztM0_level2_quad_clean.evt |
| Size (bytes) | 676,880,640 | 84,948,480 |
| Size | 645.5 MB | 81.0 MB |
| Events in quadrant A | 3,973,942 | 527,296 |
| Events in quadrant B | 3,646,145 | 539,832 |
| Events in quadrant C | 3,581,405 | 513,275 |
| Events in quadrant D | 8,795,680 | 474,873 |
| Mode M9 | |||
|---|---|---|---|
| Quadrant | BADHDUFLAG | Total packets | Discarded packets |
| A | 0 | 4 | 0 |
| B | 0 | 4 | 0 |
| C | 0 | 4 | 0 |
| D | 0 | 4 | 0 |
| Mode M0 | |||
|---|---|---|---|
| Quadrant | BADHDUFLAG | Total packets | Discarded packets |
| A | 0 | 16173 | 0 |
| B | 0 | 15444 | 0 |
| C | 0 | 15305 | 0 |
| D | 0 | 31213 | 0 |
| Quadrant | Total seconds | Saturated seconds | Saturation percentage |
|---|---|---|---|
| A | 7427 | 130 | 1.750370% |
| B | 7428 | 109 | 1.467421% |
| C | 7428 | 113 | 1.521271% |
| D | 7428 | 921 | 12.399031% |
Noise dominated data is calculated using 1-second bins in cleaned event files. If a bin has >2000 counts, and if more than 50% of those come from <1% of pixels, then it is considered to be noise-dominated and hence unusable.
| Quadrant | # 1 sec bins | Bins with >0 counts | Bins with >2000 counts | High rate bins dominated by noise | Noise dominated (total time) | Noise dominated (detector-on time) | Marked lightcurve |
|---|---|---|---|---|---|---|---|
| A | 7822 | 7428 | 23 | 23 | 0.29% | 0.31% | 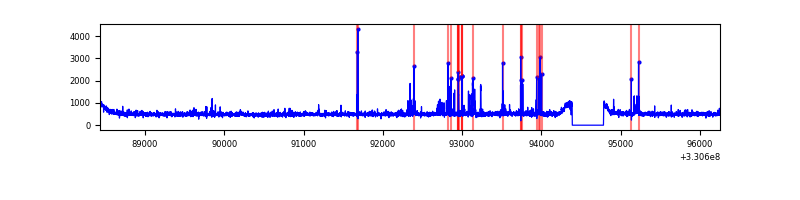 |
| B | 7823 | 7429 | 6 | 6 | 0.08% | 0.08% | 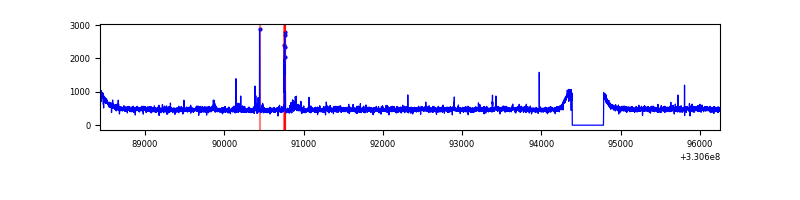 |
| C | 7823 | 7429 | 0 | 0 | 0.00% | 0.00% | 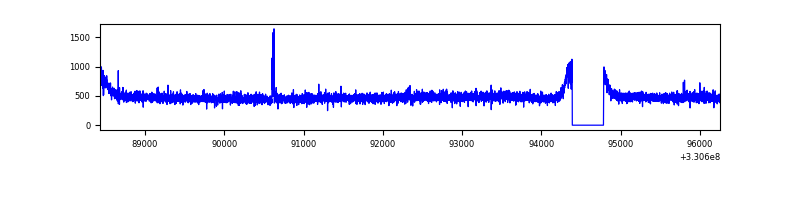 |
| D | 7823 | 7428 | 887 | 887 | 11.34% | 11.94% | 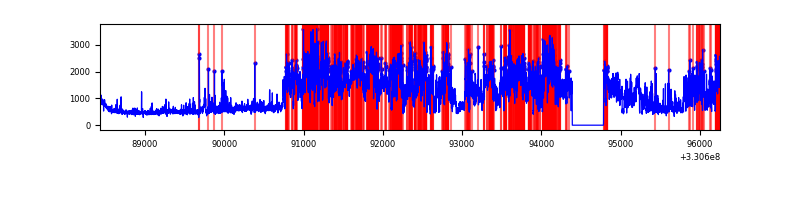 |
Top three noisy pixels from each quadrant. If the there are fewer than three noisy pixels in the level2.evt file, extra rows are filled as -1
| Pixel properties | Quadrant properties | ||||||
|---|---|---|---|---|---|---|---|
| Quadrant | DetID | PixID | Counts | Sigma | Mean | Median | Sigma |
| A | 0 | 13 | 209893 | 1132.54 | 918 | 899 | 184.5 |
| A | 8 | 192 | 170777 | 920.57 | 918 | 899 | 184.5 |
| A | 6 | 16 | 40792 | 216.18 | 918 | 899 | 184.5 |
| B | 15 | 33 | 27993 | 152.82 | 910 | 887 | 177.4 |
| B | 0 | 190 | 25314 | 137.72 | 910 | 887 | 177.4 |
| B | 12 | 111 | 22135 | 119.8 | 910 | 887 | 177.4 |
| C | 14 | 238 | 138841 | 661.33 | 877 | 880 | 208.6 |
| C | 2 | 16 | 23586 | 108.84 | 877 | 880 | 208.6 |
| C | 13 | 61 | 6006 | 24.57 | 877 | 880 | 208.6 |
| D | 13 | 174 | 4588854 | 19629.65 | 862 | 844 | 233.7 |
| D | 1 | 52 | 549065 | 2345.55 | 862 | 844 | 233.7 |
| D | 8 | 195 | 255265 | 1088.53 | 862 | 844 | 233.7 |
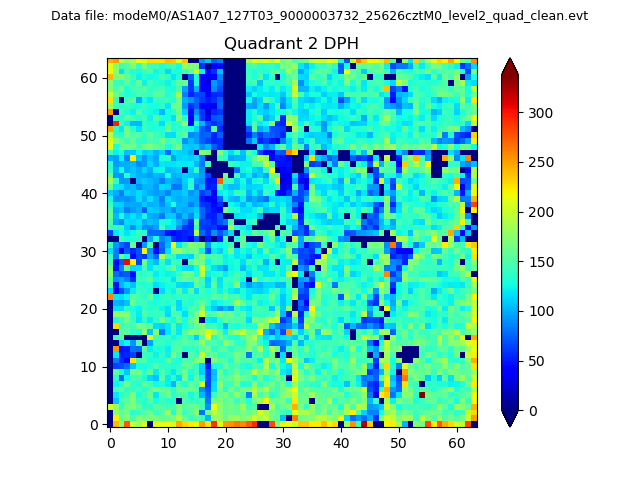
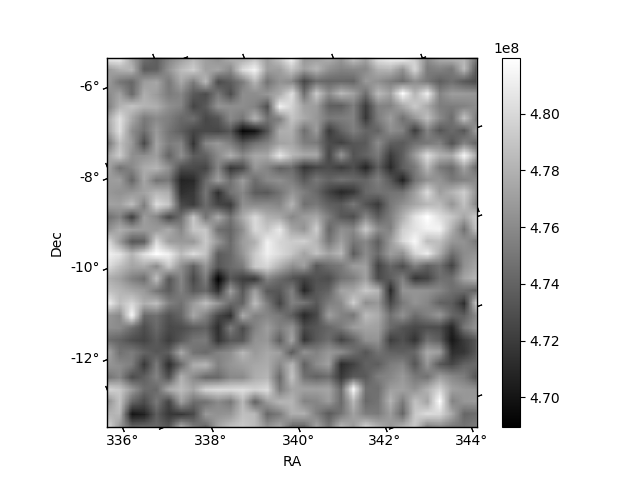
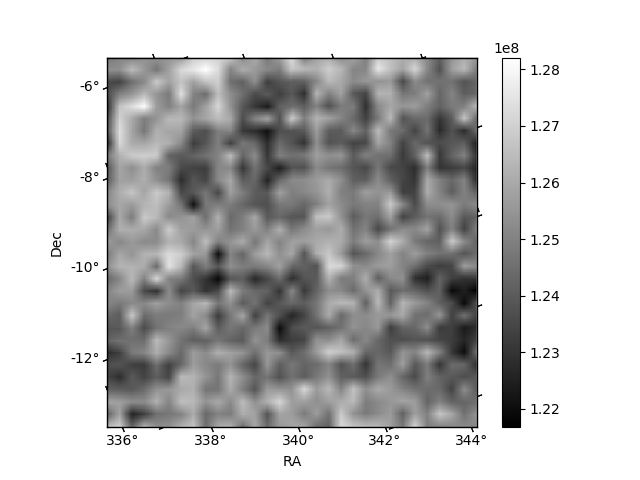
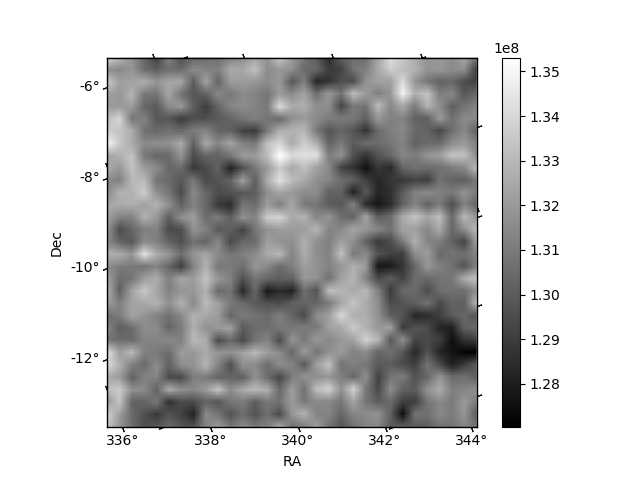
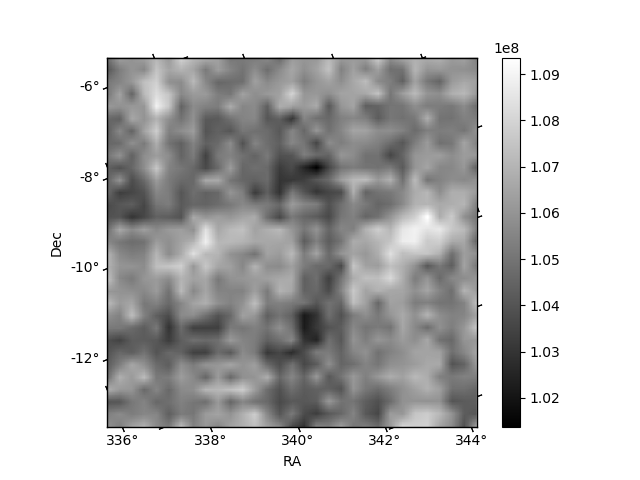
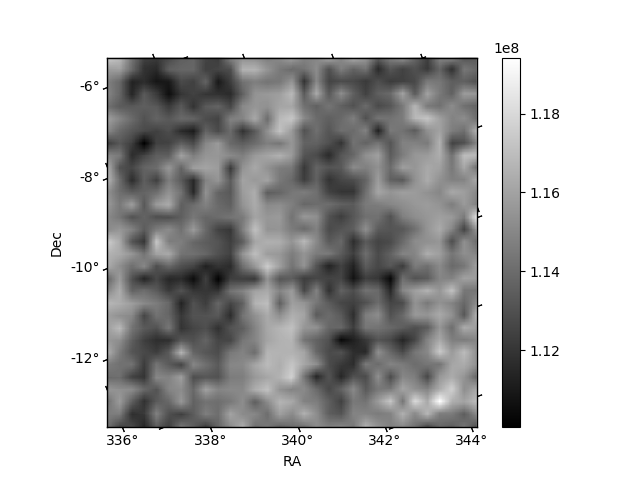
Histogram calculated using DETX and DETY for each event in the final _common_clean file
| Quadrant A | 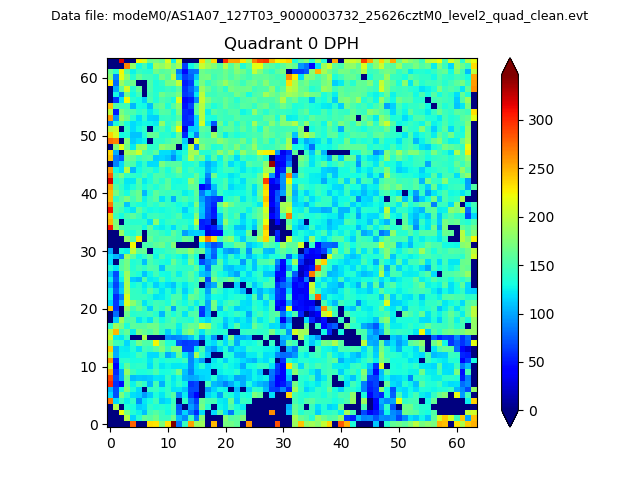 |
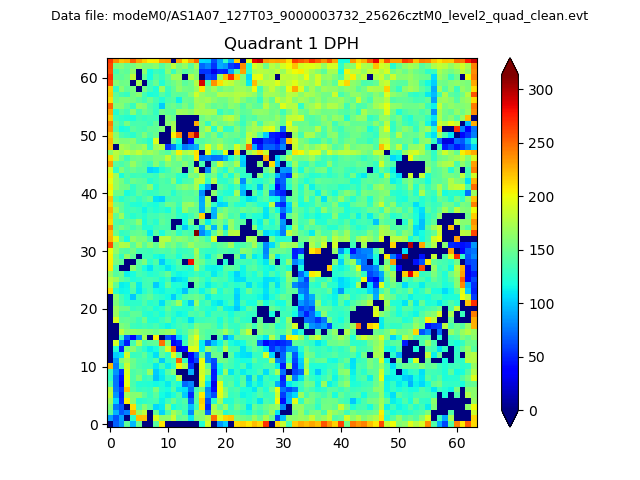 |
Quadrant B |
|---|---|---|---|
| Quadrant D | 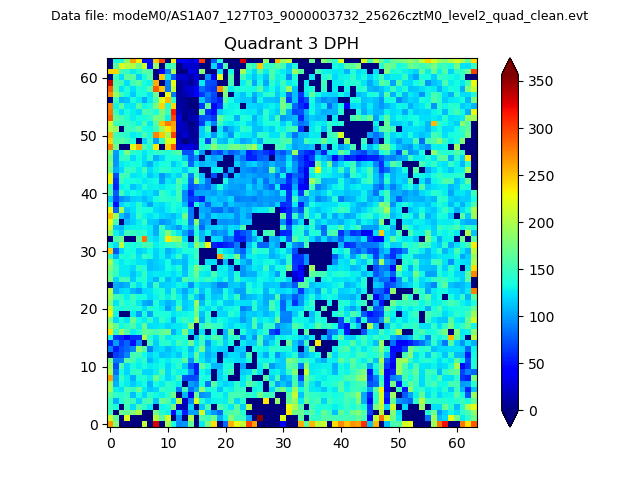 |
 |
Quadrant C |
| Plot type | Count rate plots | Images |
|---|---|---|
| Comparison with Poisson distribution Blue bars denote a histogram of data divided into 1 sec bins. Red curve is a Poisson curve with rate = median count rate of data. |
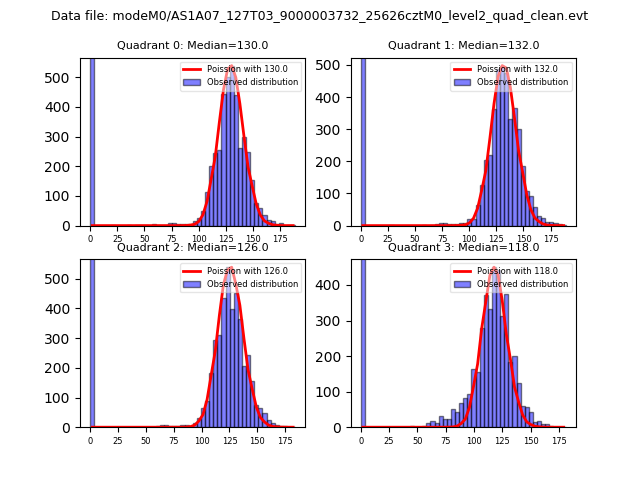 |
 |
| Quadrant-wise count rates Data is divided into 100 sec bins |
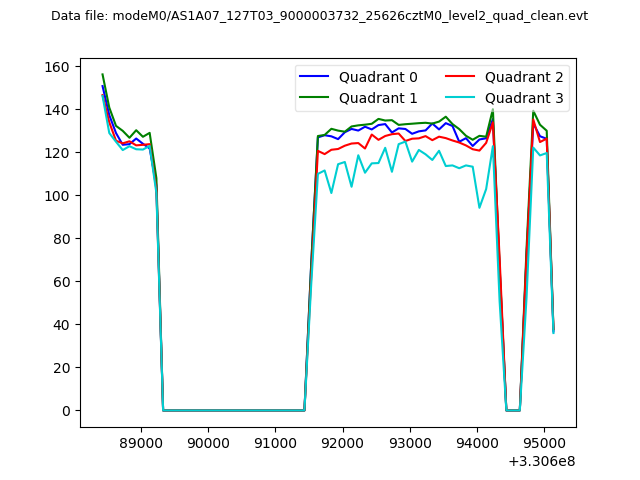 |
|
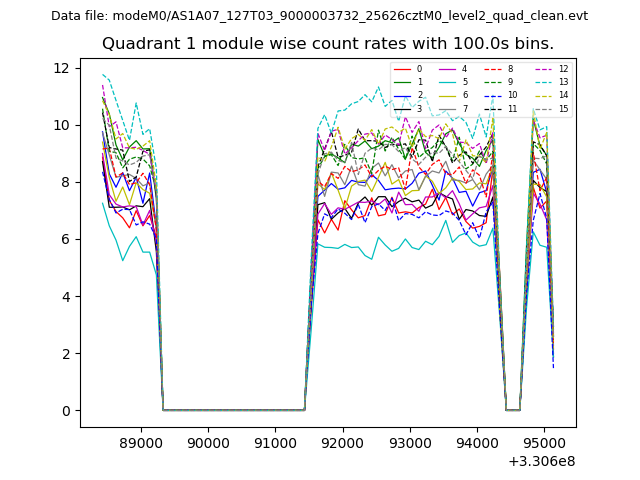
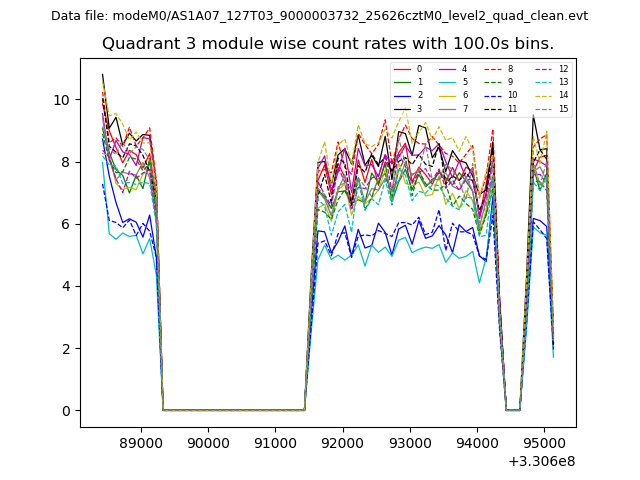
| Module-wise count rates for Quadrant A Data is divided into 100 sec bins |
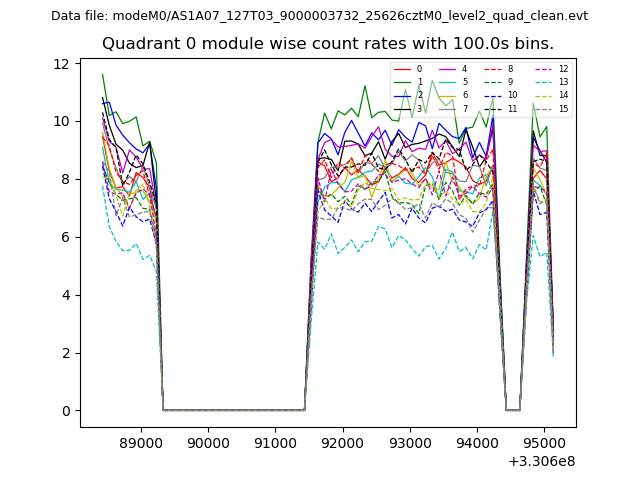 |
 |
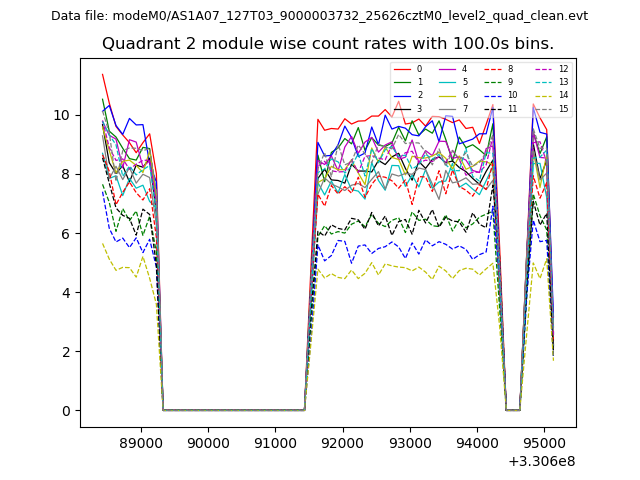
| Module-wise count rates for Quadrant B Data is divided into 100 sec bins |
 |
 |
| Module-wise count rates for Quadrant C Data is divided into 100 sec bins |
 |
 |
| Module-wise count rates for Quadrant D Data is divided into 100 sec bins |
 |
 |
| Parameter | Plot |
|---|---|
| CZT HV Monitor | 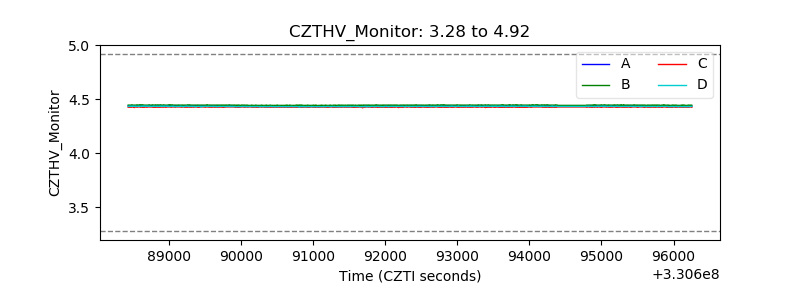 |
| D_VDD | 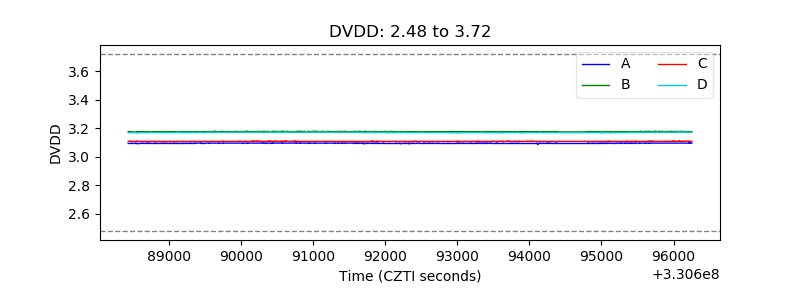 |
| Temperature 1 | 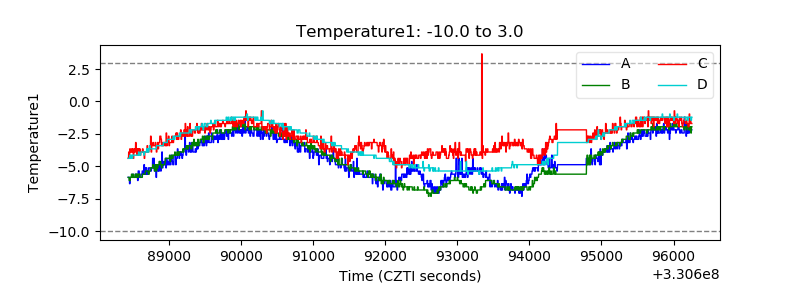 |
| Veto HV Monitor | 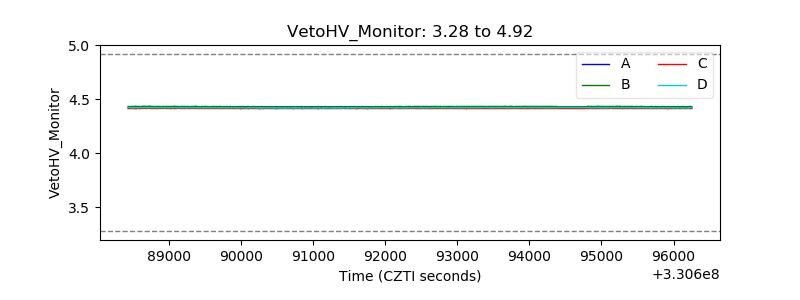 |
| Veto LLD |  |
| Alpha Counter | 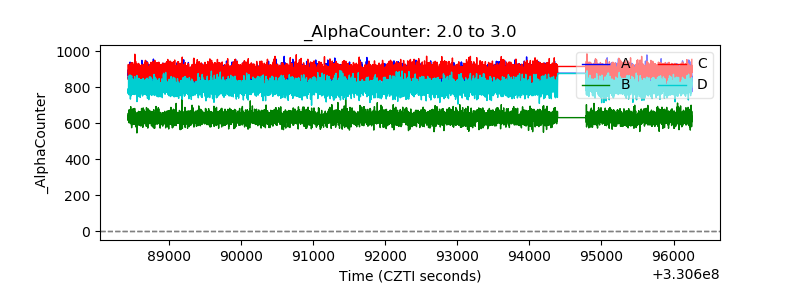 |
| _CPM_Rate | 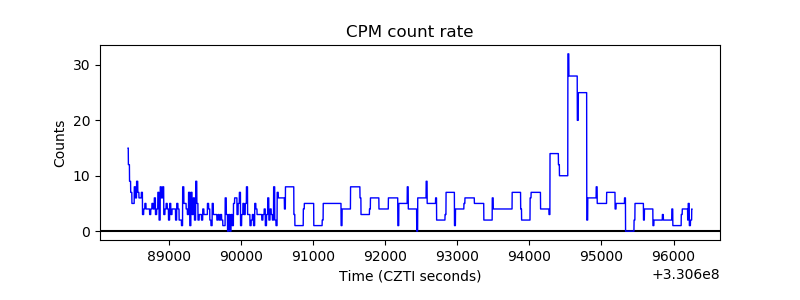 |
| CZT Counter | 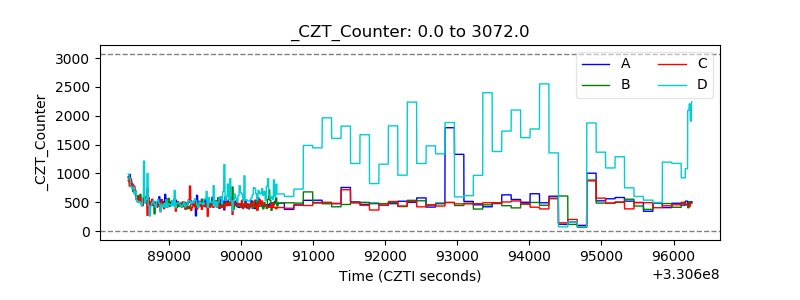 |
| +2.5 Volts monitor |  |
| +5 Volts monitor |  |
| _ROLL_ROT | 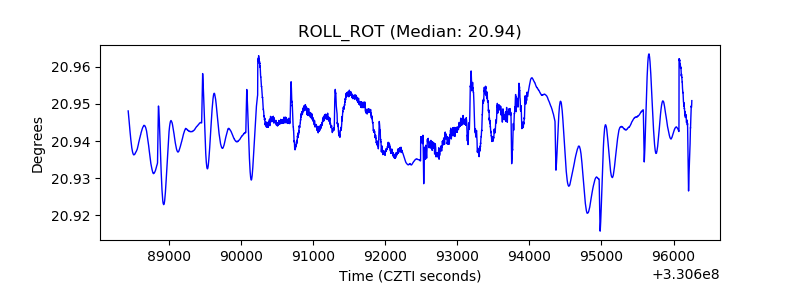 |
| _Roll_DEC | 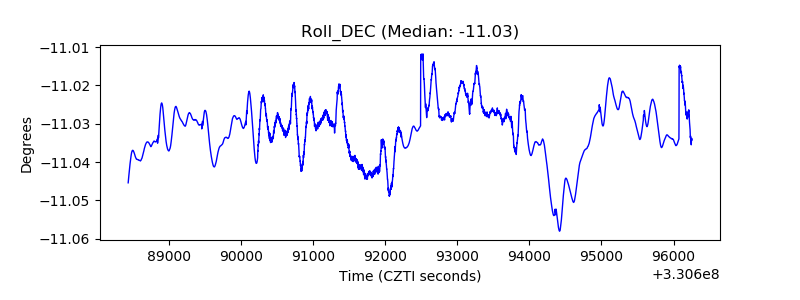 |
| _Roll_RA | 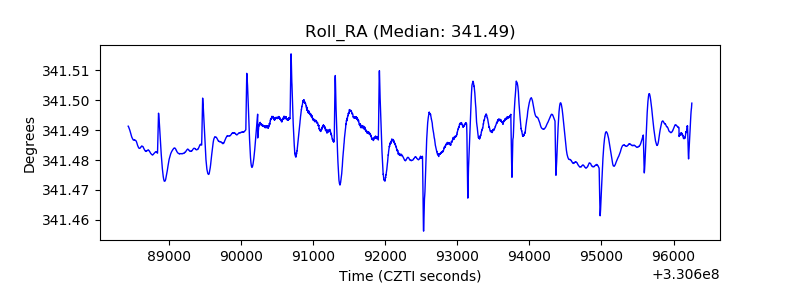 |
| Veto Counter | 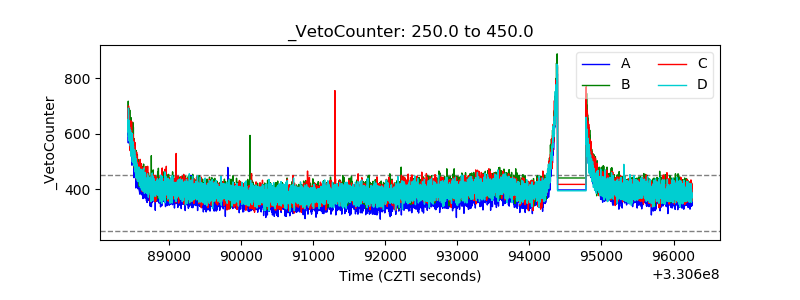 |