| Param | Original file | Final file |
|---|---|---|
| Filename | modeM0/AS1A07_127T03_9000003732_25628cztM0_level2.evt | modeM0/AS1A07_127T03_9000003732_25628cztM0_level2_quad_clean.evt |
| Size (bytes) | 939,372,480 | 129,833,280 |
| Size | 895.9 MB | 123.8 MB |
| Events in quadrant A | 5,567,960 | 820,599 |
| Events in quadrant B | 5,178,407 | 831,008 |
| Events in quadrant C | 5,125,886 | 786,397 |
| Events in quadrant D | 11,845,213 | 743,466 |
| Mode M9 | |||
|---|---|---|---|
| Quadrant | BADHDUFLAG | Total packets | Discarded packets |
| A | 0 | 6 | 0 |
| B | 0 | 6 | 0 |
| C | 0 | 6 | 0 |
| D | 0 | 6 | 0 |
| Mode M0 | |||
|---|---|---|---|
| Quadrant | BADHDUFLAG | Total packets | Discarded packets |
| A | 0 | 22997 | 0 |
| B | 0 | 22082 | 0 |
| C | 0 | 22010 | 0 |
| D | 0 | 42903 | 0 |
| Quadrant | Total seconds | Saturated seconds | Saturation percentage |
|---|---|---|---|
| A | 10843 | 80 | 0.737803% |
| B | 10844 | 61 | 0.562523% |
| C | 10842 | 97 | 0.894669% |
| D | 10843 | 791 | 7.295029% |
Noise dominated data is calculated using 1-second bins in cleaned event files. If a bin has >2000 counts, and if more than 50% of those come from <1% of pixels, then it is considered to be noise-dominated and hence unusable.
| Quadrant | # 1 sec bins | Bins with >0 counts | Bins with >2000 counts | High rate bins dominated by noise | Noise dominated (total time) | Noise dominated (detector-on time) | Marked lightcurve |
|---|---|---|---|---|---|---|---|
| A | 11423 | 10844 | 22 | 22 | 0.19% | 0.20% | 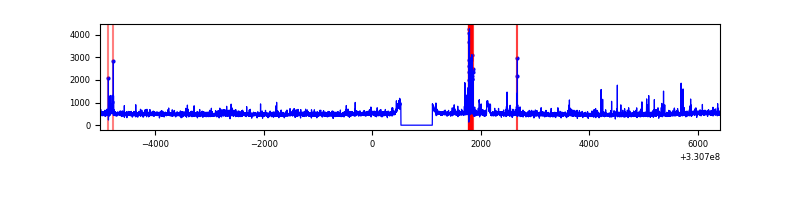 |
| B | 11424 | 10845 | 1 | 1 | 0.01% | 0.01% | 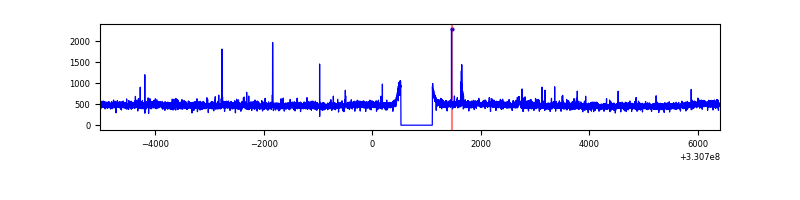 |
| C | 11424 | 10845 | 0 | 0 | 0.00% | 0.00% | 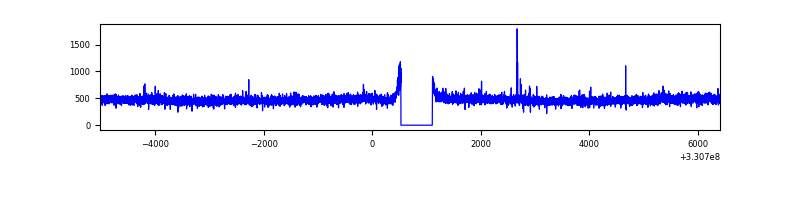 |
| D | 11424 | 10845 | 754 | 754 | 6.60% | 6.95% | 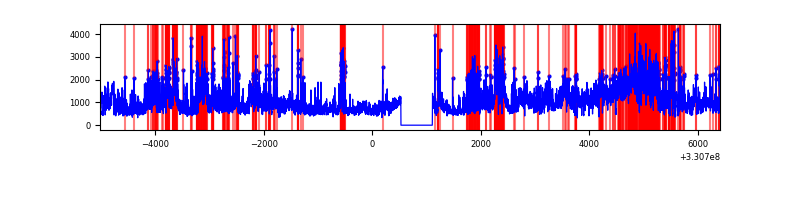 |
Top three noisy pixels from each quadrant. If the there are fewer than three noisy pixels in the level2.evt file, extra rows are filled as -1
| Pixel properties | Quadrant properties | ||||||
|---|---|---|---|---|---|---|---|
| Quadrant | DetID | PixID | Counts | Sigma | Mean | Median | Sigma |
| A | 8 | 192 | 275418 | 1045.68 | 1300 | 1274 | 262.2 |
| A | 0 | 13 | 175321 | 663.88 | 1300 | 1274 | 262.2 |
| A | 6 | 16 | 93262 | 350.87 | 1300 | 1274 | 262.2 |
| B | 0 | 219 | 42209 | 164.16 | 1293 | 1256 | 249.5 |
| B | 0 | 190 | 33129 | 127.76 | 1293 | 1256 | 249.5 |
| B | 3 | 112 | 32077 | 123.55 | 1293 | 1256 | 249.5 |
| C | 14 | 238 | 196993 | 663.89 | 1249 | 1257 | 294.8 |
| C | 3 | 233 | 58416 | 193.87 | 1249 | 1257 | 294.8 |
| C | 2 | 16 | 8661 | 25.11 | 1249 | 1257 | 294.8 |
| D | 13 | 174 | 4885448 | 16078.75 | 1242 | 1207 | 303.8 |
| D | 1 | 52 | 1599898 | 5262.83 | 1242 | 1207 | 303.8 |
| D | 8 | 195 | 371967 | 1220.53 | 1242 | 1207 | 303.8 |
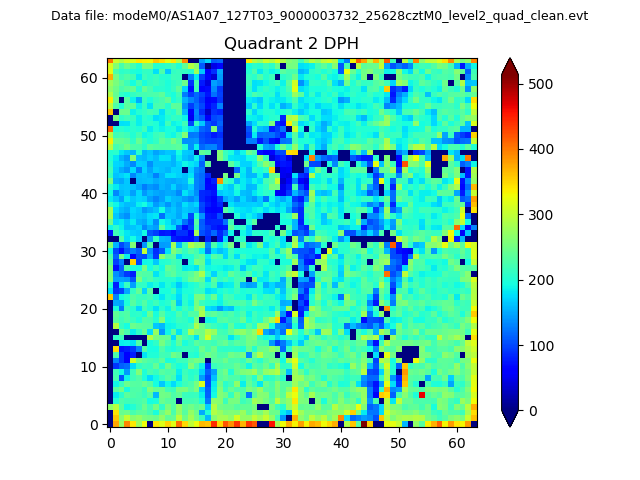
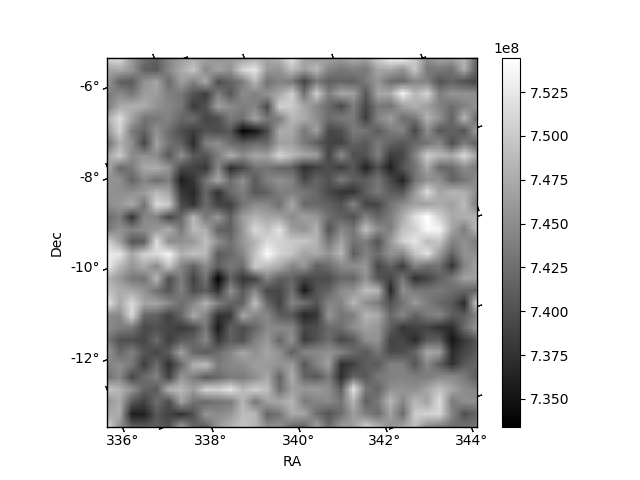
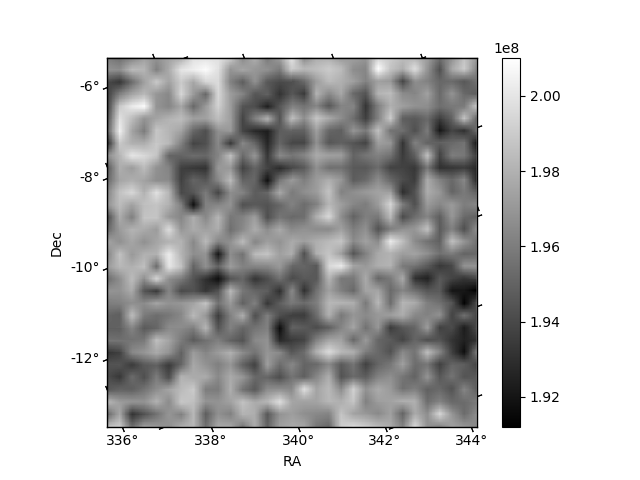
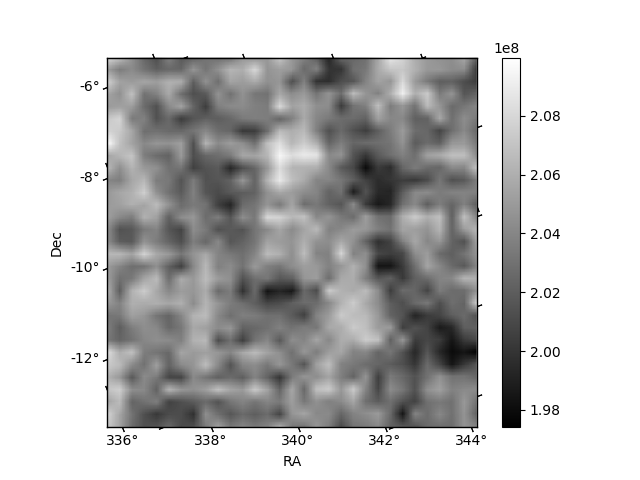
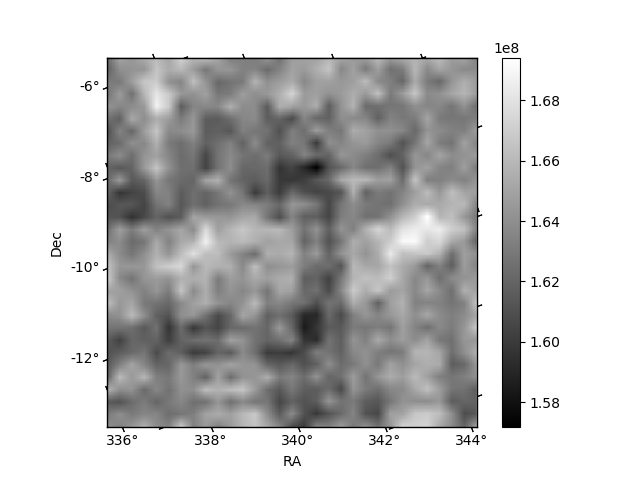
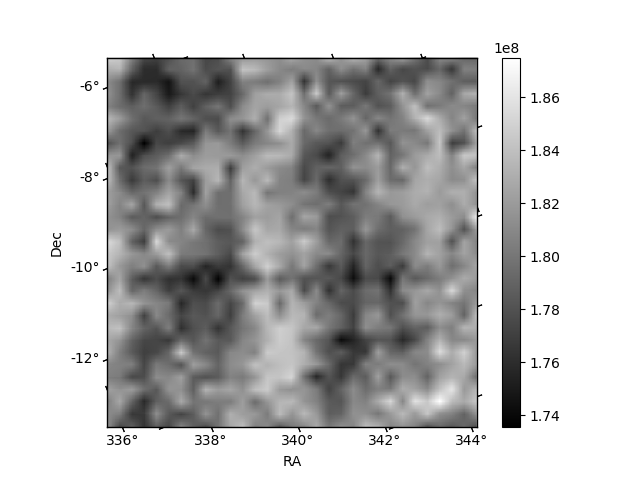
Histogram calculated using DETX and DETY for each event in the final _common_clean file
| Quadrant A | 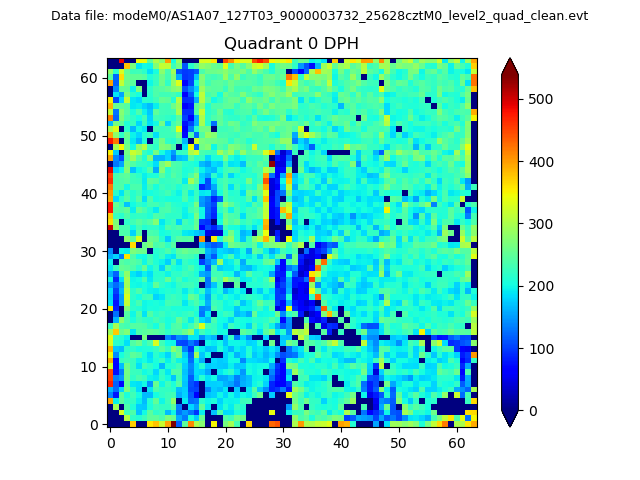 |
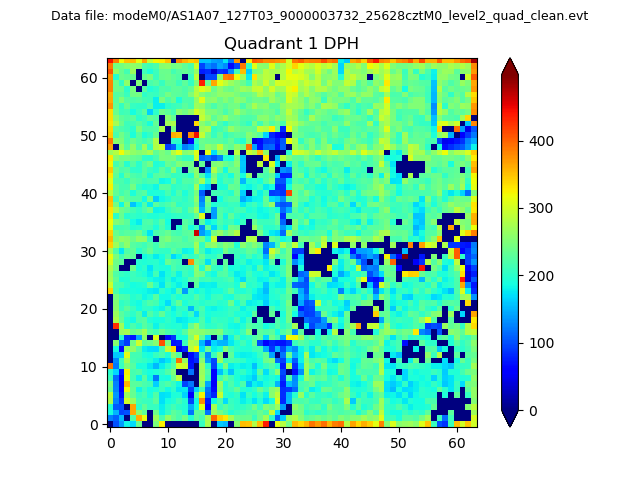 |
Quadrant B |
|---|---|---|---|
| Quadrant D | 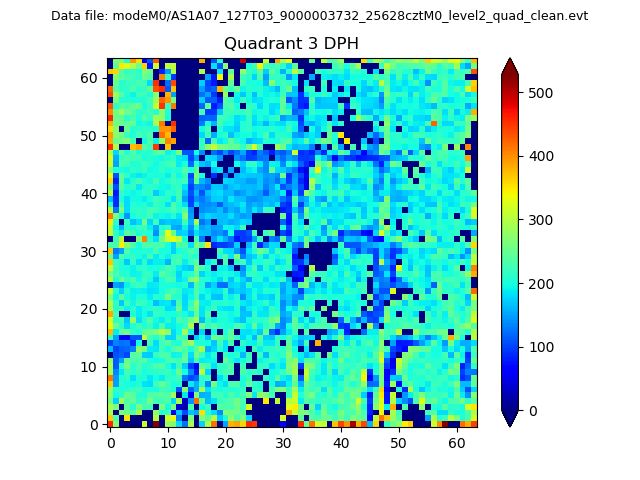 |
 |
Quadrant C |
| Plot type | Count rate plots | Images |
|---|---|---|
| Comparison with Poisson distribution Blue bars denote a histogram of data divided into 1 sec bins. Red curve is a Poisson curve with rate = median count rate of data. |
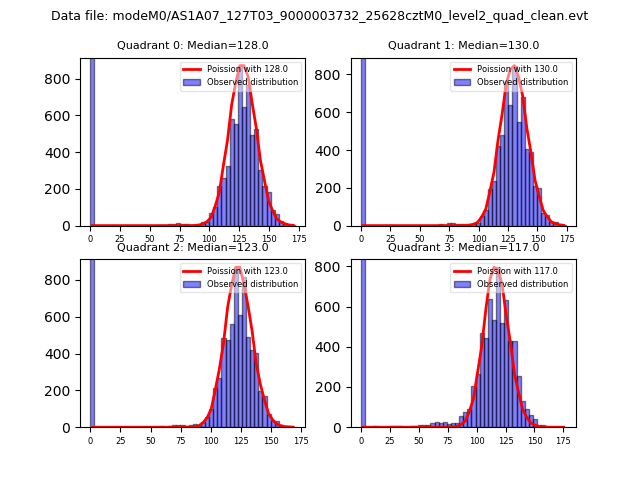 |
 |
| Quadrant-wise count rates Data is divided into 100 sec bins |
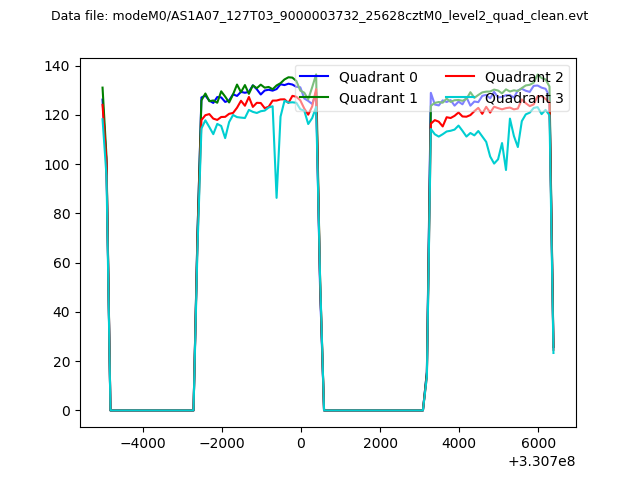 |
|
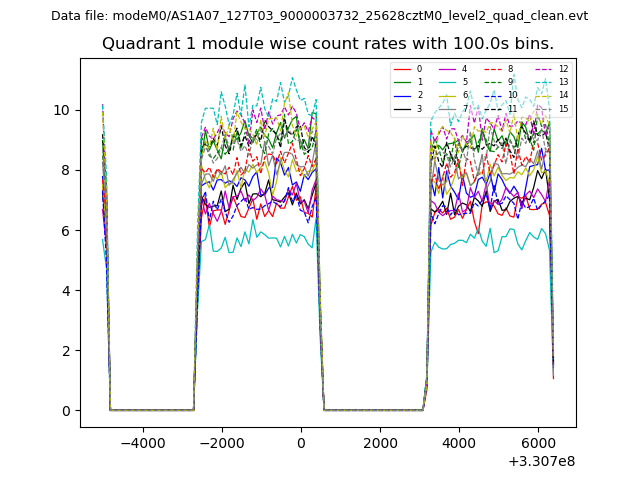
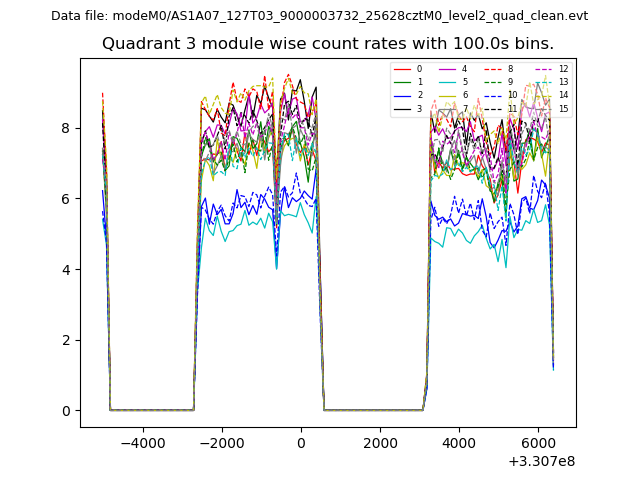
| Module-wise count rates for Quadrant A Data is divided into 100 sec bins |
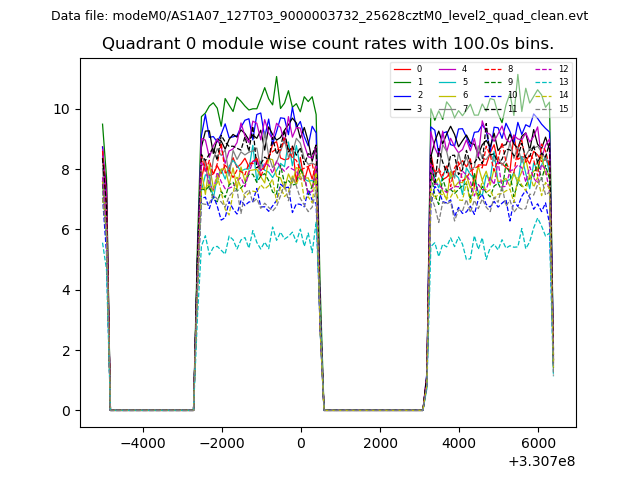 |
 |
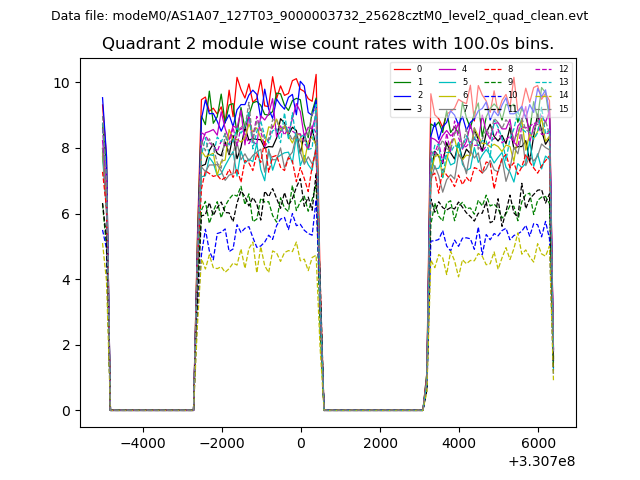
| Module-wise count rates for Quadrant B Data is divided into 100 sec bins |
 |
 |
| Module-wise count rates for Quadrant C Data is divided into 100 sec bins |
 |
 |
| Module-wise count rates for Quadrant D Data is divided into 100 sec bins |
 |
 |
| Parameter | Plot |
|---|---|
| CZT HV Monitor | 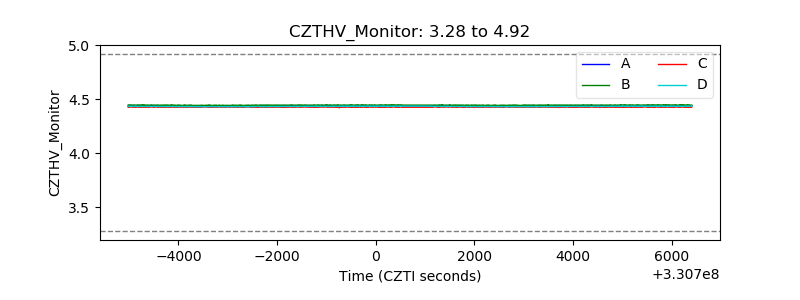 |
| D_VDD | 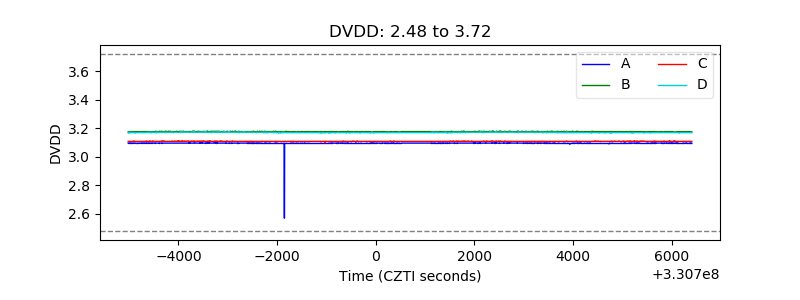 |
| Temperature 1 | 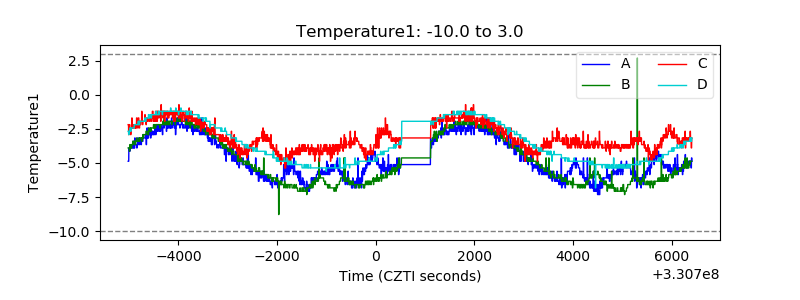 |
| Veto HV Monitor | 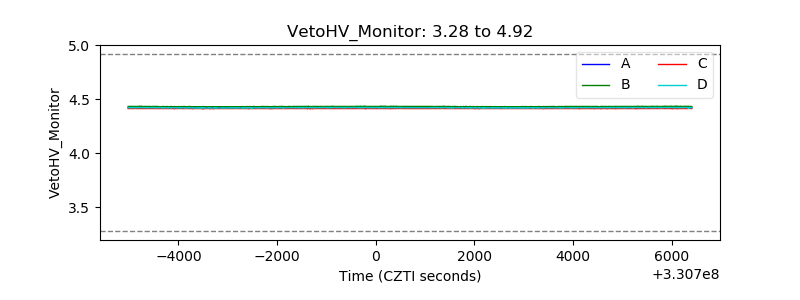 |
| Veto LLD | 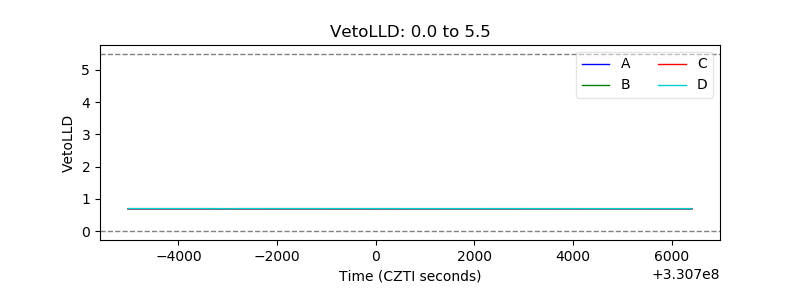 |
| Alpha Counter | 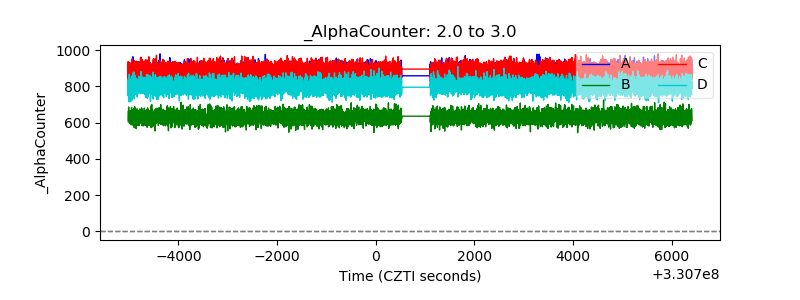 |
| _CPM_Rate | 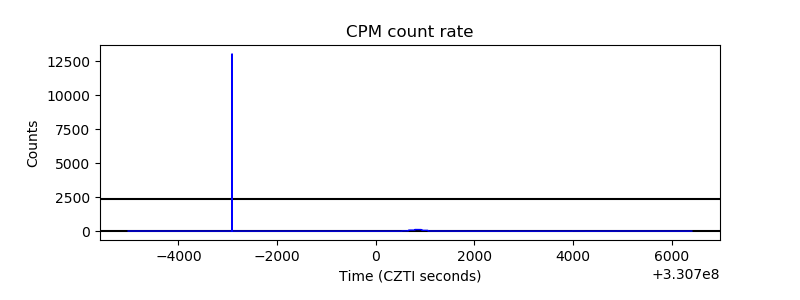 |
| CZT Counter | 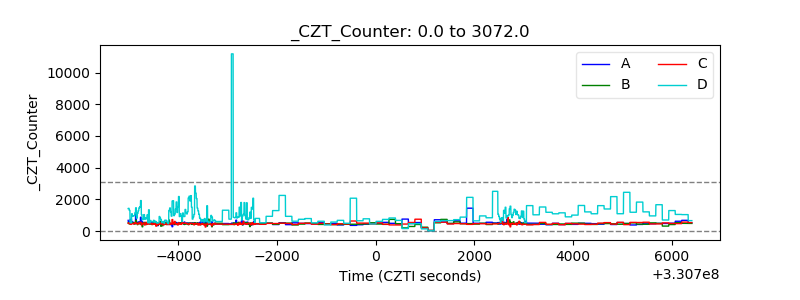 |
| +2.5 Volts monitor |  |
| +5 Volts monitor |  |
| _ROLL_ROT | 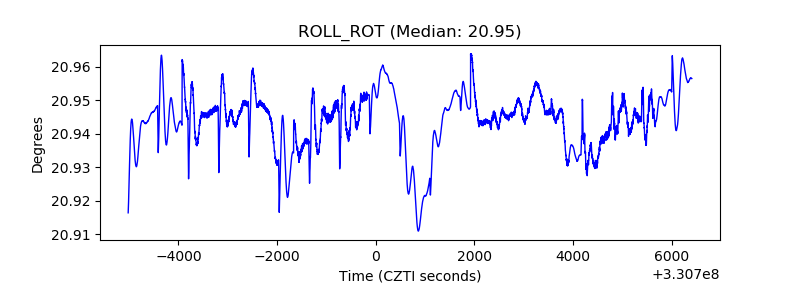 |
| _Roll_DEC |  |
| _Roll_RA | 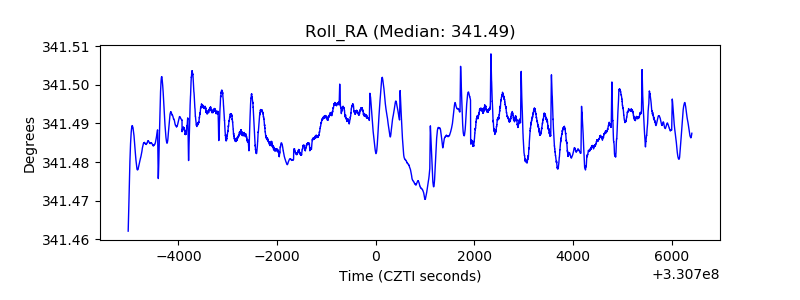 |
| Veto Counter | 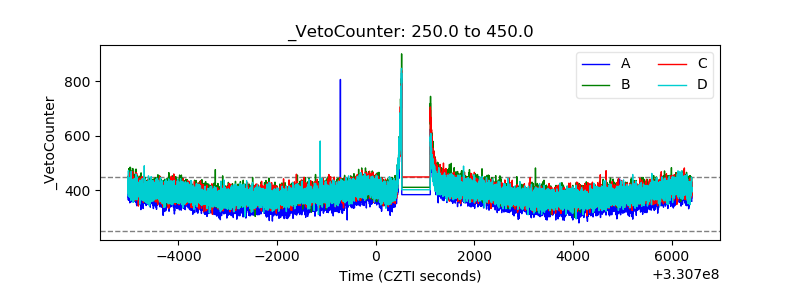 |