| Param | Original file | Final file |
|---|---|---|
| Filename | modeM0/AS1A07_127T03_9000003732_25629cztM0_level2.evt | modeM0/AS1A07_127T03_9000003732_25629cztM0_level2_quad_clean.evt |
| Size (bytes) | 677,897,280 | 93,093,120 |
| Size | 646.5 MB | 88.8 MB |
| Events in quadrant A | 4,363,536 | 586,966 |
| Events in quadrant B | 3,864,691 | 597,181 |
| Events in quadrant C | 3,829,737 | 566,494 |
| Events in quadrant D | 7,953,329 | 534,998 |
| Mode M9 | |||
|---|---|---|---|
| Quadrant | BADHDUFLAG | Total packets | Discarded packets |
| A | 0 | 17 | 0 |
| B | 0 | 17 | 0 |
| C | 0 | 17 | 0 |
| D | 0 | 17 | 0 |
| Mode M0 | |||
|---|---|---|---|
| Quadrant | BADHDUFLAG | Total packets | Discarded packets |
| A | 0 | 17604 | 0 |
| B | 0 | 16135 | 0 |
| C | 0 | 16056 | 0 |
| D | 0 | 28971 | 0 |
| Quadrant | Total seconds | Saturated seconds | Saturation percentage |
|---|---|---|---|
| A | 7664 | 152 | 1.983299% |
| B | 7665 | 105 | 1.369863% |
| C | 7665 | 131 | 1.709067% |
| D | 7665 | 1137 | 14.833659% |
Noise dominated data is calculated using 1-second bins in cleaned event files. If a bin has >2000 counts, and if more than 50% of those come from <1% of pixels, then it is considered to be noise-dominated and hence unusable.
| Quadrant | # 1 sec bins | Bins with >0 counts | Bins with >2000 counts | High rate bins dominated by noise | Noise dominated (total time) | Noise dominated (detector-on time) | Marked lightcurve |
|---|---|---|---|---|---|---|---|
| A | 9319 | 7666 | 27 | 27 | 0.29% | 0.35% | 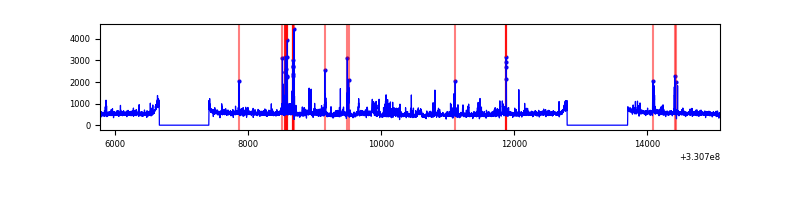 |
| B | 9320 | 7667 | 2 | 2 | 0.02% | 0.03% | 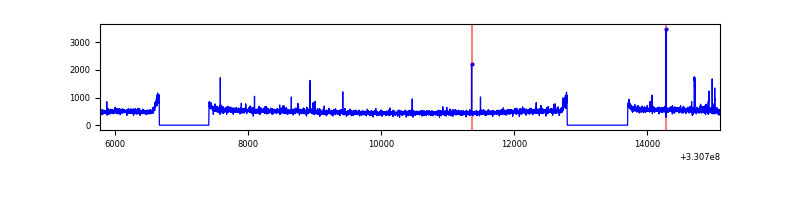 |
| C | 9320 | 7667 | 5 | 5 | 0.05% | 0.07% | 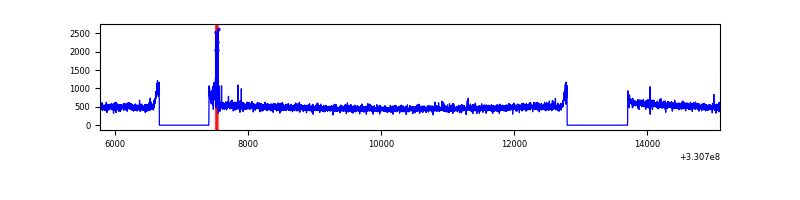 |
| D | 9320 | 7667 | 834 | 834 | 8.95% | 10.88% | 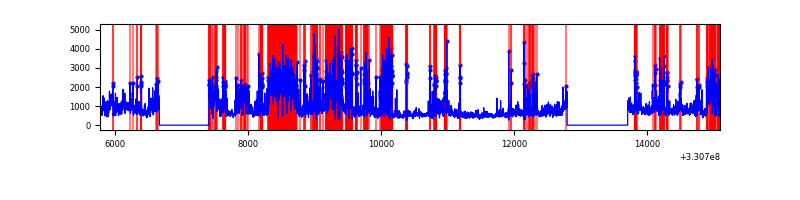 |
Top three noisy pixels from each quadrant. If the there are fewer than three noisy pixels in the level2.evt file, extra rows are filled as -1
| Pixel properties | Quadrant properties | ||||||
|---|---|---|---|---|---|---|---|
| Quadrant | DetID | PixID | Counts | Sigma | Mean | Median | Sigma |
| A | 0 | 13 | 384711 | 1961.18 | 969 | 949 | 195.7 |
| A | 8 | 192 | 179846 | 914.24 | 969 | 949 | 195.7 |
| A | 6 | 16 | 50759 | 254.55 | 969 | 949 | 195.7 |
| B | 3 | 112 | 38613 | 203.04 | 962 | 937 | 185.6 |
| B | 0 | 190 | 23628 | 122.29 | 962 | 937 | 185.6 |
| B | 0 | 219 | 23573 | 121.99 | 962 | 937 | 185.6 |
| C | 14 | 238 | 146980 | 668.26 | 926 | 931 | 218.6 |
| C | 14 | 225 | 53801 | 241.91 | 926 | 931 | 218.6 |
| C | 3 | 233 | 20695 | 90.43 | 926 | 931 | 218.6 |
| D | 13 | 174 | 2269345 | 10402.78 | 898 | 873 | 218.1 |
| D | 1 | 52 | 2034312 | 9324.96 | 898 | 873 | 218.1 |
| D | 8 | 195 | 230899 | 1054.86 | 898 | 873 | 218.1 |
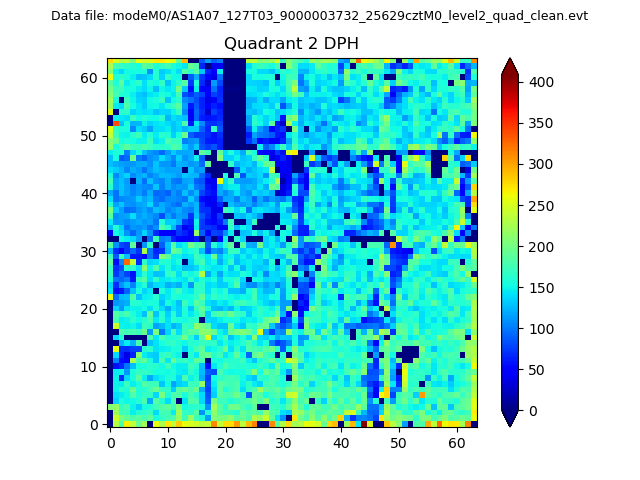
Histogram calculated using DETX and DETY for each event in the final _common_clean file
| Quadrant A | 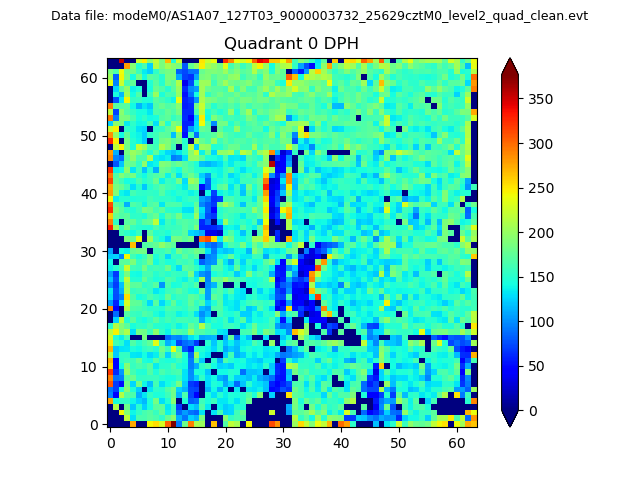 |
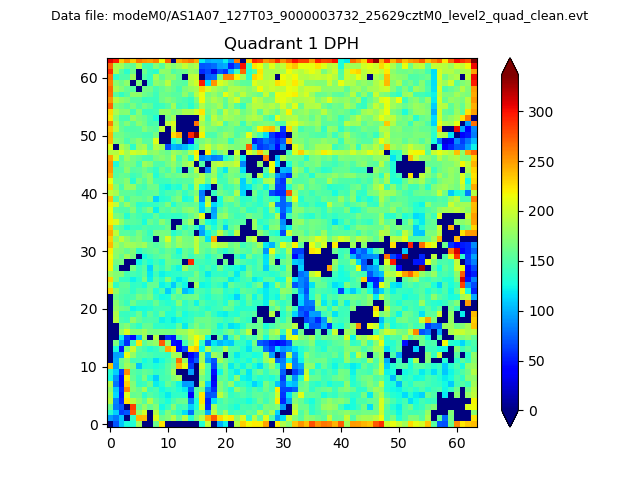 |
Quadrant B |
|---|---|---|---|
| Quadrant D | 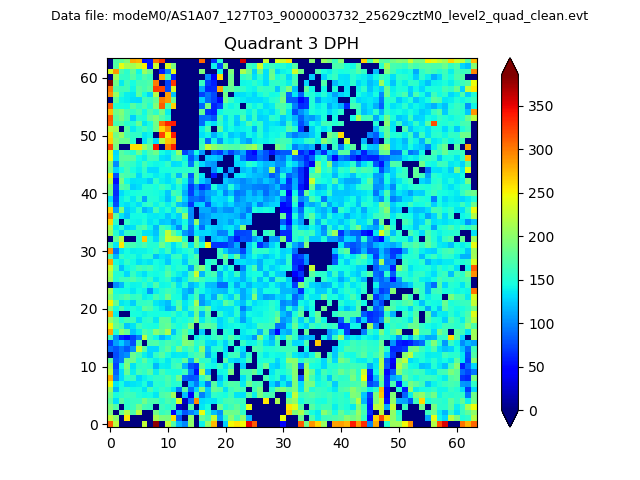 |
 |
Quadrant C |
| Plot type | Count rate plots | Images |
|---|---|---|
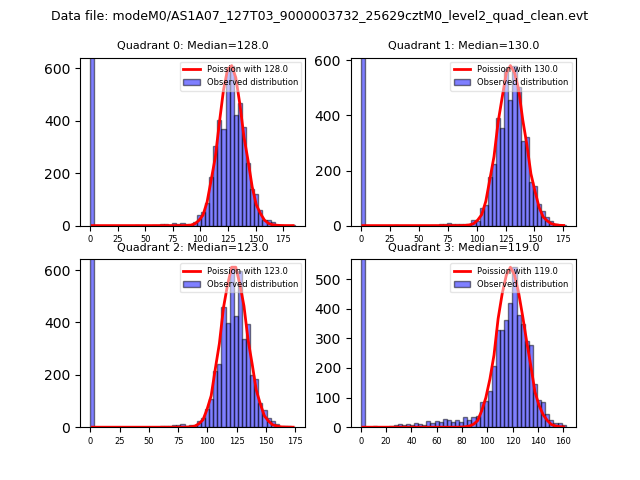
| Comparison with Poisson distribution Blue bars denote a histogram of data divided into 1 sec bins. Red curve is a Poisson curve with rate = median count rate of data. |
 |
 |
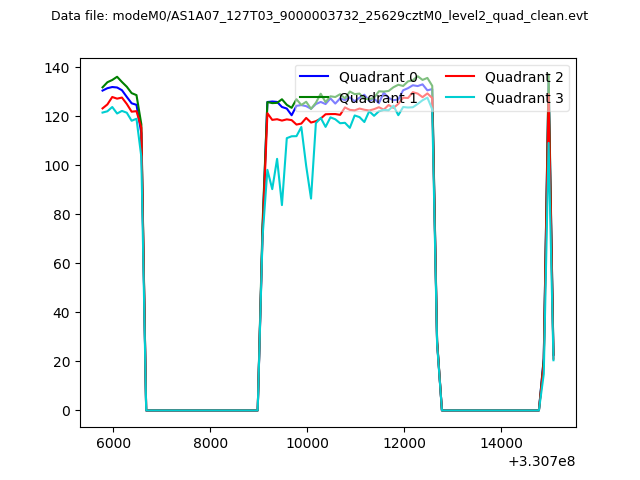
| Quadrant-wise count rates Data is divided into 100 sec bins |
 |
|
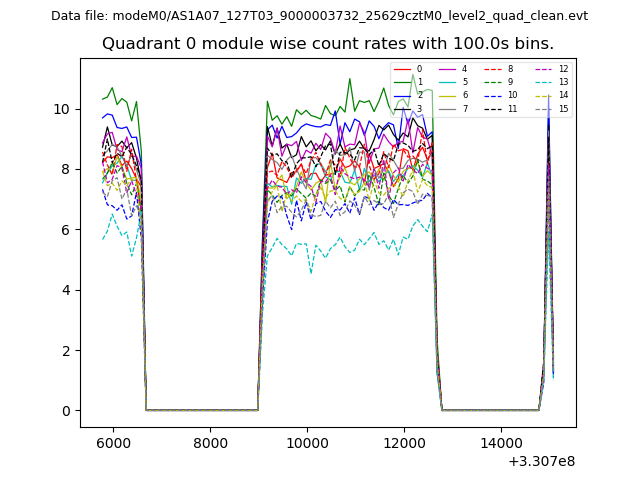
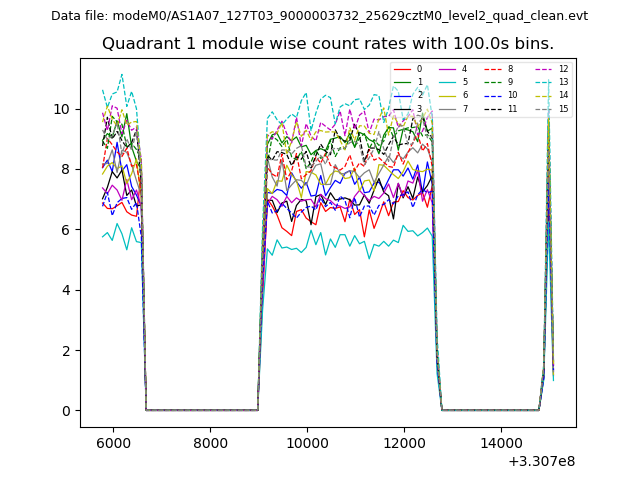
| Module-wise count rates for Quadrant A Data is divided into 100 sec bins |
 |
 |
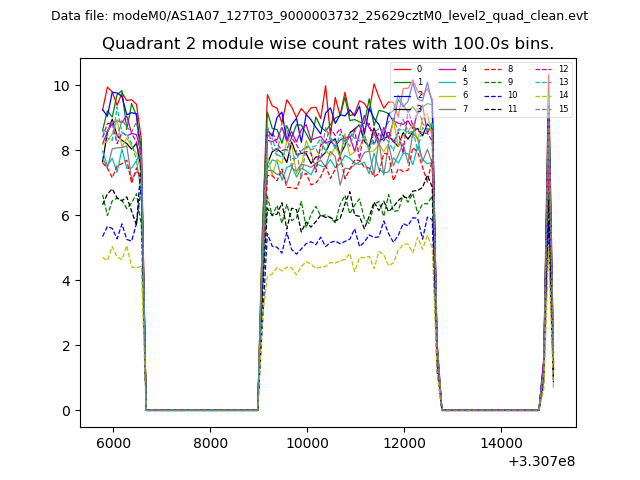
| Module-wise count rates for Quadrant B Data is divided into 100 sec bins |
 |
 |
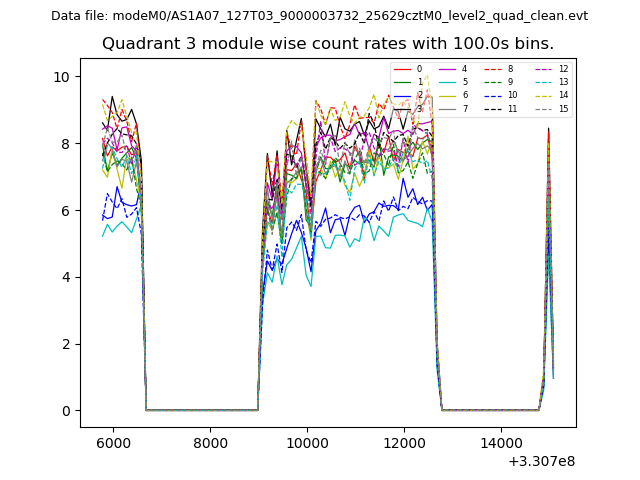
| Module-wise count rates for Quadrant C Data is divided into 100 sec bins |
 |
 |
| Module-wise count rates for Quadrant D Data is divided into 100 sec bins |
 |
 |
| Parameter | Plot |
|---|---|
| CZT HV Monitor | 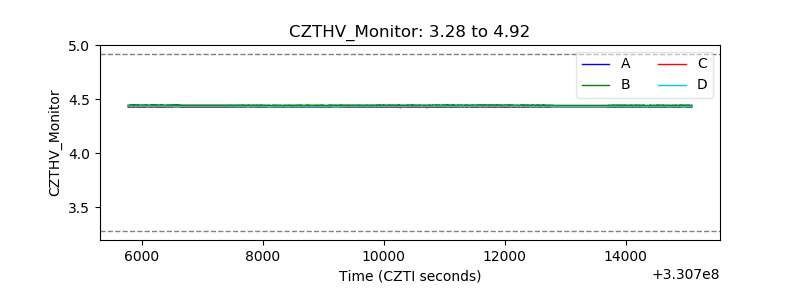 |
| D_VDD | 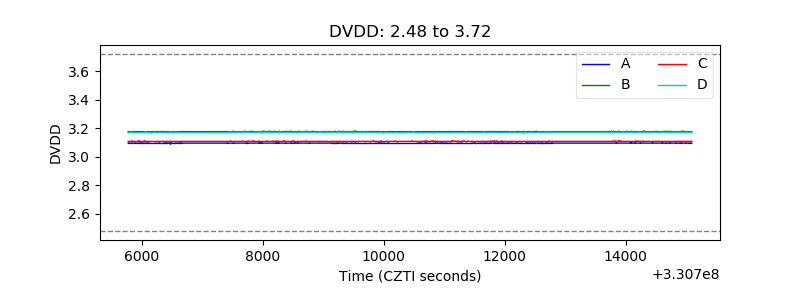 |
| Temperature 1 |  |
| Veto HV Monitor | 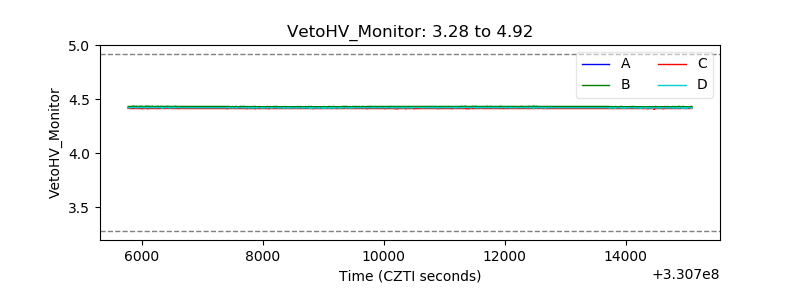 |
| Veto LLD | 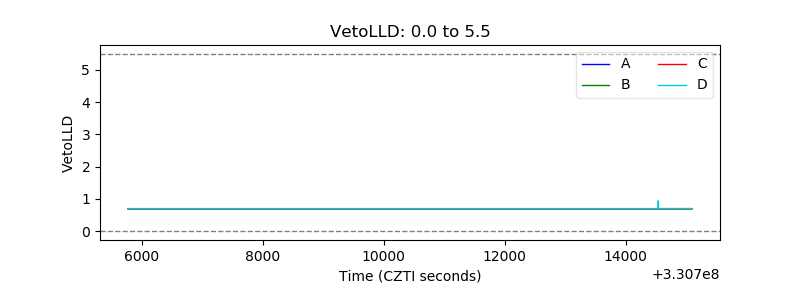 |
| Alpha Counter | 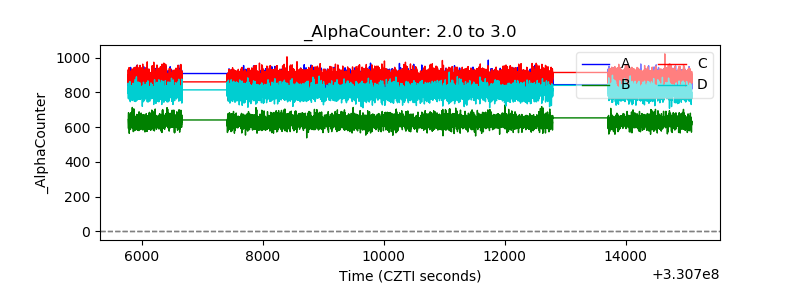 |
| _CPM_Rate | 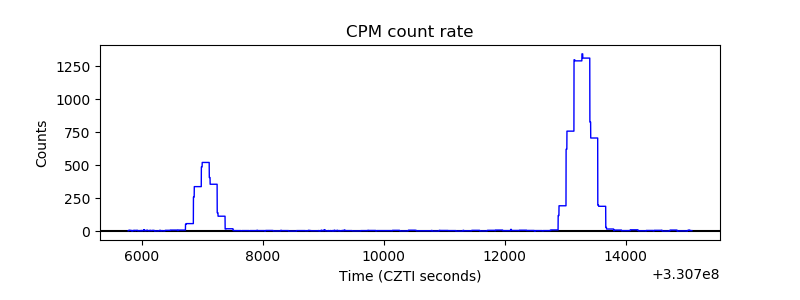 |
| CZT Counter | 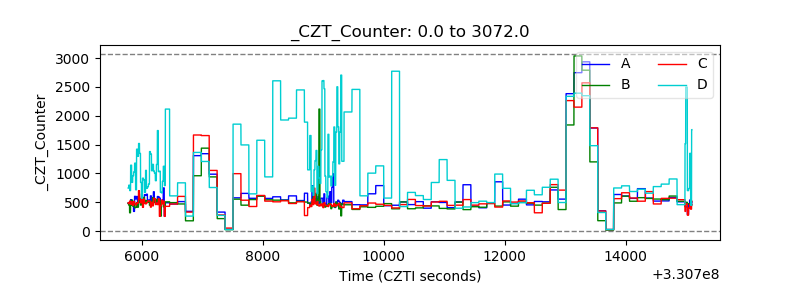 |
| +2.5 Volts monitor |  |
| +5 Volts monitor |  |
| _ROLL_ROT | 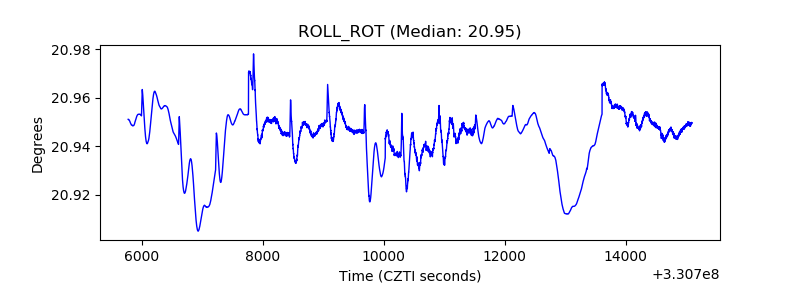 |
| _Roll_DEC |  |
| _Roll_RA | 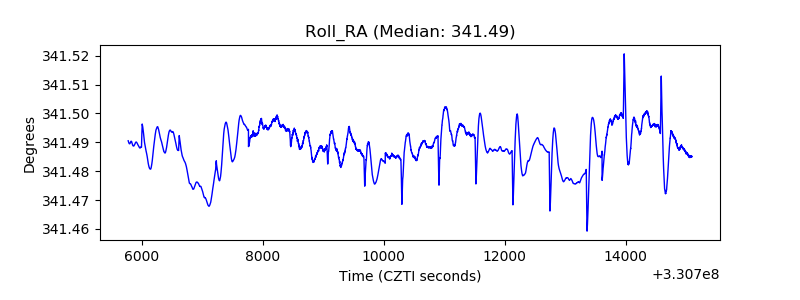 |
| Veto Counter | 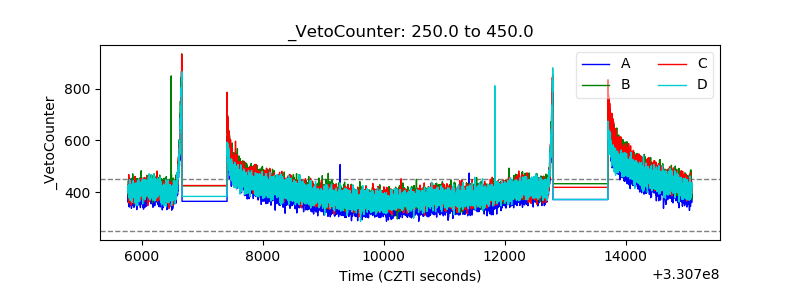 |