| Param | Original file | Final file |
|---|---|---|
| Filename | modeM0/AS1A07_127T03_9000003732_25632cztM0_level2.evt | modeM0/AS1A07_127T03_9000003732_25632cztM0_level2_quad_clean.evt |
| Size (bytes) | 521,608,320 | 84,928,320 |
| Size | 497.4 MB | 81.0 MB |
| Events in quadrant A | 3,790,815 | 540,044 |
| Events in quadrant B | 3,257,852 | 551,725 |
| Events in quadrant C | 3,207,333 | 526,276 |
| Events in quadrant D | 5,108,158 | 508,109 |
| Mode M9 | |||
|---|---|---|---|
| Quadrant | BADHDUFLAG | Total packets | Discarded packets |
| A | 0 | 11 | 0 |
| B | 0 | 11 | 0 |
| C | 0 | 11 | 0 |
| D | 0 | 11 | 0 |
| Mode M0 | |||
|---|---|---|---|
| Quadrant | BADHDUFLAG | Total packets | Discarded packets |
| A | 0 | 15403 | 0 |
| B | 0 | 13765 | 0 |
| C | 0 | 13470 | 0 |
| D | 0 | 19544 | 0 |
| Quadrant | Total seconds | Saturated seconds | Saturation percentage |
|---|---|---|---|
| A | 6391 | 57 | 0.891879% |
| B | 6391 | 58 | 0.907526% |
| C | 6391 | 78 | 1.220466% |
| D | 6392 | 306 | 4.787234% |
Noise dominated data is calculated using 1-second bins in cleaned event files. If a bin has >2000 counts, and if more than 50% of those come from <1% of pixels, then it is considered to be noise-dominated and hence unusable.
| Quadrant | # 1 sec bins | Bins with >0 counts | Bins with >2000 counts | High rate bins dominated by noise | Noise dominated (total time) | Noise dominated (detector-on time) | Marked lightcurve |
|---|---|---|---|---|---|---|---|
| A | 7451 | 6392 | 3 | 3 | 0.04% | 0.05% | 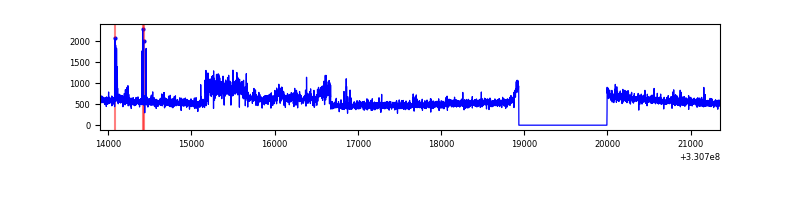 |
| B | 7451 | 6392 | 1 | 1 | 0.01% | 0.02% | 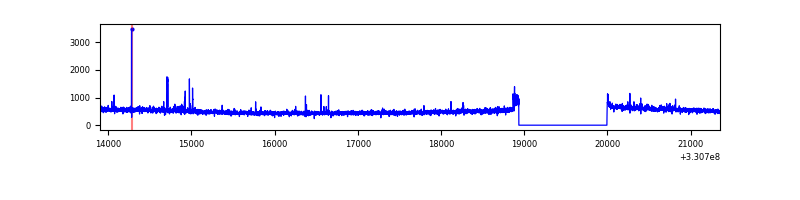 |
| C | 7451 | 6392 | 0 | 0 | 0.00% | 0.00% | 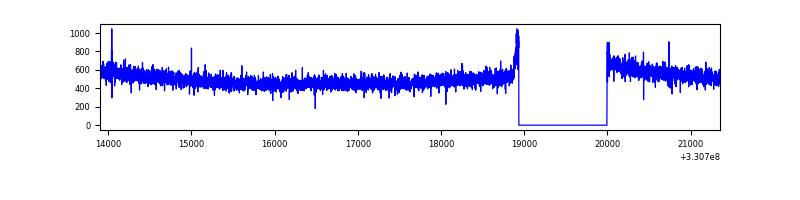 |
| D | 7452 | 6392 | 247 | 247 | 3.31% | 3.86% | 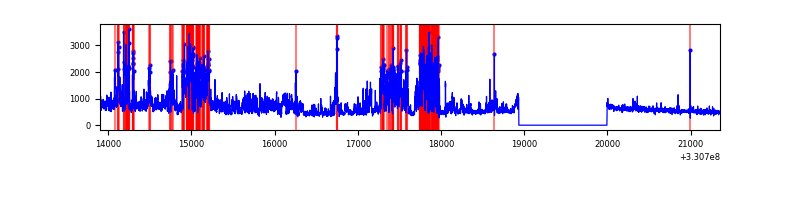 |
Top three noisy pixels from each quadrant. If the there are fewer than three noisy pixels in the level2.evt file, extra rows are filled as -1
| Pixel properties | Quadrant properties | ||||||
|---|---|---|---|---|---|---|---|
| Quadrant | DetID | PixID | Counts | Sigma | Mean | Median | Sigma |
| A | 8 | 192 | 552578 | 3352.4 | 814 | 798 | 164.6 |
| A | 6 | 16 | 47055 | 281.04 | 814 | 798 | 164.6 |
| A | 0 | 13 | 44601 | 266.13 | 814 | 798 | 164.6 |
| B | 3 | 112 | 39327 | 247.0 | 812 | 791 | 156.0 |
| B | 0 | 190 | 26227 | 163.03 | 812 | 791 | 156.0 |
| B | 12 | 111 | 18837 | 115.67 | 812 | 791 | 156.0 |
| C | 14 | 238 | 125274 | 671.82 | 786 | 792 | 185.3 |
| C | 3 | 233 | 19758 | 102.36 | 786 | 792 | 185.3 |
| C | 13 | 61 | 5231 | 23.96 | 786 | 792 | 185.3 |
| D | 13 | 174 | 1999721 | 10420.36 | 787 | 764 | 191.8 |
| D | 8 | 195 | 90341 | 466.96 | 787 | 764 | 191.8 |
| D | 1 | 52 | 27762 | 140.74 | 787 | 764 | 191.8 |
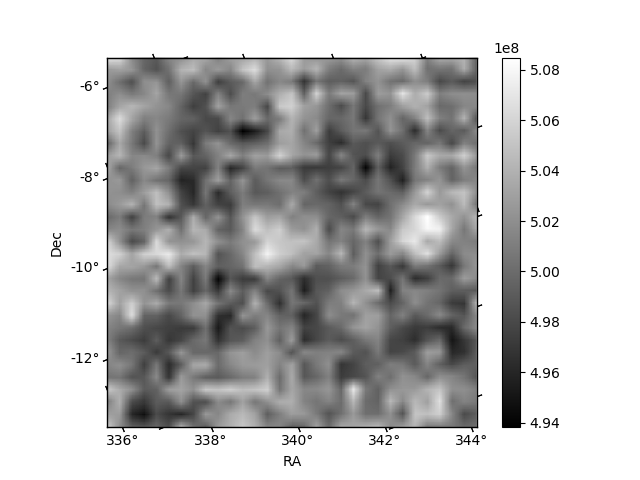
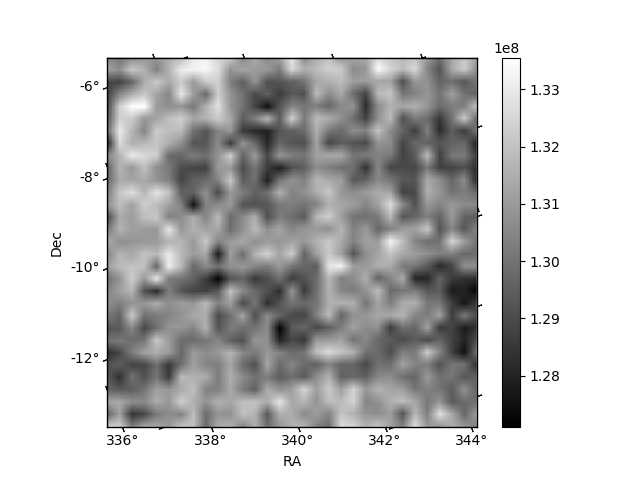
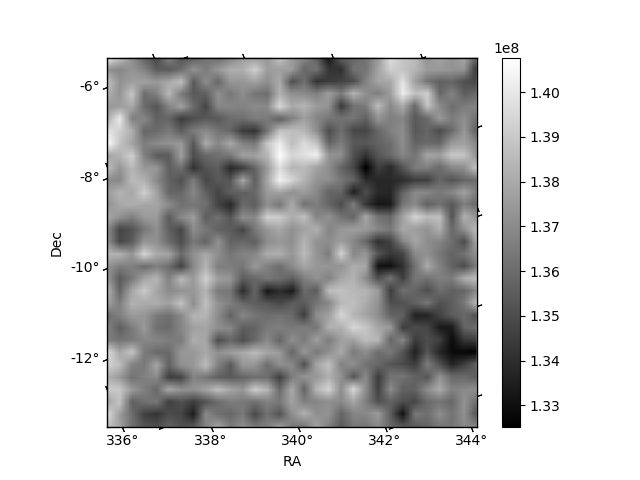
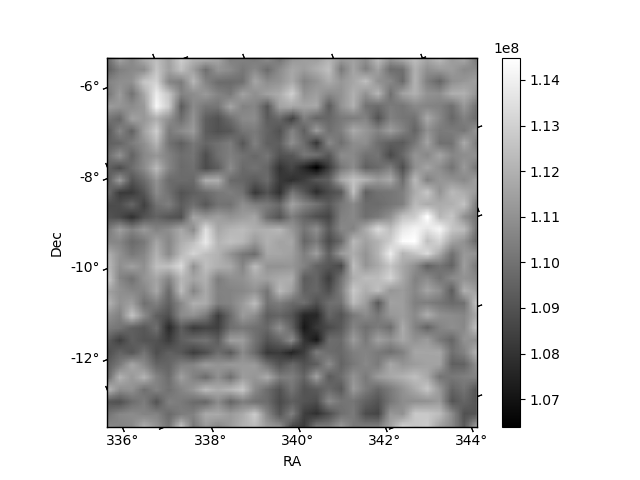
Histogram calculated using DETX and DETY for each event in the final _common_clean file
| Quadrant A | 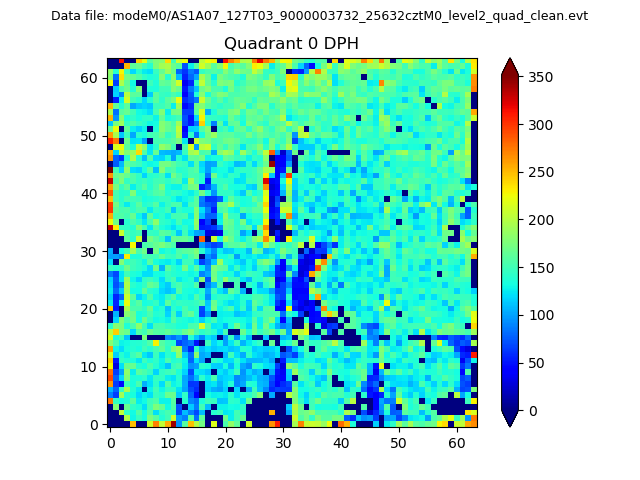 |
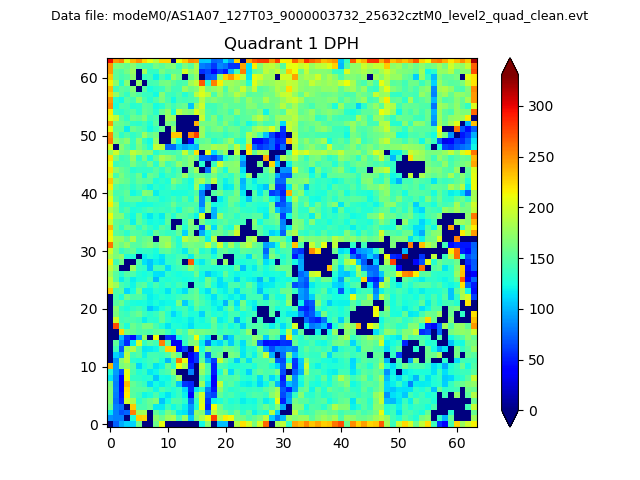 |
Quadrant B |
|---|---|---|---|
| Quadrant D | 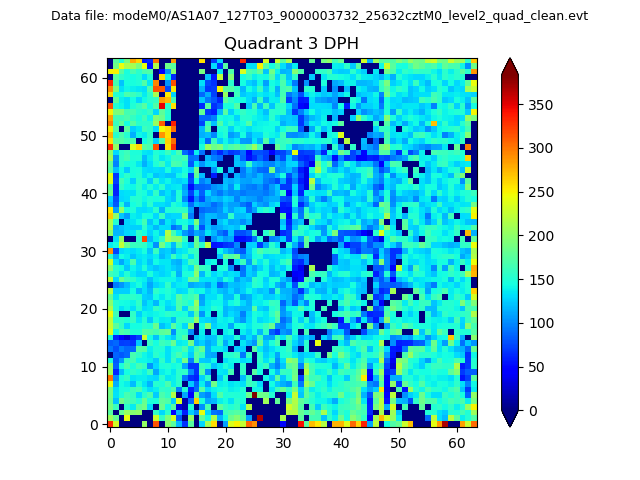 |
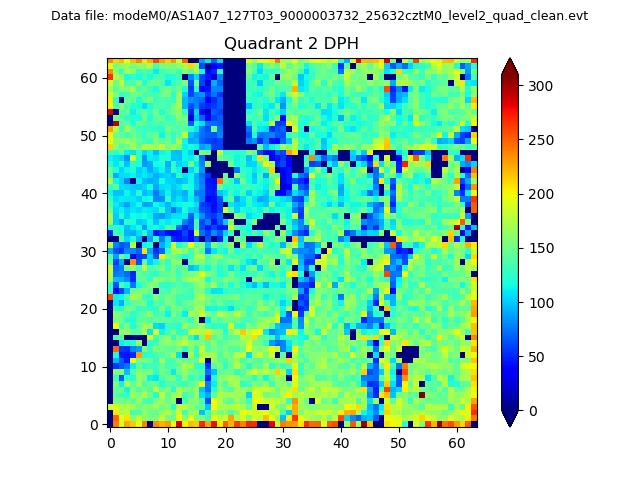 |
Quadrant C |
| Plot type | Count rate plots | Images |
|---|---|---|
| Comparison with Poisson distribution Blue bars denote a histogram of data divided into 1 sec bins. Red curve is a Poisson curve with rate = median count rate of data. |
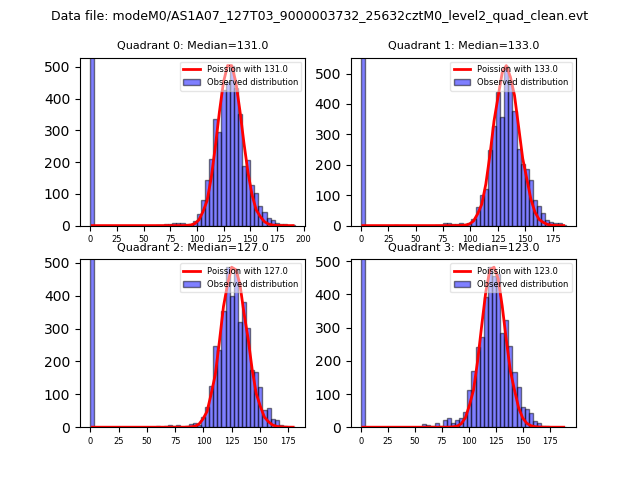 |
 |
| Quadrant-wise count rates Data is divided into 100 sec bins |
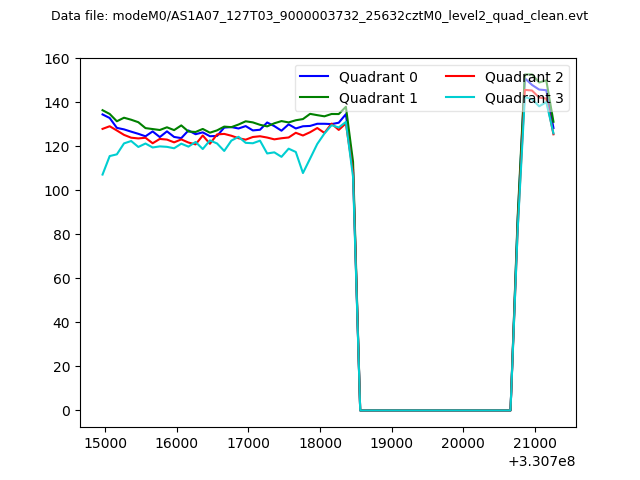 |
|
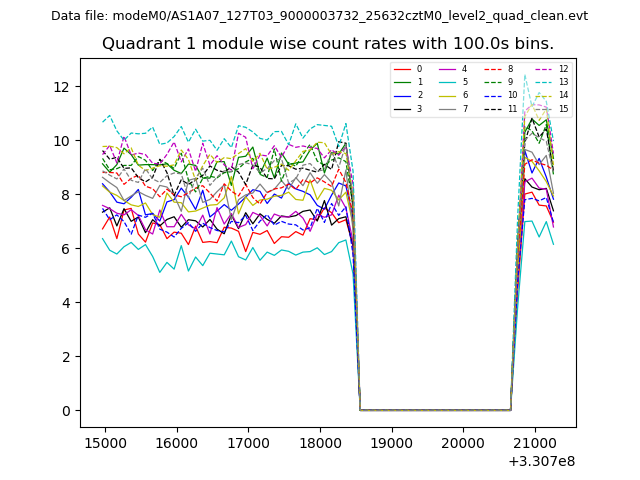
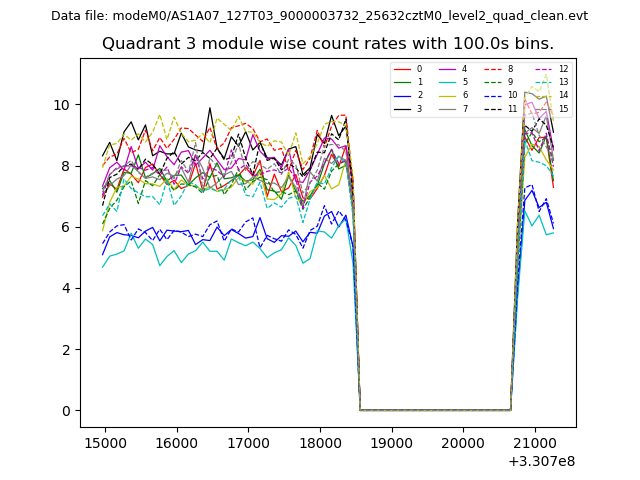
| Module-wise count rates for Quadrant A Data is divided into 100 sec bins |
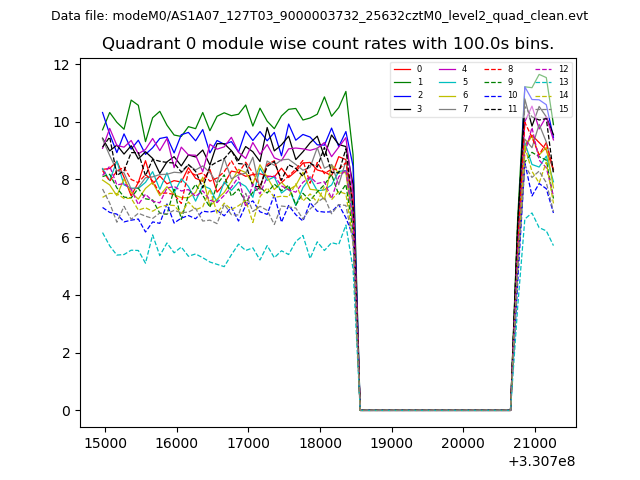 |
 |
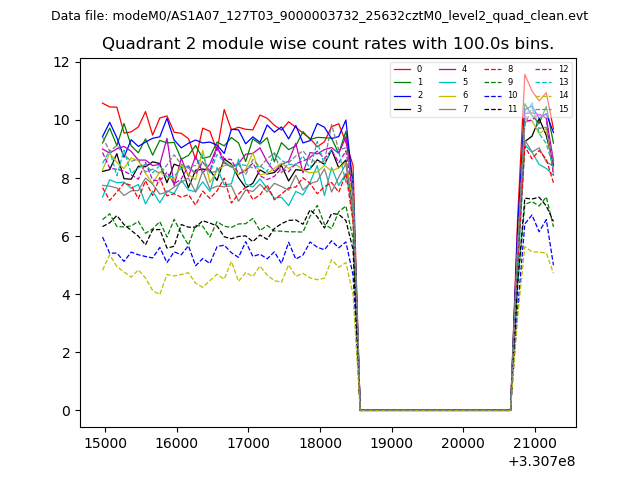
| Module-wise count rates for Quadrant B Data is divided into 100 sec bins |
 |
 |
| Module-wise count rates for Quadrant C Data is divided into 100 sec bins |
 |
 |
| Module-wise count rates for Quadrant D Data is divided into 100 sec bins |
 |
 |
| Parameter | Plot |
|---|---|
| CZT HV Monitor | 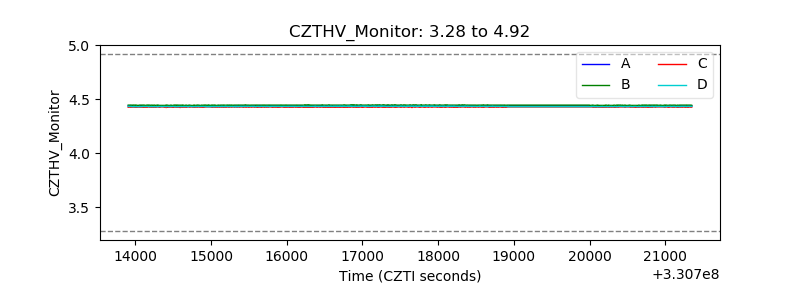 |
| D_VDD | 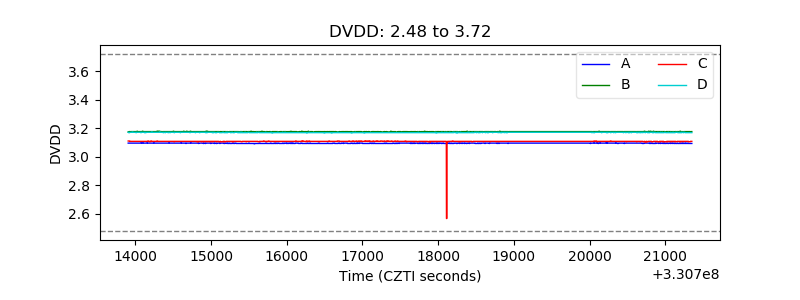 |
| Temperature 1 |  |
| Veto HV Monitor | 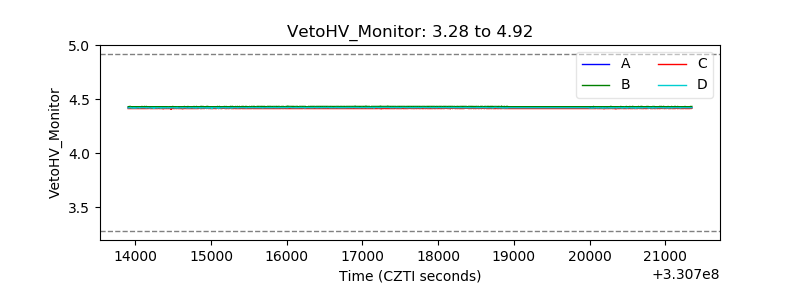 |
| Veto LLD | 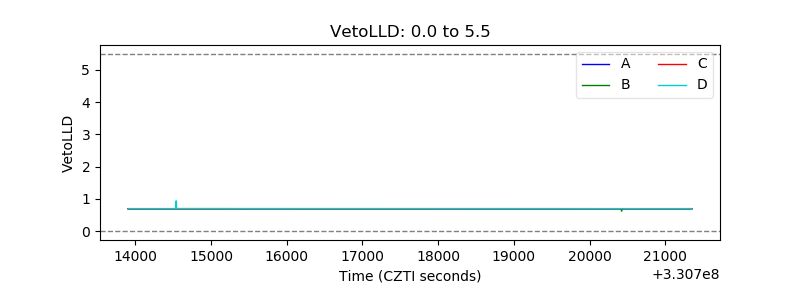 |
| Alpha Counter | 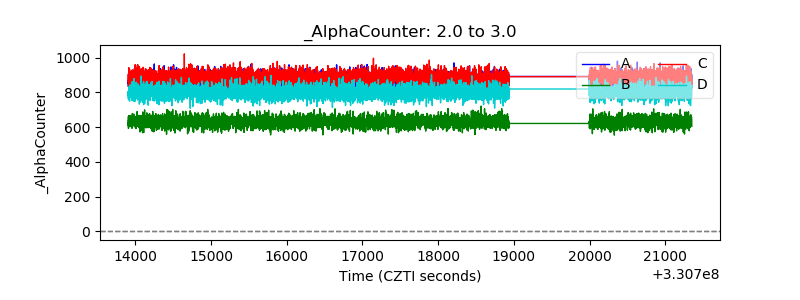 |
| _CPM_Rate | 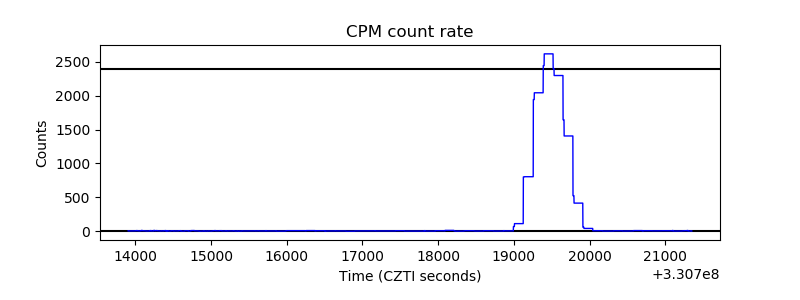 |
| CZT Counter | 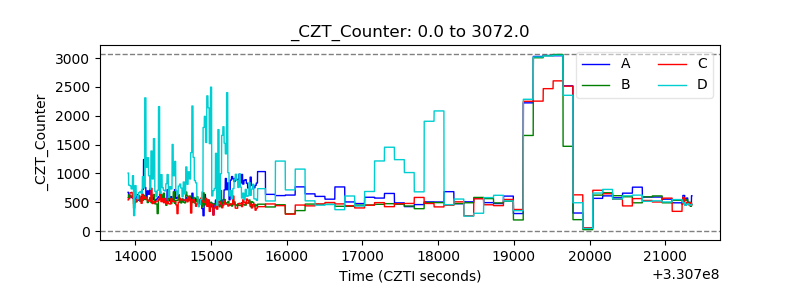 |
| +2.5 Volts monitor | 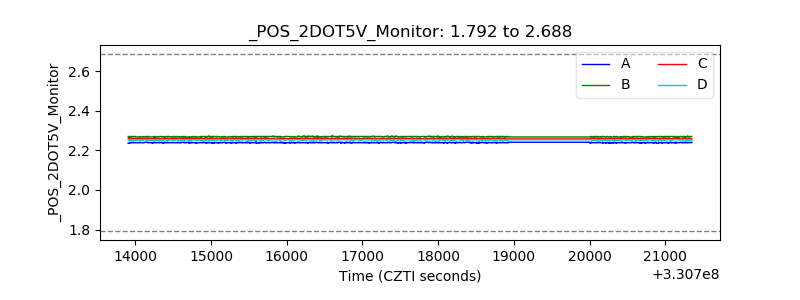 |
| +5 Volts monitor |  |
| _ROLL_ROT | 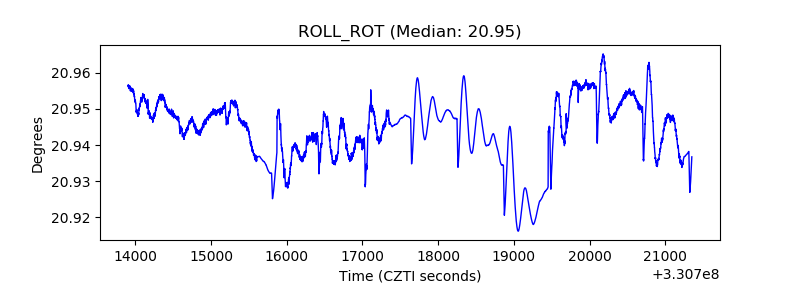 |
| _Roll_DEC | 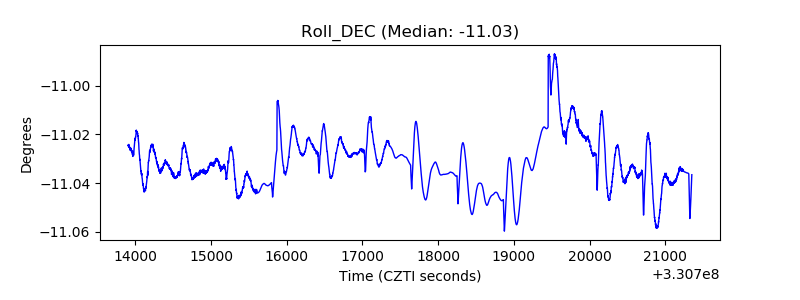 |
| _Roll_RA | 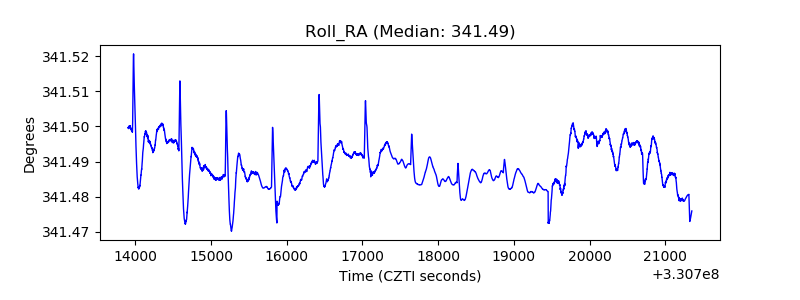 |
| Veto Counter | 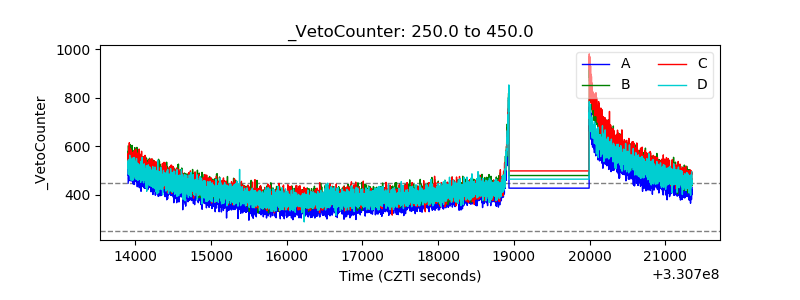 |