| Param | Original file | Final file |
|---|---|---|
| Filename | modeM0/AS1A09_013T02_9000003734_25632cztM0_level2.evt | modeM0/AS1A09_013T02_9000003734_25632cztM0_level2_quad_clean.evt |
| Size (bytes) | 277,390,080 | 55,437,120 |
| Size | 264.5 MB | 52.9 MB |
| Events in quadrant A | 2,083,589 | 350,558 |
| Events in quadrant B | 1,979,651 | 363,189 |
| Events in quadrant C | 1,981,620 | 347,720 |
| Events in quadrant D | 2,085,247 | 337,480 |
| Mode M9 | |||
|---|---|---|---|
| Quadrant | BADHDUFLAG | Total packets | Discarded packets |
| A | 0 | 11 | 0 |
| B | 0 | 11 | 0 |
| C | 0 | 11 | 0 |
| D | 0 | 11 | 0 |
| Mode M0 | |||
|---|---|---|---|
| Quadrant | BADHDUFLAG | Total packets | Discarded packets |
| A | 0 | 8611 | 0 |
| B | 0 | 8412 | 0 |
| C | 0 | 8503 | 0 |
| D | 0 | 8847 | 0 |
| Quadrant | Total seconds | Saturated seconds | Saturation percentage |
|---|---|---|---|
| A | 3952 | 20 | 0.506073% |
| B | 3952 | 32 | 0.809717% |
| C | 3952 | 64 | 1.619433% |
| D | 3952 | 20 | 0.506073% |
Noise dominated data is calculated using 1-second bins in cleaned event files. If a bin has >2000 counts, and if more than 50% of those come from <1% of pixels, then it is considered to be noise-dominated and hence unusable.
| Quadrant | # 1 sec bins | Bins with >0 counts | Bins with >2000 counts | High rate bins dominated by noise | Noise dominated (total time) | Noise dominated (detector-on time) | Marked lightcurve |
|---|---|---|---|---|---|---|---|
| A | 5127 | 3953 | 0 | 0 | 0.00% | 0.00% | 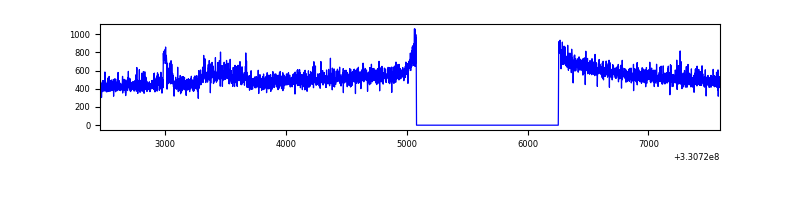 |
| B | 5127 | 3953 | 0 | 0 | 0.00% | 0.00% | 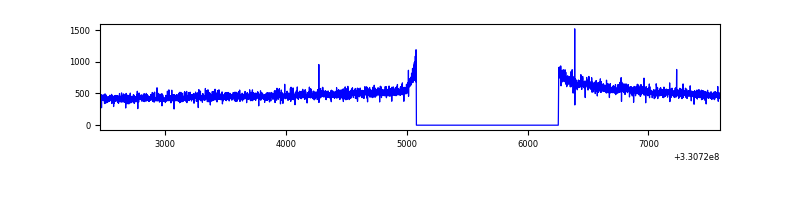 |
| C | 5127 | 3953 | 0 | 0 | 0.00% | 0.00% | 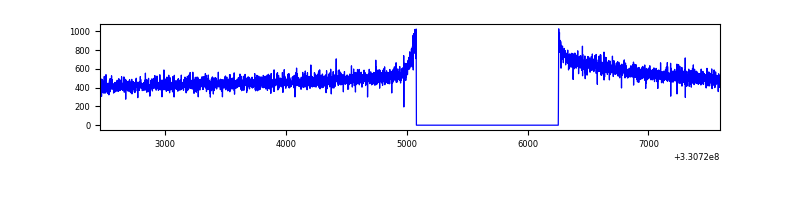 |
| D | 5127 | 3953 | 0 | 0 | 0.00% | 0.00% | 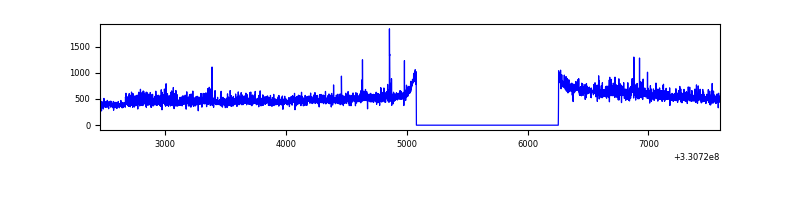 |
Top three noisy pixels from each quadrant. If the there are fewer than three noisy pixels in the level2.evt file, extra rows are filled as -1
| Pixel properties | Quadrant properties | ||||||
|---|---|---|---|---|---|---|---|
| Quadrant | DetID | PixID | Counts | Sigma | Mean | Median | Sigma |
| A | 8 | 192 | 130564 | 1281.61 | 501 | 491 | 101.5 |
| A | 6 | 16 | 16751 | 160.21 | 501 | 491 | 101.5 |
| A | 13 | 254 | 6307 | 57.31 | 501 | 491 | 101.5 |
| B | 12 | 111 | 11485 | 116.09 | 503 | 490 | 94.7 |
| B | 11 | 111 | 10174 | 102.25 | 503 | 490 | 94.7 |
| B | 14 | 111 | 9226 | 92.24 | 503 | 490 | 94.7 |
| C | 14 | 238 | 78553 | 687.31 | 487 | 492 | 113.6 |
| C | 13 | 61 | 3311 | 24.82 | 487 | 492 | 113.6 |
| C | 3 | 233 | 2503 | 17.71 | 487 | 492 | 113.6 |
| D | 8 | 195 | 209732 | 1716.39 | 487 | 475 | 121.9 |
| D | 2 | 234 | 16238 | 129.29 | 487 | 475 | 121.9 |
| D | 13 | 104 | 12569 | 99.2 | 487 | 475 | 121.9 |
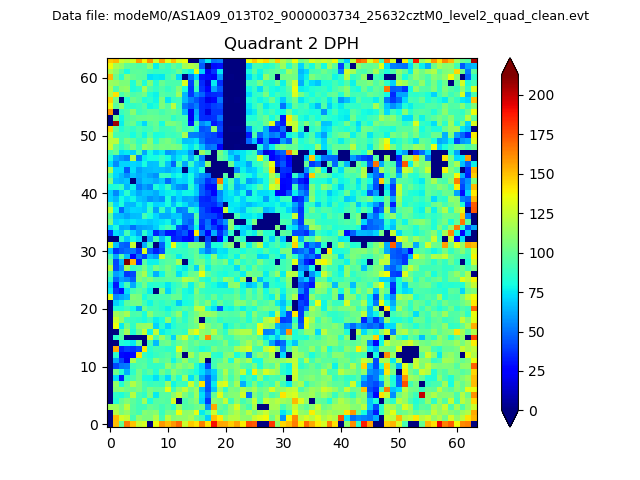
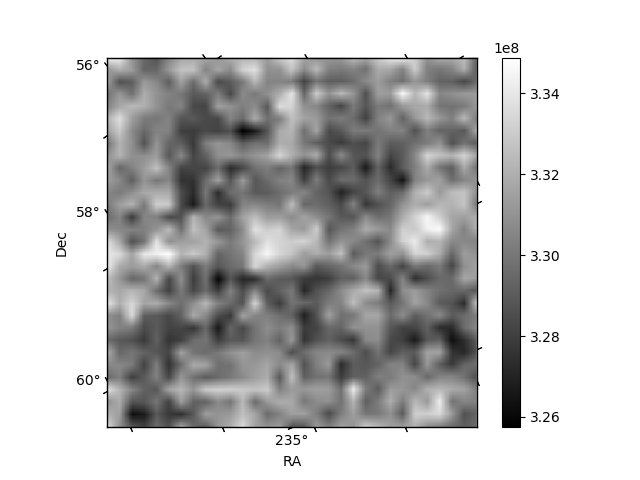
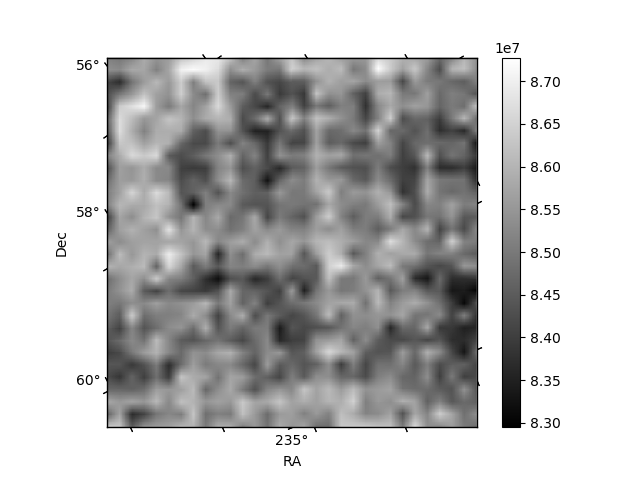
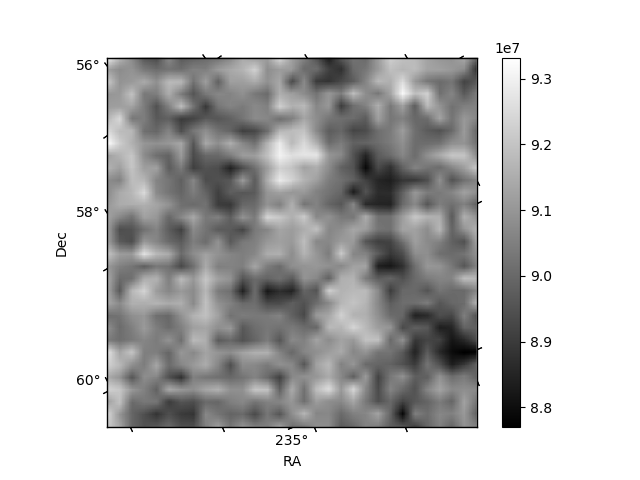
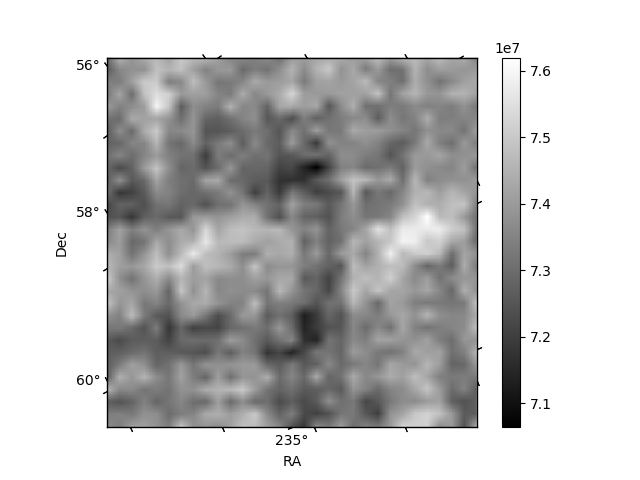
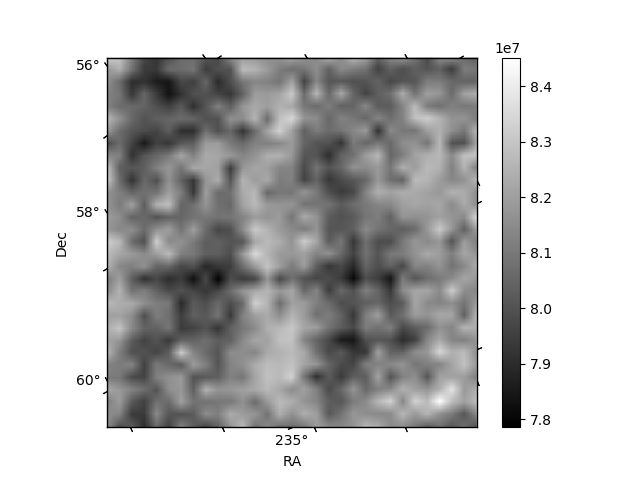
Histogram calculated using DETX and DETY for each event in the final _common_clean file
| Quadrant A | 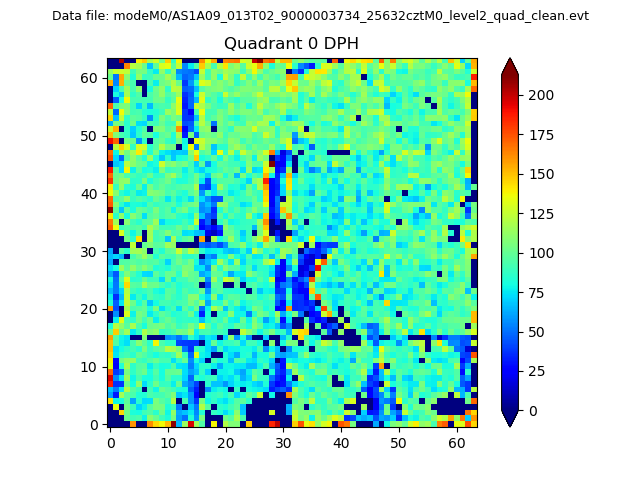 |
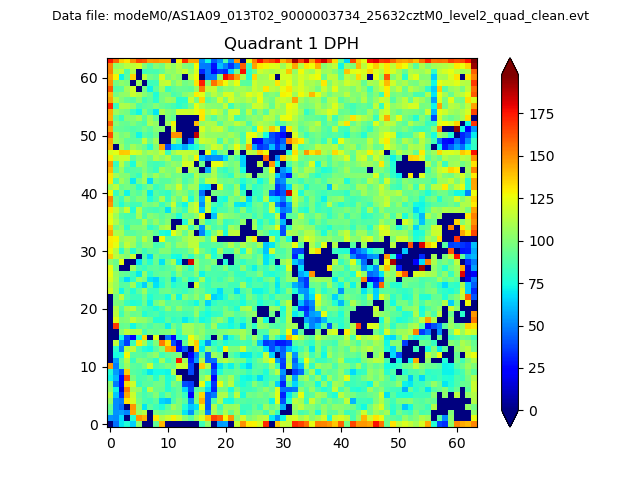 |
Quadrant B |
|---|---|---|---|
| Quadrant D | 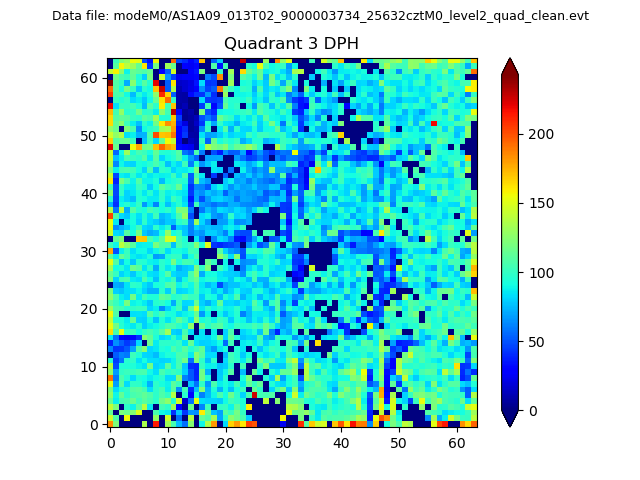 |
 |
Quadrant C |
| Plot type | Count rate plots | Images |
|---|---|---|
| Comparison with Poisson distribution Blue bars denote a histogram of data divided into 1 sec bins. Red curve is a Poisson curve with rate = median count rate of data. |
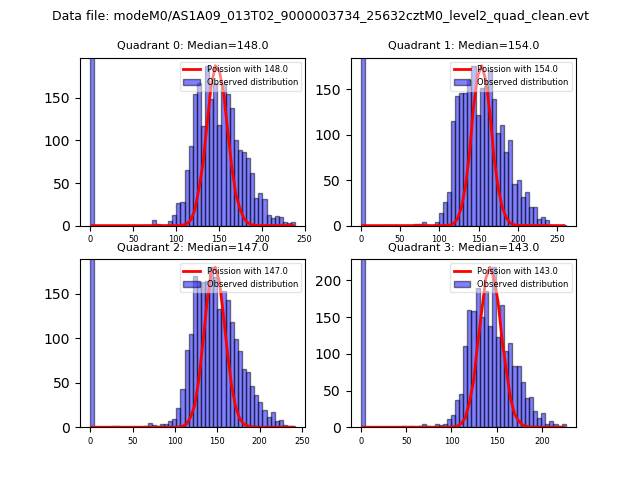 |
 |
| Quadrant-wise count rates Data is divided into 100 sec bins |
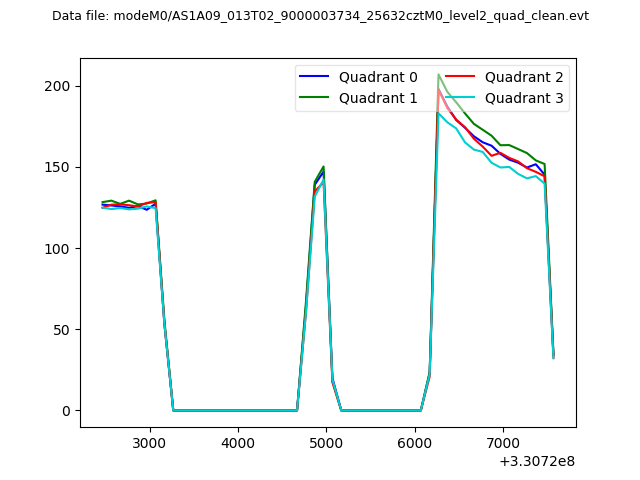 |
|
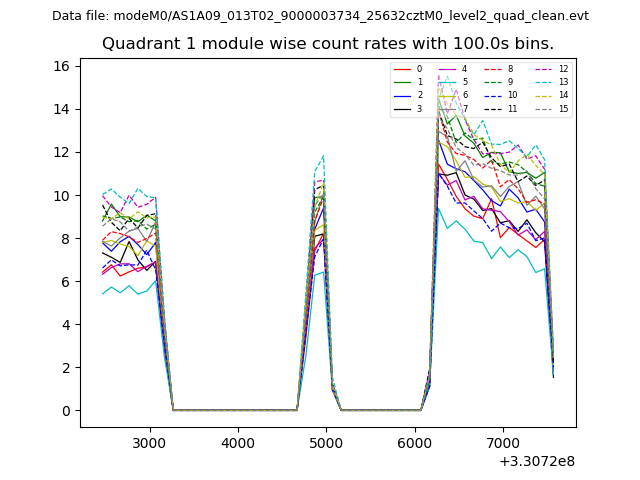
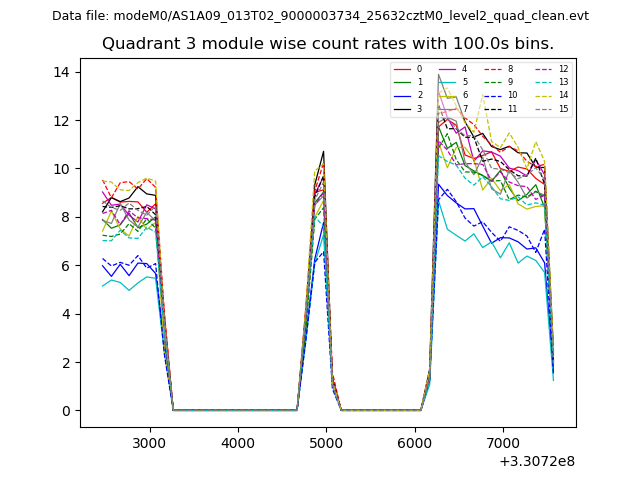
| Module-wise count rates for Quadrant A Data is divided into 100 sec bins |
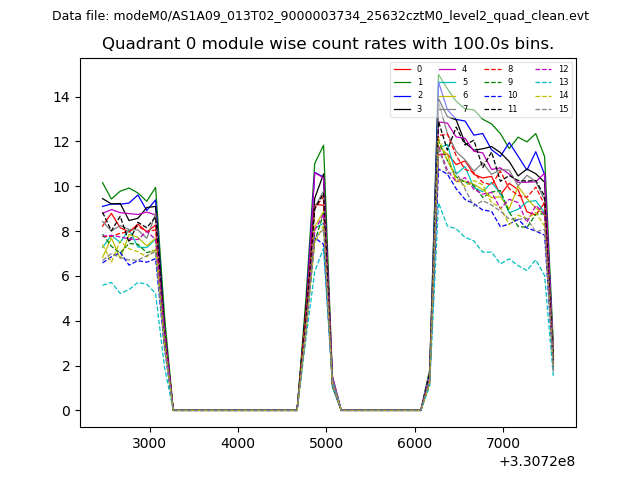 |
 |
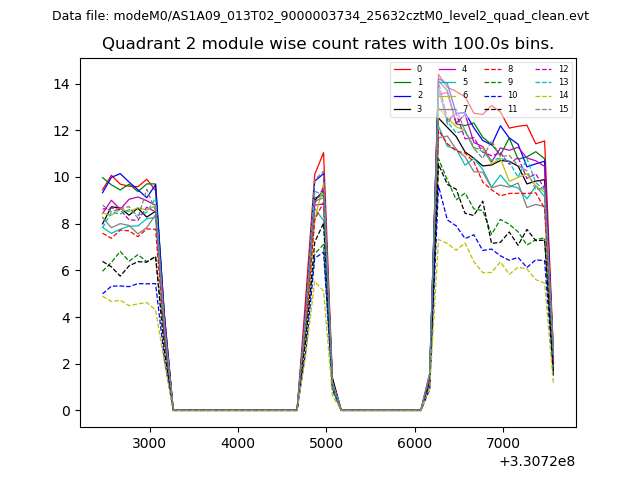
| Module-wise count rates for Quadrant B Data is divided into 100 sec bins |
 |
 |
| Module-wise count rates for Quadrant C Data is divided into 100 sec bins |
 |
 |
| Module-wise count rates for Quadrant D Data is divided into 100 sec bins |
 |
 |
| Parameter | Plot |
|---|---|
| CZT HV Monitor | 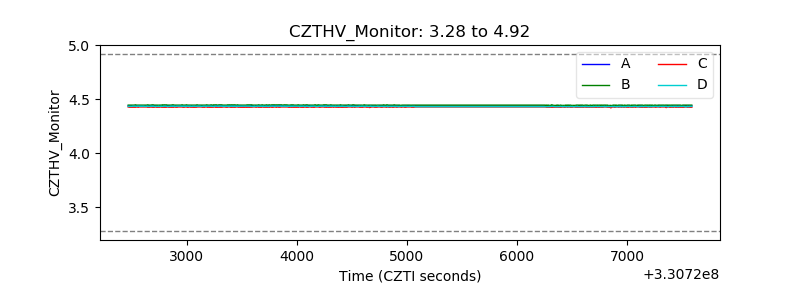 |
| D_VDD | 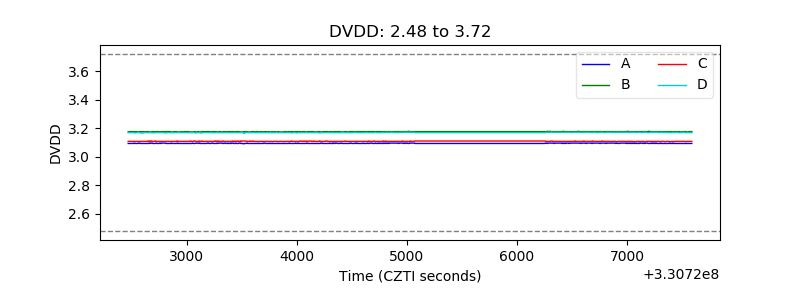 |
| Temperature 1 | 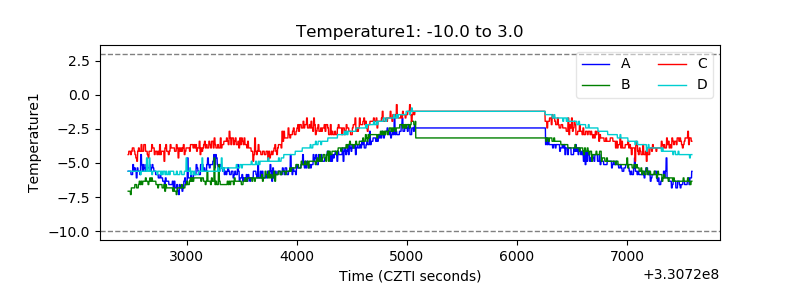 |
| Veto HV Monitor |  |
| Veto LLD | 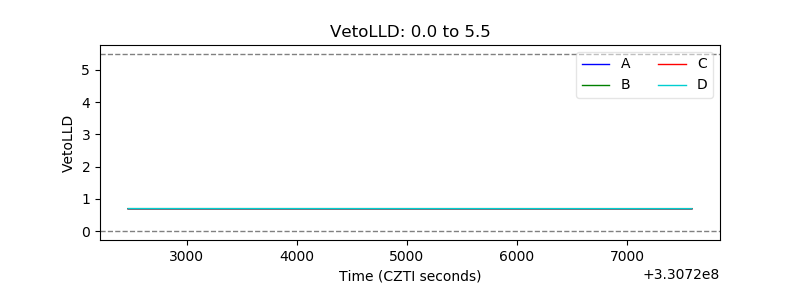 |
| Alpha Counter | 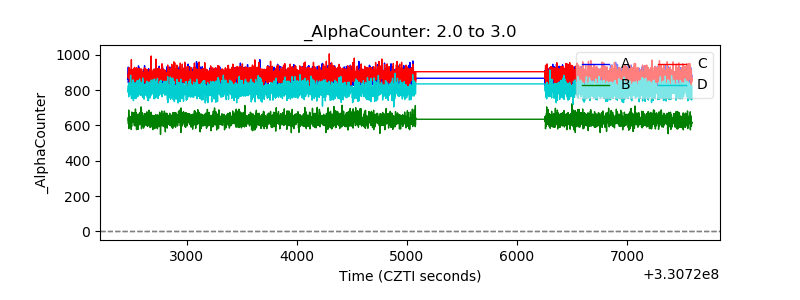 |
| _CPM_Rate | 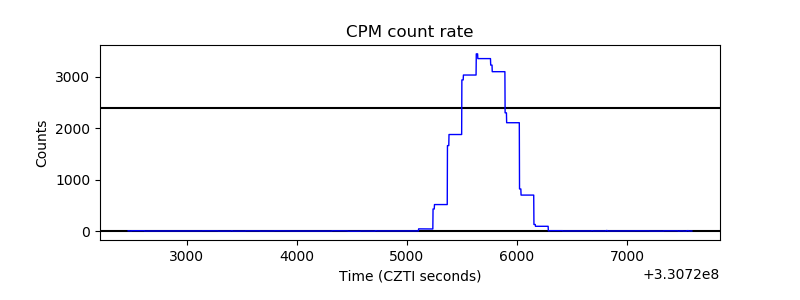 |
| CZT Counter |  |
| +2.5 Volts monitor |  |
| +5 Volts monitor |  |
| _ROLL_ROT | 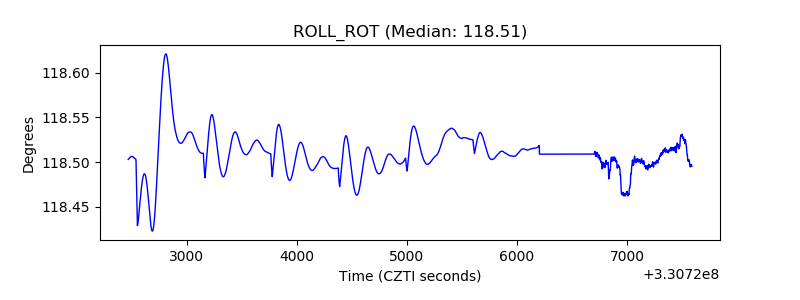 |
| _Roll_DEC | 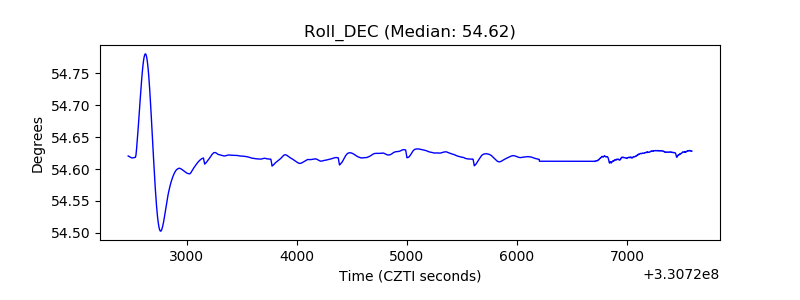 |
| _Roll_RA | 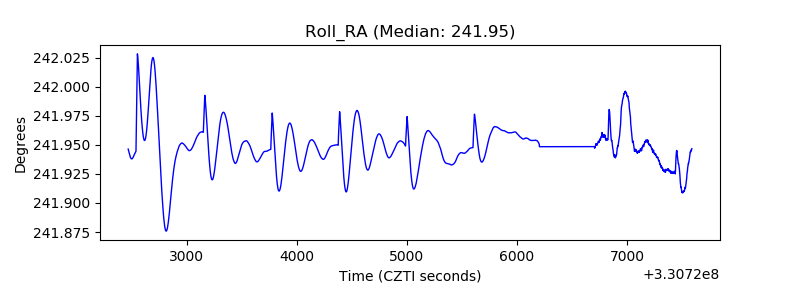 |
| Veto Counter | 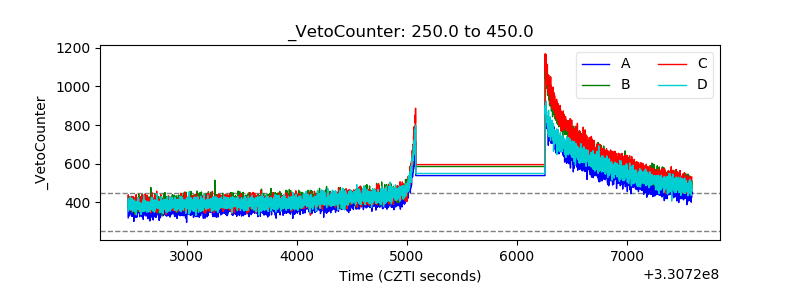 |