| Param | Original file | Final file |
|---|---|---|
| Filename | modeM0/AS1A09_013T02_9000003734_25633cztM0_level2.evt | modeM0/AS1A09_013T02_9000003734_25633cztM0_level2_quad_clean.evt |
| Size (bytes) | 454,847,040 | 108,630,720 |
| Size | 433.8 MB | 103.6 MB |
| Events in quadrant A | 3,282,917 | 719,727 |
| Events in quadrant B | 3,201,969 | 746,072 |
| Events in quadrant C | 3,207,118 | 708,955 |
| Events in quadrant D | 3,657,274 | 677,919 |
| Mode M9 | |||
|---|---|---|---|
| Quadrant | BADHDUFLAG | Total packets | Discarded packets |
| A | 0 | 18 | 0 |
| B | 0 | 19 | 0 |
| C | 0 | 19 | 0 |
| D | 0 | 19 | 0 |
| Mode M0 | |||
|---|---|---|---|
| Quadrant | BADHDUFLAG | Total packets | Discarded packets |
| A | 0 | 13653 | 0 |
| B | 0 | 13507 | 0 |
| C | 0 | 13594 | 0 |
| D | 0 | 15130 | 0 |
| Quadrant | Total seconds | Saturated seconds | Saturation percentage |
|---|---|---|---|
| A | 6265 | 25 | 0.399042% |
| B | 6265 | 34 | 0.542698% |
| C | 6265 | 75 | 1.197127% |
| D | 6265 | 74 | 1.181165% |
Noise dominated data is calculated using 1-second bins in cleaned event files. If a bin has >2000 counts, and if more than 50% of those come from <1% of pixels, then it is considered to be noise-dominated and hence unusable.
| Quadrant | # 1 sec bins | Bins with >0 counts | Bins with >2000 counts | High rate bins dominated by noise | Noise dominated (total time) | Noise dominated (detector-on time) | Marked lightcurve |
|---|---|---|---|---|---|---|---|
| A | 7555 | 6266 | 0 | 0 | 0.00% | 0.00% | 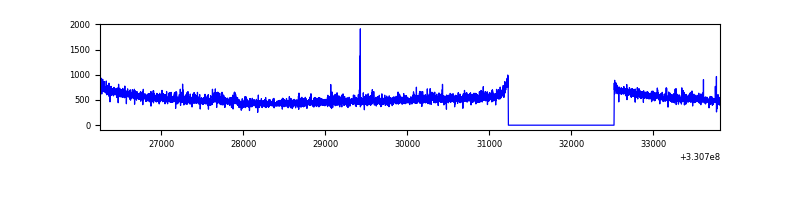 |
| B | 7555 | 6266 | 0 | 0 | 0.00% | 0.00% | 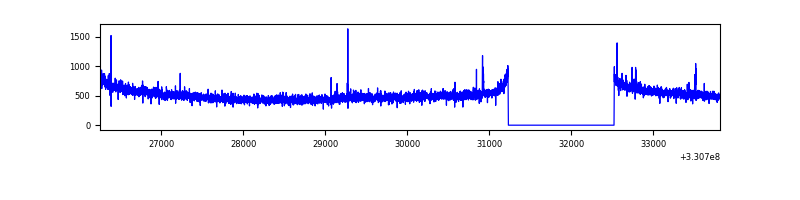 |
| C | 7555 | 6266 | 0 | 0 | 0.00% | 0.00% | 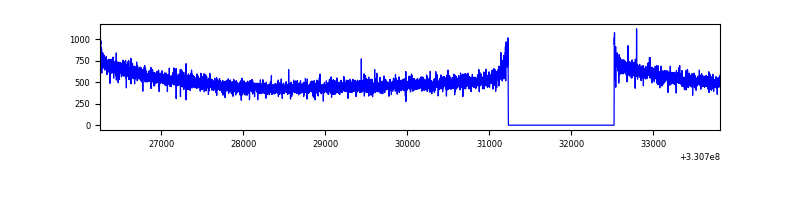 |
| D | 7555 | 6266 | 43 | 43 | 0.57% | 0.69% | 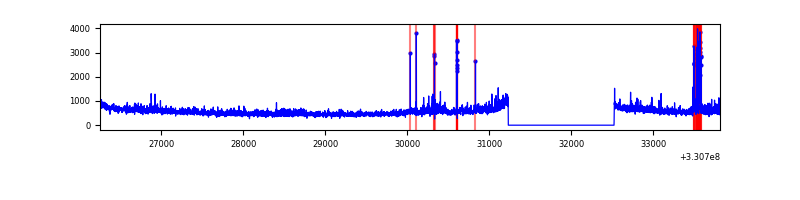 |
Top three noisy pixels from each quadrant. If the there are fewer than three noisy pixels in the level2.evt file, extra rows are filled as -1
| Pixel properties | Quadrant properties | ||||||
|---|---|---|---|---|---|---|---|
| Quadrant | DetID | PixID | Counts | Sigma | Mean | Median | Sigma |
| A | 8 | 192 | 182286 | 1146.32 | 801 | 787 | 158.3 |
| A | 0 | 13 | 11101 | 65.14 | 801 | 787 | 158.3 |
| A | 13 | 254 | 9728 | 56.47 | 801 | 787 | 158.3 |
| B | 12 | 111 | 17736 | 113.9 | 811 | 793 | 148.8 |
| B | 11 | 111 | 15751 | 100.55 | 811 | 793 | 148.8 |
| B | 14 | 111 | 14062 | 89.2 | 811 | 793 | 148.8 |
| C | 14 | 238 | 127678 | 699.8 | 788 | 796 | 181.3 |
| C | 3 | 233 | 8319 | 41.49 | 788 | 796 | 181.3 |
| C | 13 | 61 | 5509 | 25.99 | 788 | 796 | 181.3 |
| D | 8 | 195 | 424343 | 2270.25 | 781 | 761 | 186.6 |
| D | 13 | 104 | 114265 | 608.34 | 781 | 761 | 186.6 |
| D | 1 | 52 | 77392 | 410.72 | 781 | 761 | 186.6 |
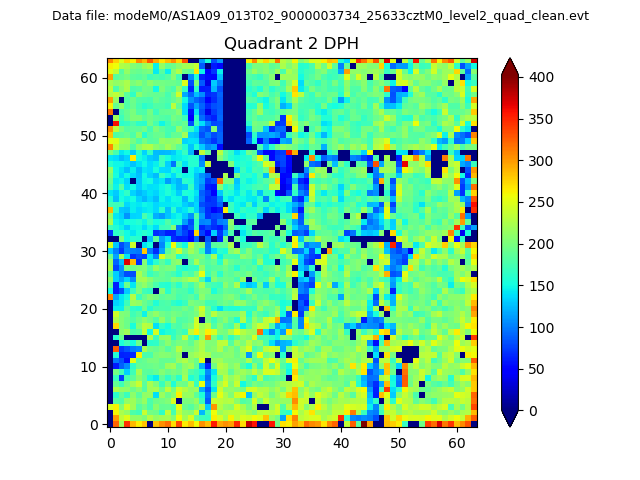
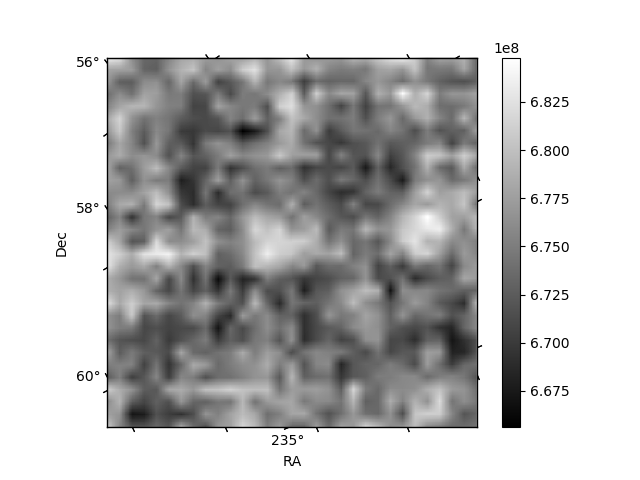
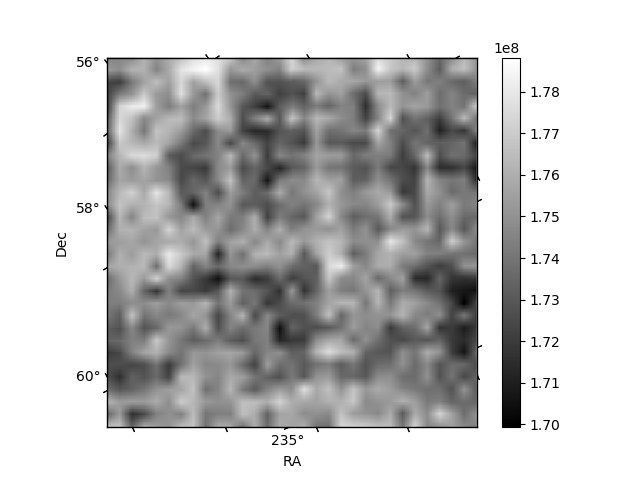
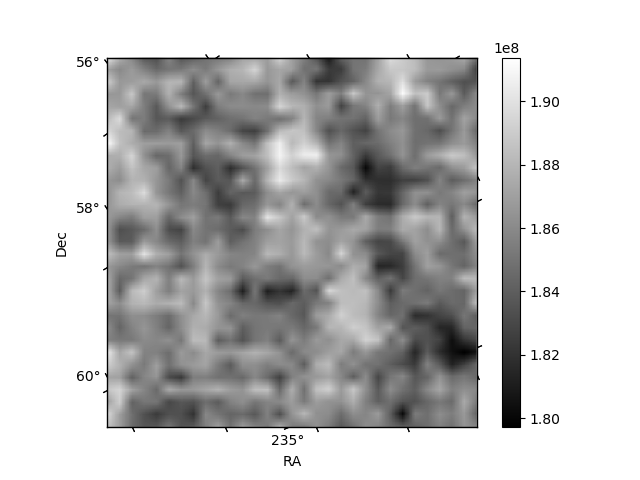
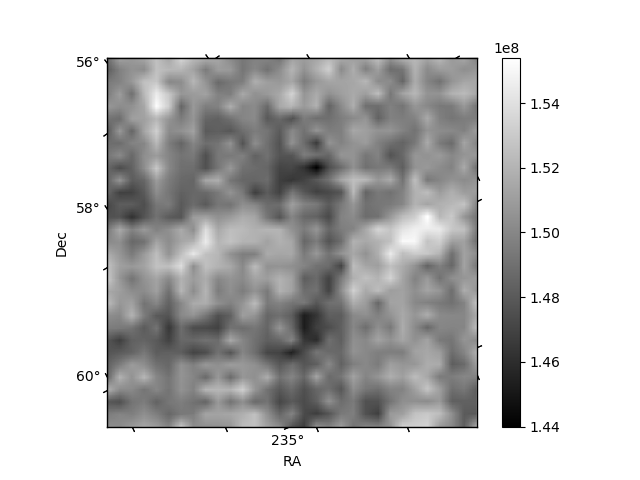
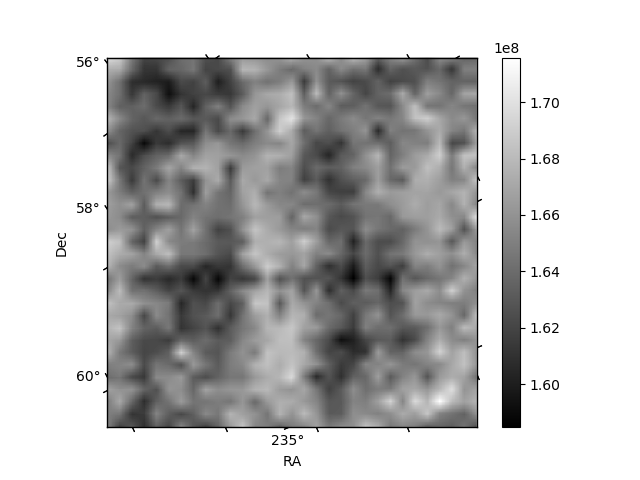
Histogram calculated using DETX and DETY for each event in the final _common_clean file
| Quadrant A | 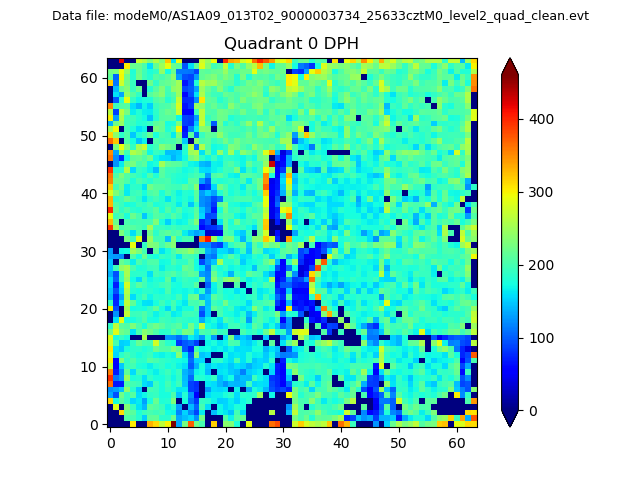 |
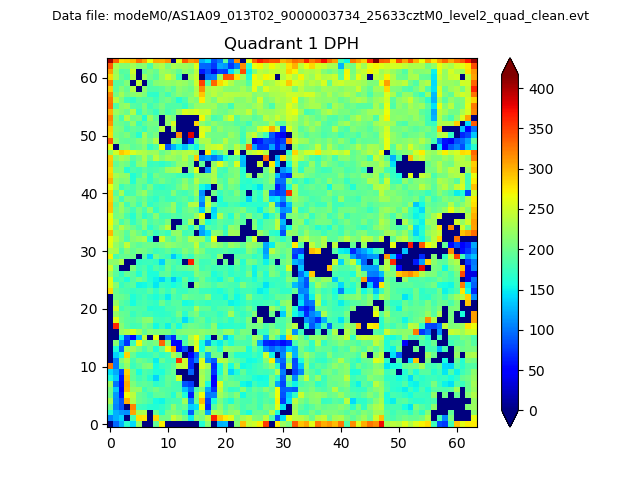 |
Quadrant B |
|---|---|---|---|
| Quadrant D | 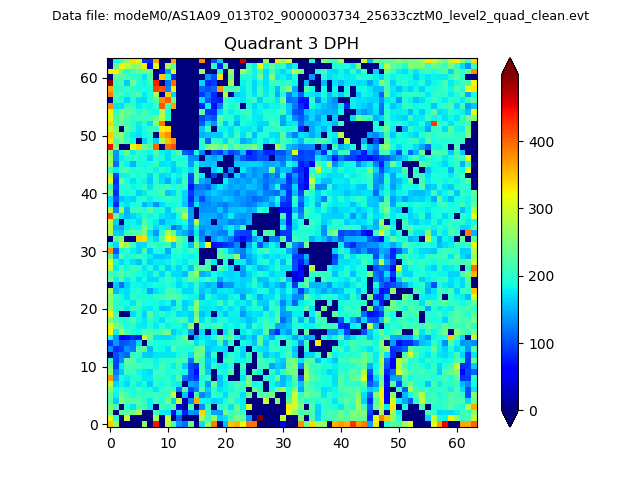 |
 |
Quadrant C |
| Plot type | Count rate plots | Images |
|---|---|---|
| Comparison with Poisson distribution Blue bars denote a histogram of data divided into 1 sec bins. Red curve is a Poisson curve with rate = median count rate of data. |
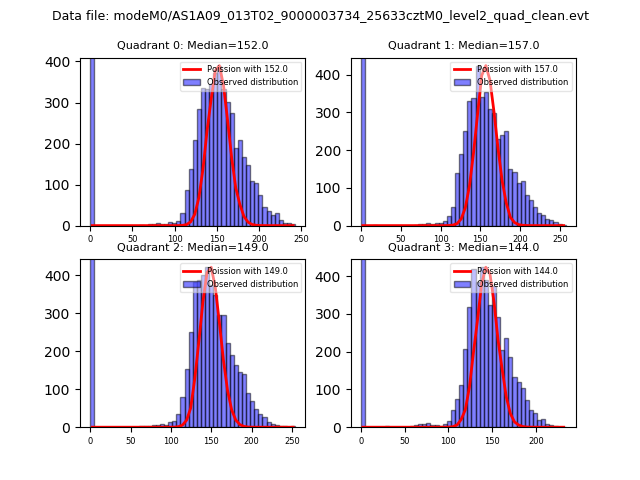 |
 |
| Quadrant-wise count rates Data is divided into 100 sec bins |
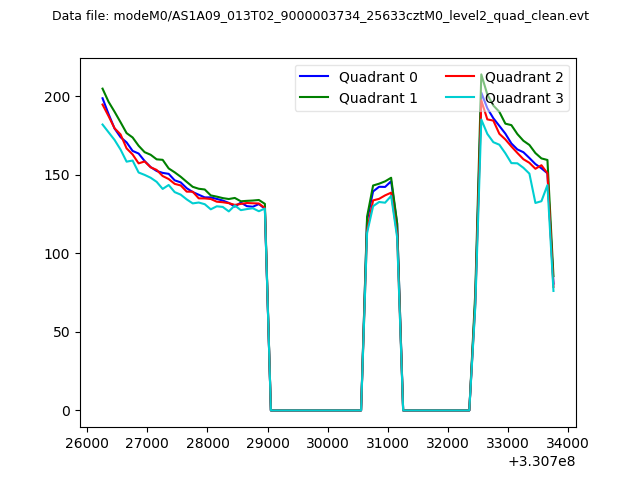 |
|
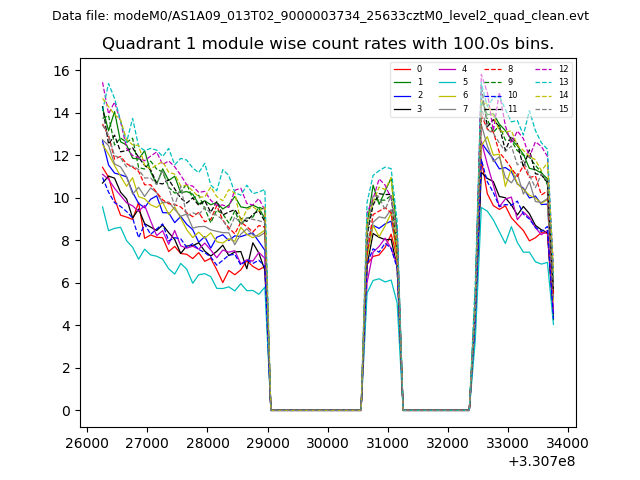
| Module-wise count rates for Quadrant A Data is divided into 100 sec bins |
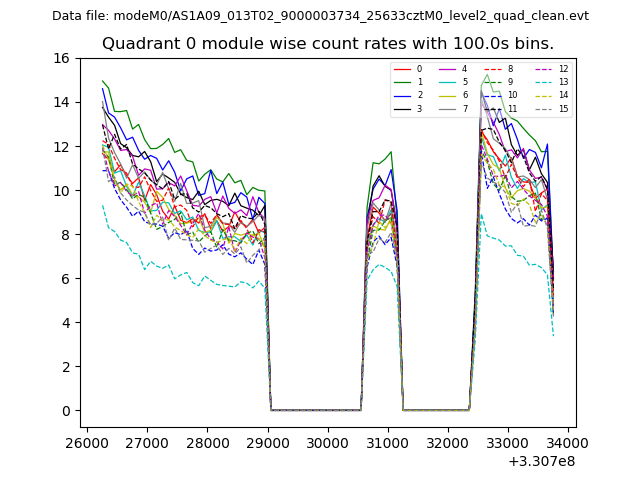 |
 |
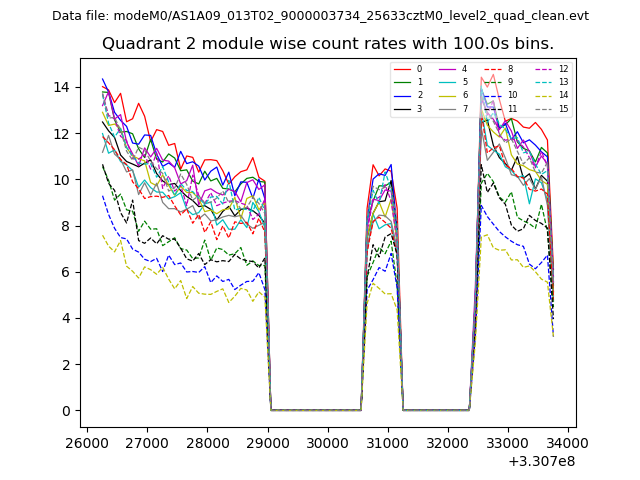
| Module-wise count rates for Quadrant B Data is divided into 100 sec bins |
 |
 |
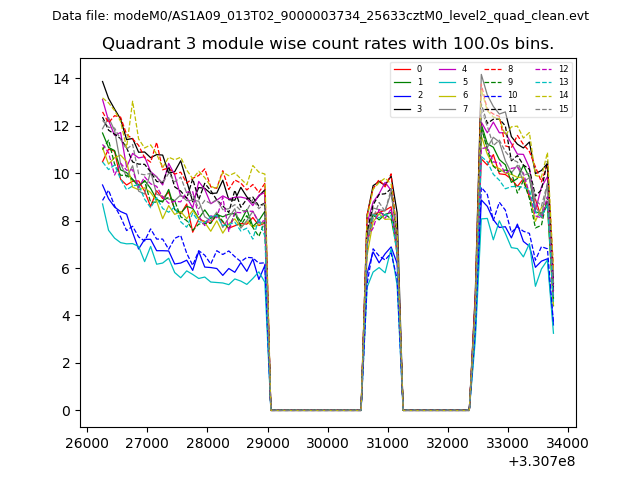
| Module-wise count rates for Quadrant C Data is divided into 100 sec bins |
 |
 |
| Module-wise count rates for Quadrant D Data is divided into 100 sec bins |
 |
 |
| Parameter | Plot |
|---|---|
| CZT HV Monitor | 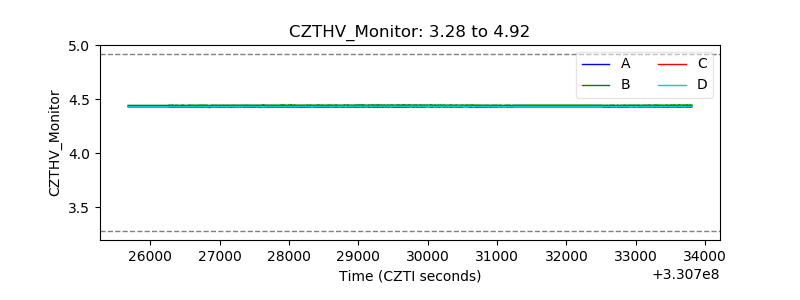 |
| D_VDD | 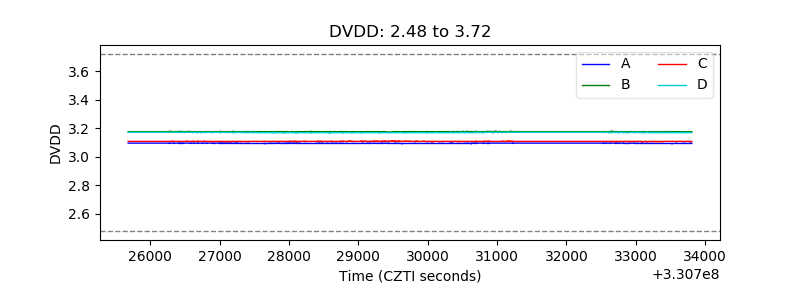 |
| Temperature 1 | 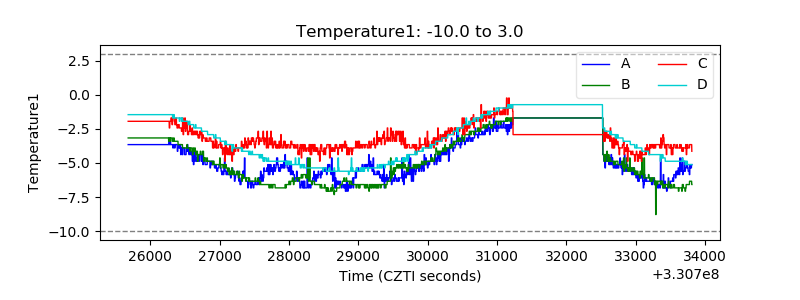 |
| Veto HV Monitor | 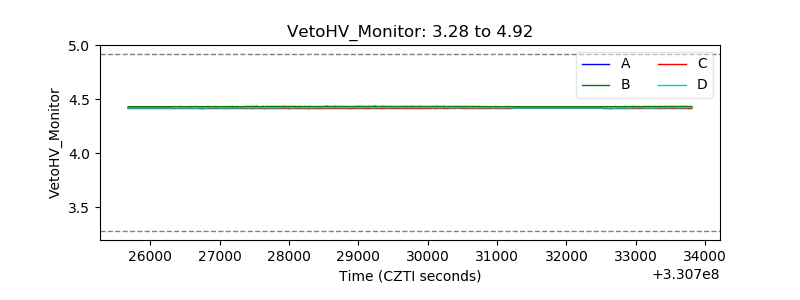 |
| Veto LLD | 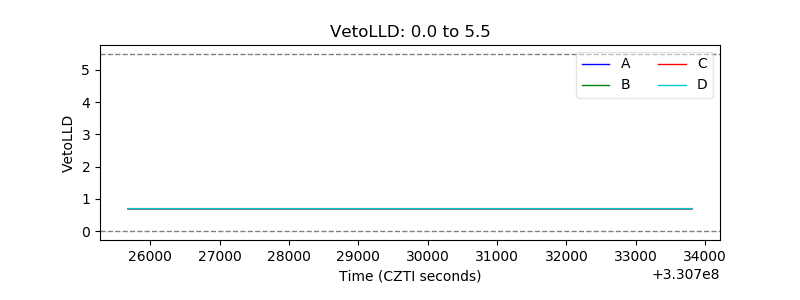 |
| Alpha Counter | 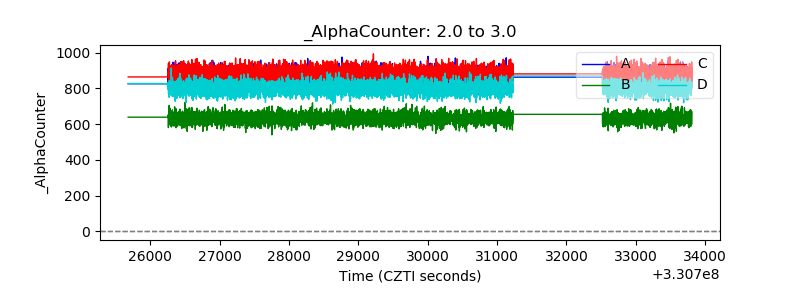 |
| _CPM_Rate | 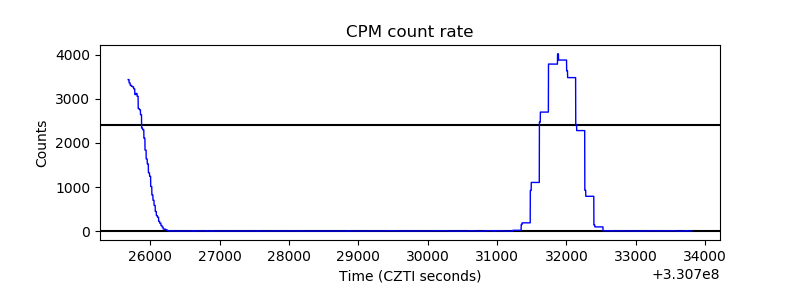 |
| CZT Counter | 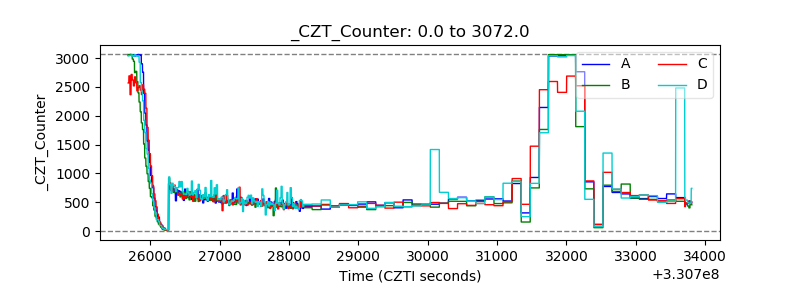 |
| +2.5 Volts monitor |  |
| +5 Volts monitor |  |
| _ROLL_ROT | 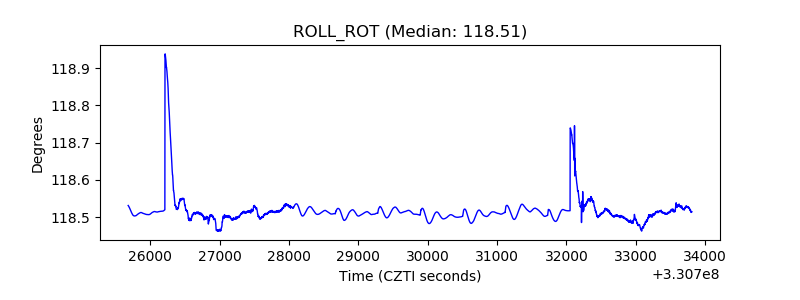 |
| _Roll_DEC | 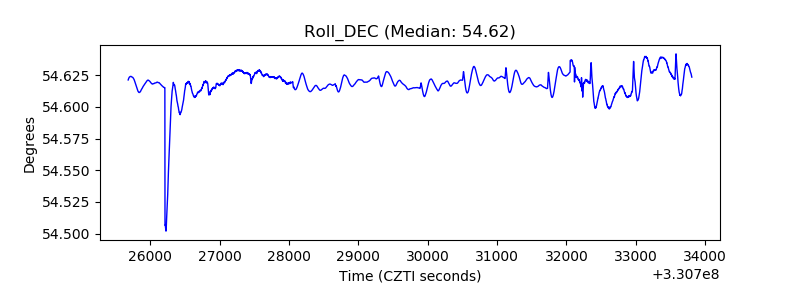 |
| _Roll_RA | 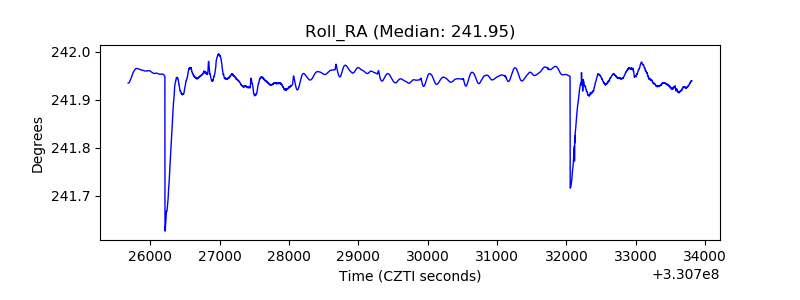 |
| Veto Counter | 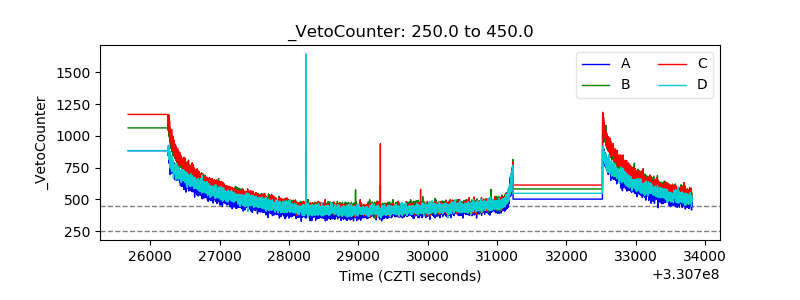 |