| Param | Original file | Final file |
|---|---|---|
| Filename | modeM0/AS1A09_013T02_9000003734_25636cztM0_level2.evt | modeM0/AS1A09_013T02_9000003734_25636cztM0_level2_quad_clean.evt |
| Size (bytes) | 461,940,480 | 102,156,480 |
| Size | 440.5 MB | 97.4 MB |
| Events in quadrant A | 3,315,036 | 676,509 |
| Events in quadrant B | 3,307,447 | 689,474 |
| Events in quadrant C | 3,215,852 | 648,778 |
| Events in quadrant D | 3,709,092 | 624,877 |
| Mode M9 | |||
|---|---|---|---|
| Quadrant | BADHDUFLAG | Total packets | Discarded packets |
| A | 0 | 24 | 0 |
| B | 0 | 24 | 0 |
| C | 0 | 25 | 0 |
| D | 0 | 25 | 0 |
| Mode M0 | |||
|---|---|---|---|
| Quadrant | BADHDUFLAG | Total packets | Discarded packets |
| A | 0 | 13631 | 0 |
| B | 0 | 13768 | 0 |
| C | 0 | 13592 | 0 |
| D | 0 | 15212 | 0 |
| Quadrant | Total seconds | Saturated seconds | Saturation percentage |
|---|---|---|---|
| A | 6514 | 21 | 0.322383% |
| B | 6513 | 64 | 0.982650% |
| C | 6513 | 55 | 0.844465% |
| D | 6514 | 137 | 2.103162% |
Noise dominated data is calculated using 1-second bins in cleaned event files. If a bin has >2000 counts, and if more than 50% of those come from <1% of pixels, then it is considered to be noise-dominated and hence unusable.
| Quadrant | # 1 sec bins | Bins with >0 counts | Bins with >2000 counts | High rate bins dominated by noise | Noise dominated (total time) | Noise dominated (detector-on time) | Marked lightcurve |
|---|---|---|---|---|---|---|---|
| A | 7819 | 6515 | 0 | 0 | 0.00% | 0.00% | 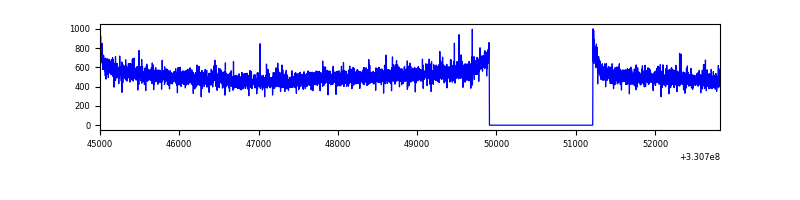 |
| B | 7819 | 6515 | 10 | 10 | 0.13% | 0.15% | 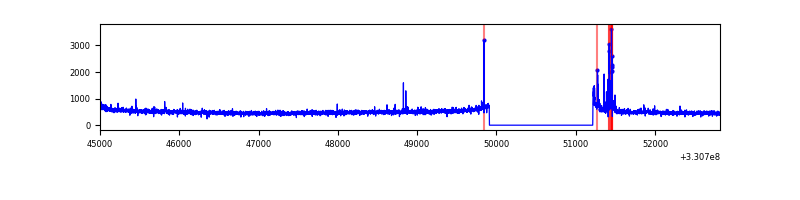 |
| C | 7819 | 6515 | 0 | 0 | 0.00% | 0.00% | 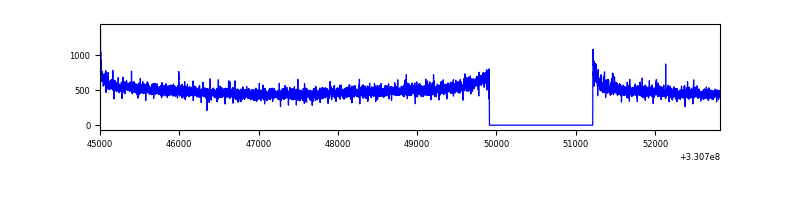 |
| D | 7819 | 6515 | 121 | 121 | 1.55% | 1.86% | 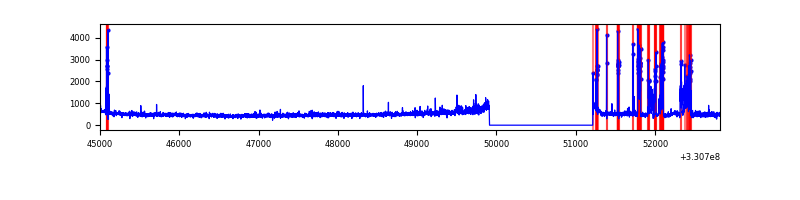 |
Top three noisy pixels from each quadrant. If the there are fewer than three noisy pixels in the level2.evt file, extra rows are filled as -1
| Pixel properties | Quadrant properties | ||||||
|---|---|---|---|---|---|---|---|
| Quadrant | DetID | PixID | Counts | Sigma | Mean | Median | Sigma |
| A | 8 | 192 | 155415 | 959.71 | 820 | 804 | 161.1 |
| A | 13 | 254 | 9793 | 55.8 | 820 | 804 | 161.1 |
| A | 3 | 137 | 7231 | 39.89 | 820 | 804 | 161.1 |
| B | 3 | 64 | 81948 | 532.27 | 822 | 802 | 152.5 |
| B | 12 | 111 | 18348 | 115.09 | 822 | 802 | 152.5 |
| B | 11 | 111 | 16360 | 102.05 | 822 | 802 | 152.5 |
| C | 14 | 238 | 128427 | 702.82 | 784 | 790 | 181.6 |
| C | 3 | 233 | 33738 | 181.43 | 784 | 790 | 181.6 |
| C | 13 | 61 | 5355 | 25.14 | 784 | 790 | 181.6 |
| D | 1 | 52 | 506727 | 2483.49 | 769 | 753 | 203.7 |
| D | 8 | 195 | 217774 | 1065.21 | 769 | 753 | 203.7 |
| D | 13 | 104 | 31964 | 153.19 | 769 | 753 | 203.7 |
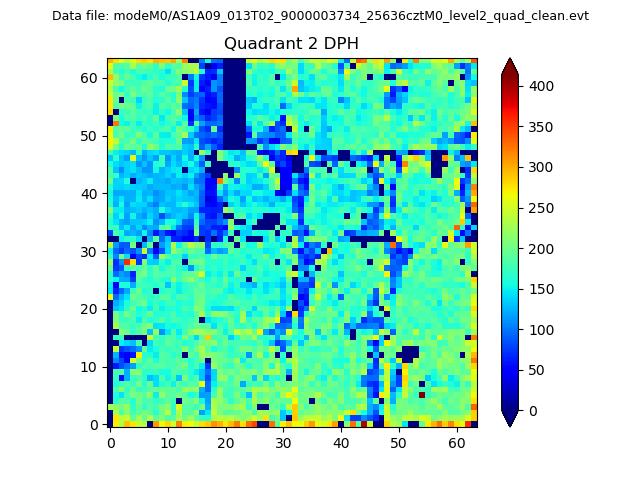
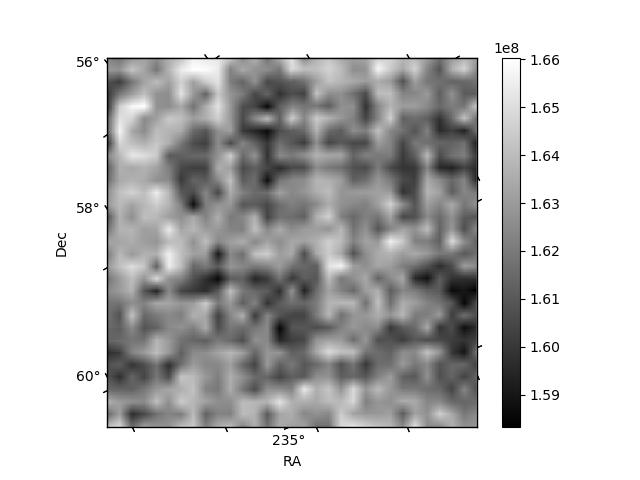
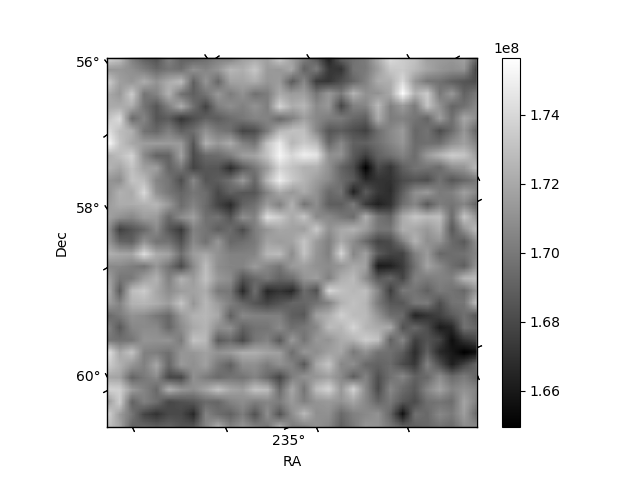
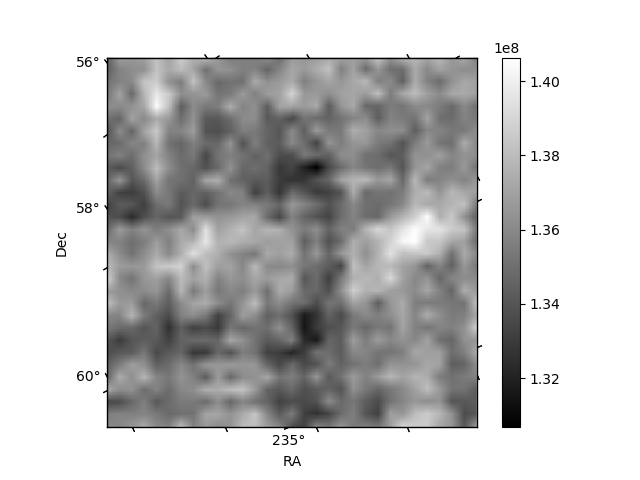
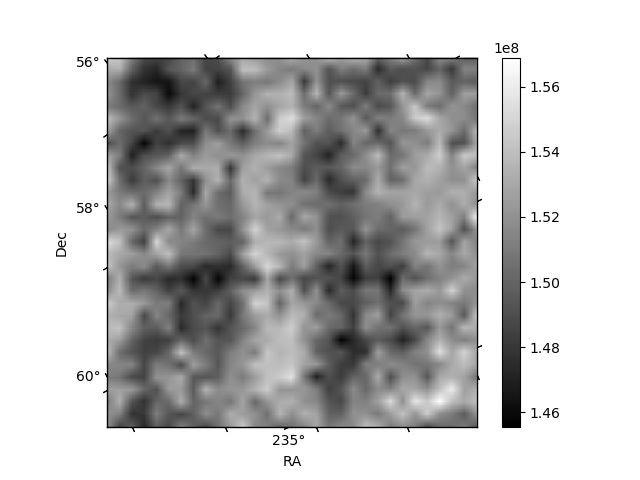
Histogram calculated using DETX and DETY for each event in the final _common_clean file
| Quadrant A | 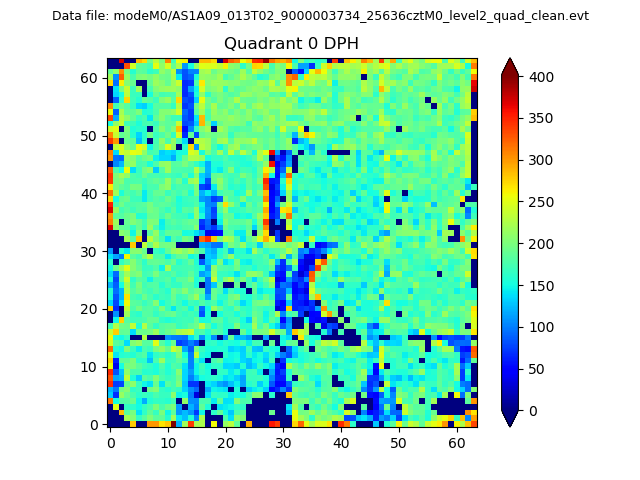 |
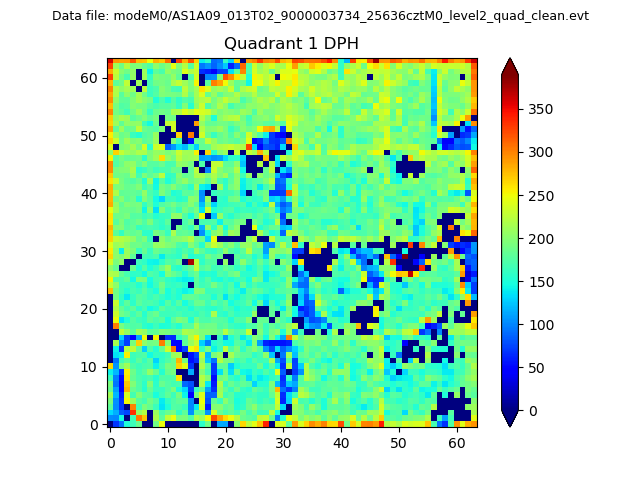 |
Quadrant B |
|---|---|---|---|
| Quadrant D | 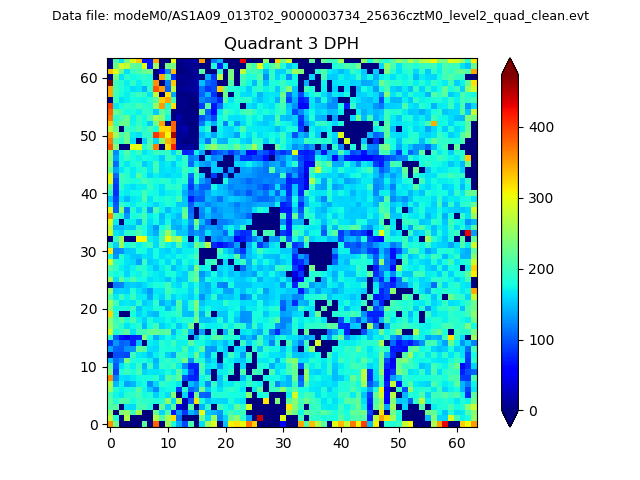 |
 |
Quadrant C |
| Plot type | Count rate plots | Images |
|---|---|---|
| Comparison with Poisson distribution Blue bars denote a histogram of data divided into 1 sec bins. Red curve is a Poisson curve with rate = median count rate of data. |
 |
 |
| Quadrant-wise count rates Data is divided into 100 sec bins |
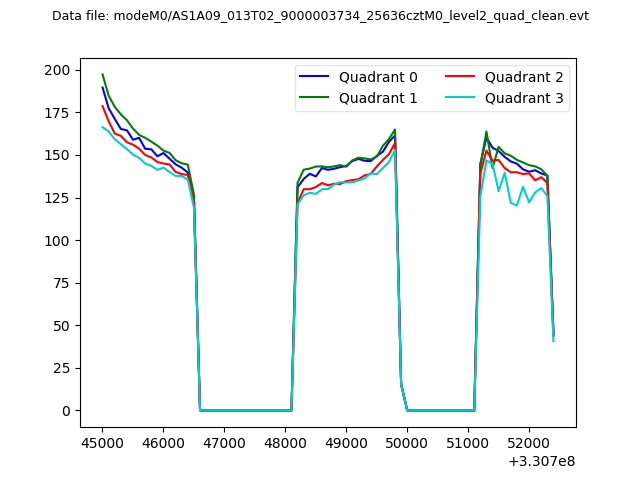 |
|
| Module-wise count rates for Quadrant A Data is divided into 100 sec bins |
 |
 |
| Module-wise count rates for Quadrant B Data is divided into 100 sec bins |
 |
 |
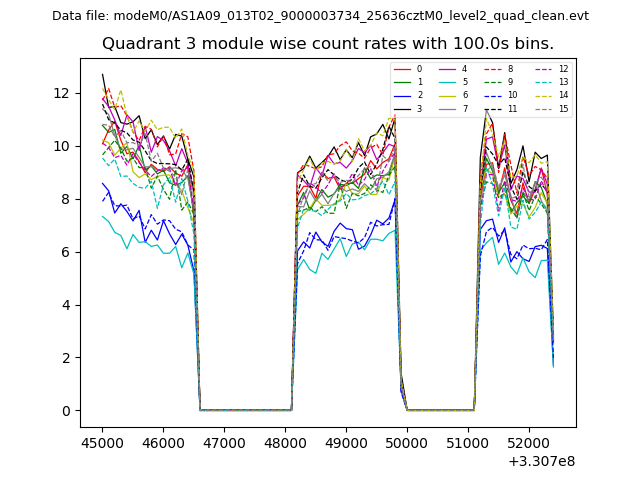
| Module-wise count rates for Quadrant C Data is divided into 100 sec bins |
 |
 |
| Module-wise count rates for Quadrant D Data is divided into 100 sec bins |
 |
 |
| Parameter | Plot |
|---|---|
| CZT HV Monitor | 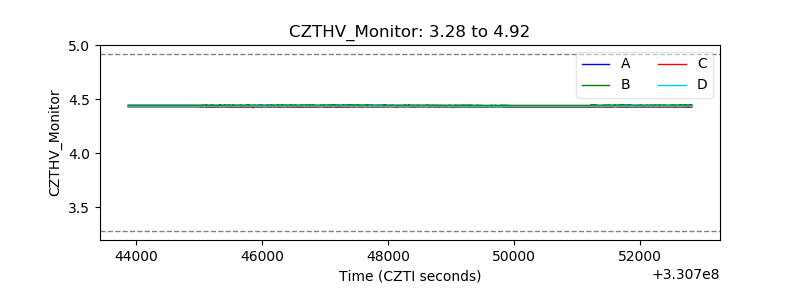 |
| D_VDD | 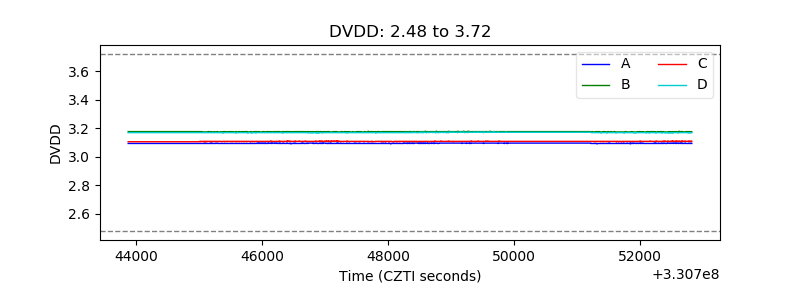 |
| Temperature 1 | 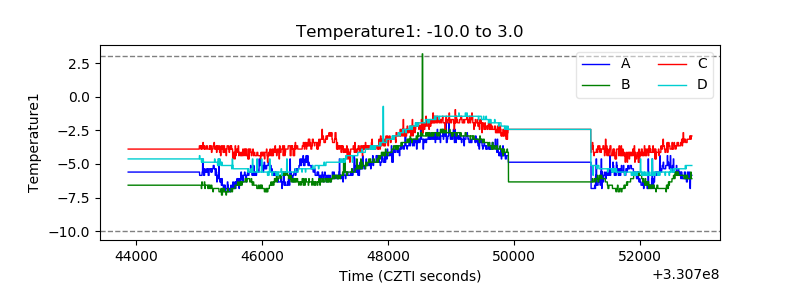 |
| Veto HV Monitor | 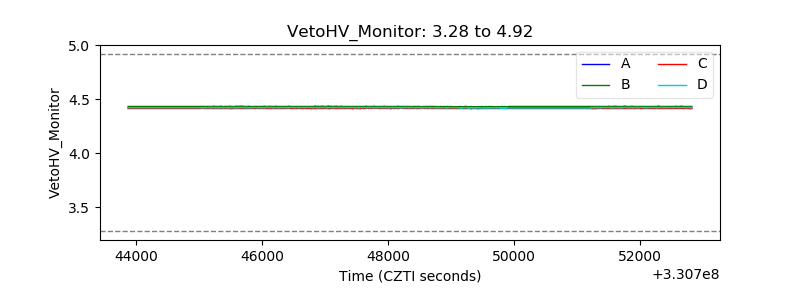 |
| Veto LLD | 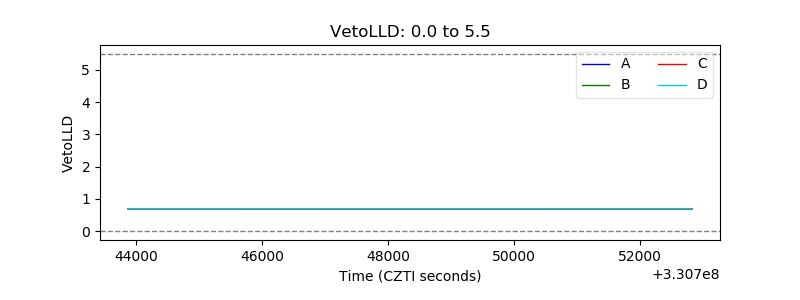 |
| Alpha Counter | 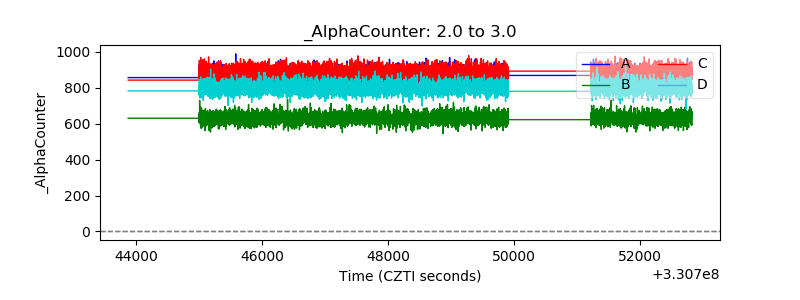 |
| _CPM_Rate | 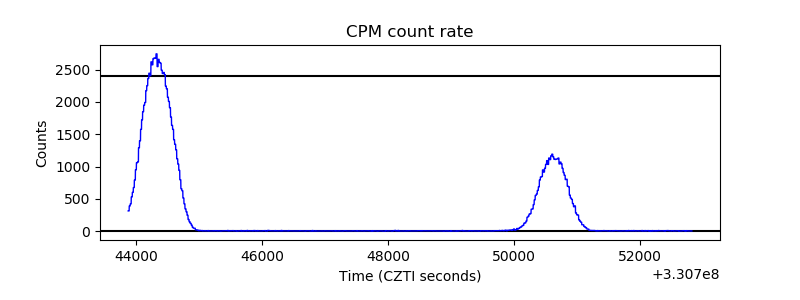 |
| CZT Counter |  |
| +2.5 Volts monitor |  |
| +5 Volts monitor |  |
| _ROLL_ROT |  |
| _Roll_DEC |  |
| _Roll_RA |  |
| Veto Counter |  |