| Param | Original file | Final file |
|---|---|---|
| Filename | modeM0/AS1A09_013T02_9000003734_25637cztM0_level2.evt | modeM0/AS1A09_013T02_9000003734_25637cztM0_level2_quad_clean.evt |
| Size (bytes) | 484,084,800 | 97,110,720 |
| Size | 461.7 MB | 92.6 MB |
| Events in quadrant A | 3,438,306 | 628,433 |
| Events in quadrant B | 3,426,414 | 640,723 |
| Events in quadrant C | 3,344,327 | 604,217 |
| Events in quadrant D | 3,982,878 | 586,982 |
| Mode M9 | |||
|---|---|---|---|
| Quadrant | BADHDUFLAG | Total packets | Discarded packets |
| A | 0 | 13 | 0 |
| B | 0 | 14 | 0 |
| C | 0 | 14 | 0 |
| D | 0 | 14 | 0 |
| Mode M0 | |||
|---|---|---|---|
| Quadrant | BADHDUFLAG | Total packets | Discarded packets |
| A | 0 | 14234 | 0 |
| B | 0 | 14508 | 0 |
| C | 0 | 14303 | 0 |
| D | 0 | 16265 | 0 |
| Quadrant | Total seconds | Saturated seconds | Saturation percentage |
|---|---|---|---|
| A | 6891 | 63 | 0.914236% |
| B | 6891 | 126 | 1.828472% |
| C | 6891 | 104 | 1.509215% |
| D | 6891 | 157 | 2.278334% |
Noise dominated data is calculated using 1-second bins in cleaned event files. If a bin has >2000 counts, and if more than 50% of those come from <1% of pixels, then it is considered to be noise-dominated and hence unusable.
| Quadrant | # 1 sec bins | Bins with >0 counts | Bins with >2000 counts | High rate bins dominated by noise | Noise dominated (total time) | Noise dominated (detector-on time) | Marked lightcurve |
|---|---|---|---|---|---|---|---|
| A | 7872 | 6892 | 0 | 0 | 0.00% | 0.00% | 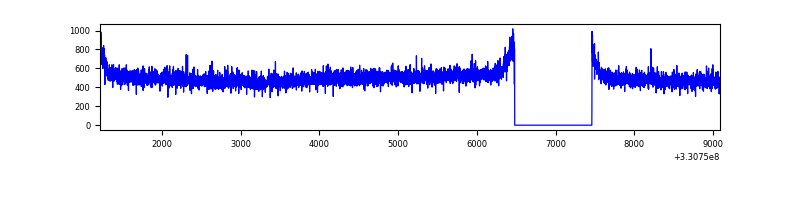 |
| B | 7872 | 6892 | 10 | 10 | 0.13% | 0.15% | 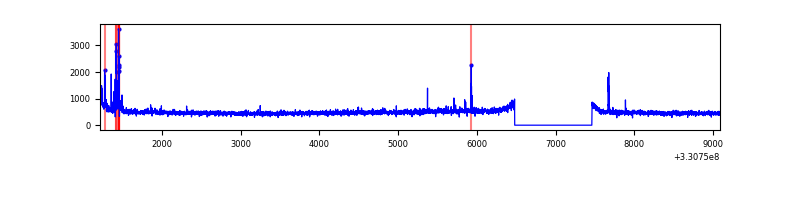 |
| C | 7872 | 6892 | 3 | 3 | 0.04% | 0.04% | 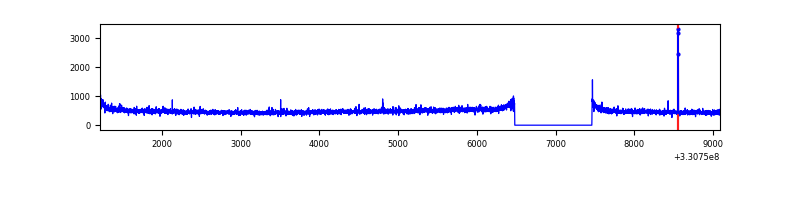 |
| D | 7872 | 6892 | 118 | 118 | 1.50% | 1.71% | 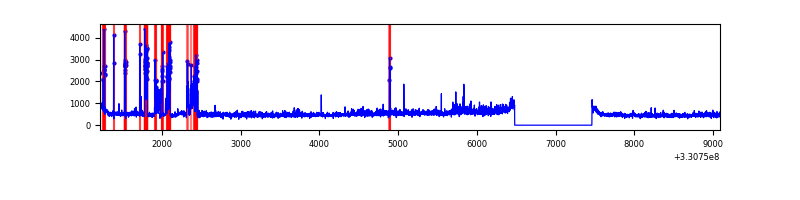 |
Top three noisy pixels from each quadrant. If the there are fewer than three noisy pixels in the level2.evt file, extra rows are filled as -1
| Pixel properties | Quadrant properties | ||||||
|---|---|---|---|---|---|---|---|
| Quadrant | DetID | PixID | Counts | Sigma | Mean | Median | Sigma |
| A | 8 | 192 | 170475 | 1003.08 | 846 | 830 | 169.1 |
| A | 13 | 254 | 10473 | 57.02 | 846 | 830 | 169.1 |
| A | 3 | 137 | 7651 | 40.33 | 846 | 830 | 169.1 |
| B | 3 | 64 | 87370 | 544.38 | 844 | 824 | 159.0 |
| B | 3 | 112 | 22533 | 136.55 | 844 | 824 | 159.0 |
| B | 12 | 111 | 19313 | 116.3 | 844 | 824 | 159.0 |
| C | 14 | 238 | 130177 | 689.38 | 810 | 815 | 187.6 |
| C | 3 | 233 | 59374 | 312.07 | 810 | 815 | 187.6 |
| C | 13 | 61 | 5585 | 25.42 | 810 | 815 | 187.6 |
| D | 1 | 52 | 526955 | 2568.58 | 804 | 783 | 204.8 |
| D | 8 | 195 | 373744 | 1820.66 | 804 | 783 | 204.8 |
| D | 2 | 234 | 23289 | 109.87 | 804 | 783 | 204.8 |
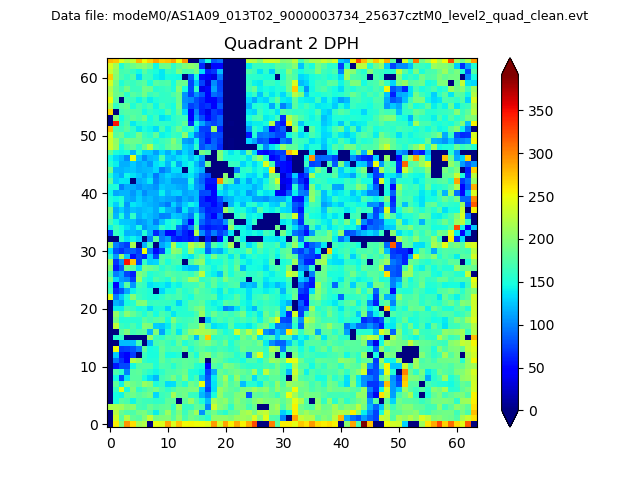
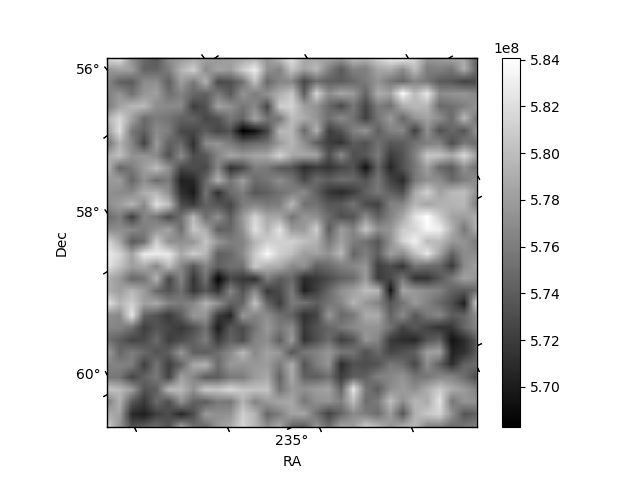
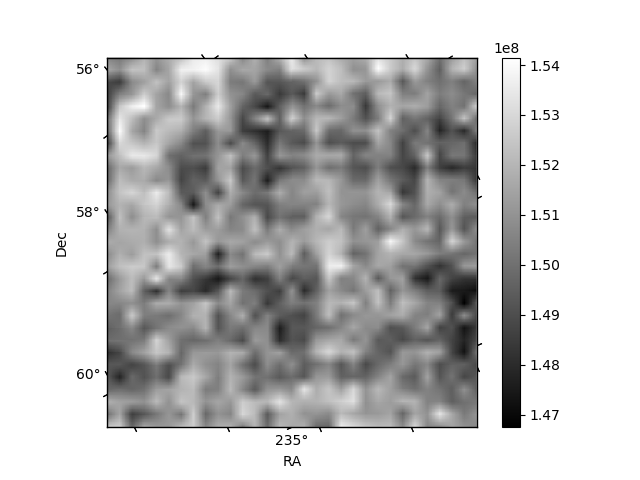
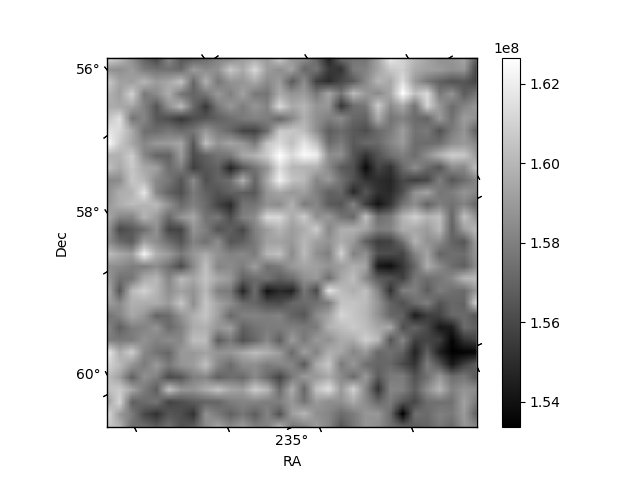
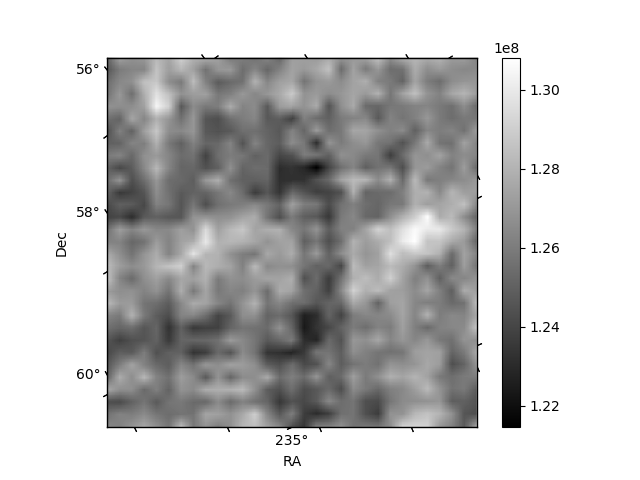
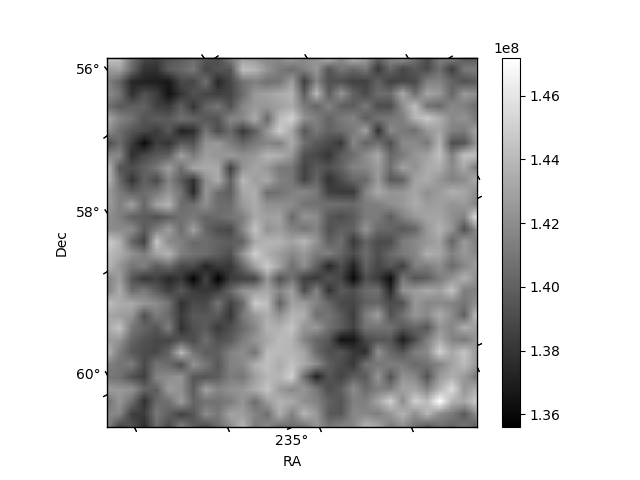
Histogram calculated using DETX and DETY for each event in the final _common_clean file
| Quadrant A | 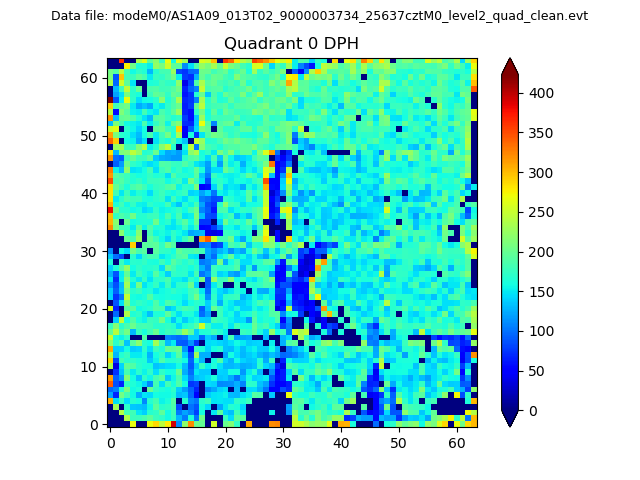 |
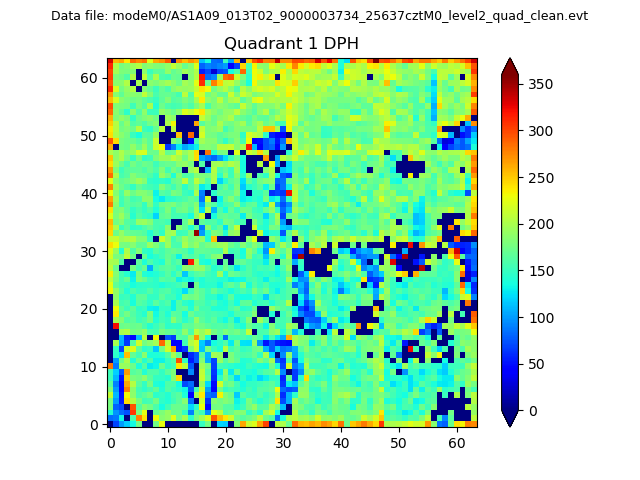 |
Quadrant B |
|---|---|---|---|
| Quadrant D | 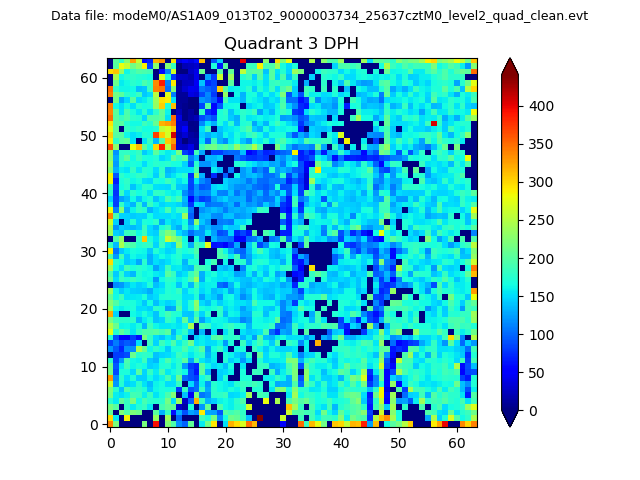 |
 |
Quadrant C |
| Plot type | Count rate plots | Images |
|---|---|---|
| Comparison with Poisson distribution Blue bars denote a histogram of data divided into 1 sec bins. Red curve is a Poisson curve with rate = median count rate of data. |
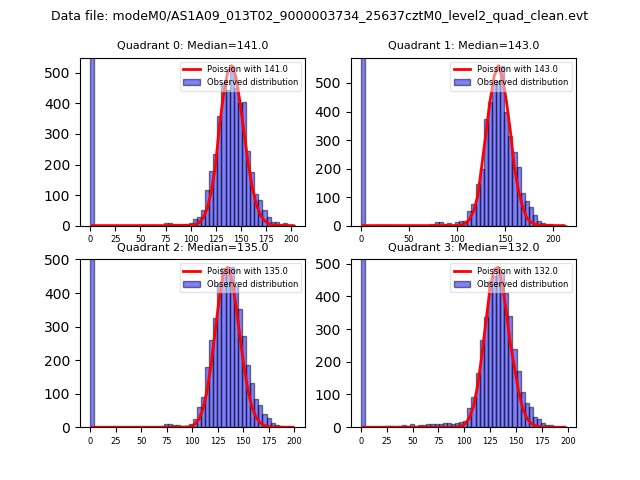 |
 |
| Quadrant-wise count rates Data is divided into 100 sec bins |
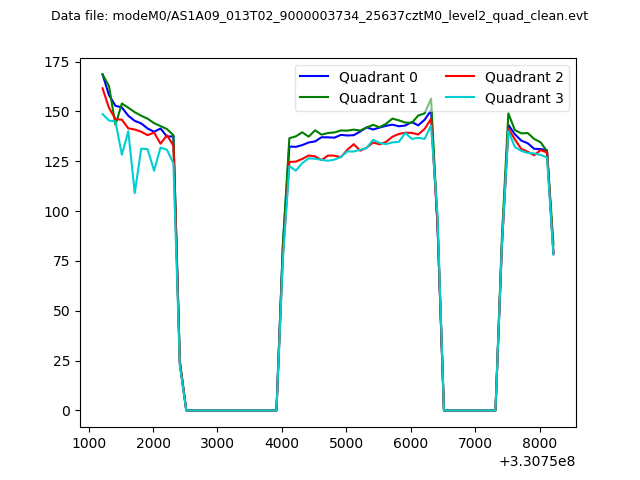 |
|
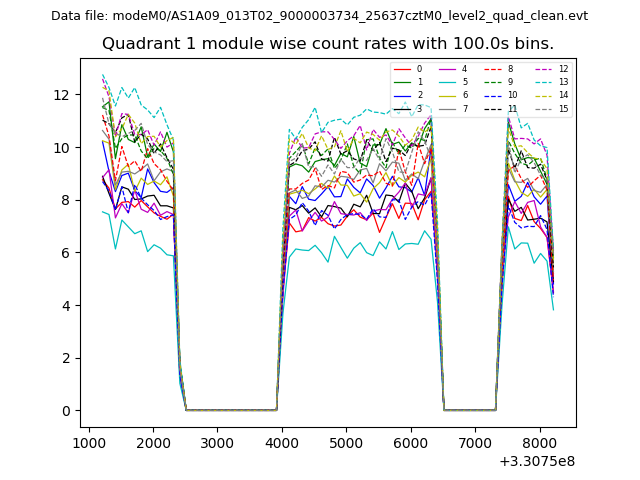
| Module-wise count rates for Quadrant A Data is divided into 100 sec bins |
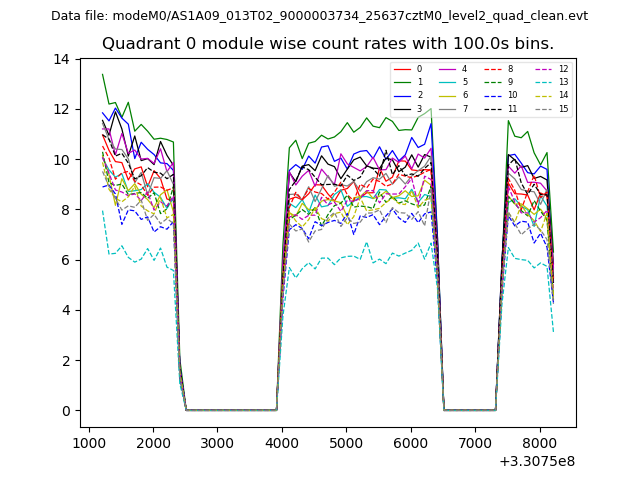 |
 |
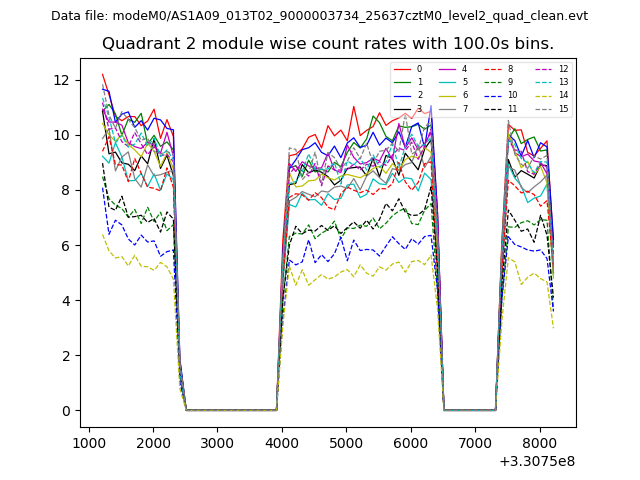
| Module-wise count rates for Quadrant B Data is divided into 100 sec bins |
 |
 |
| Module-wise count rates for Quadrant C Data is divided into 100 sec bins |
 |
 |
| Module-wise count rates for Quadrant D Data is divided into 100 sec bins |
 |
 |
| Parameter | Plot |
|---|---|
| CZT HV Monitor |  |
| D_VDD | 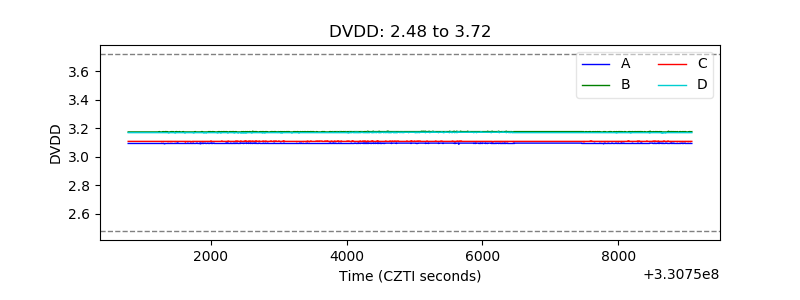 |
| Temperature 1 | 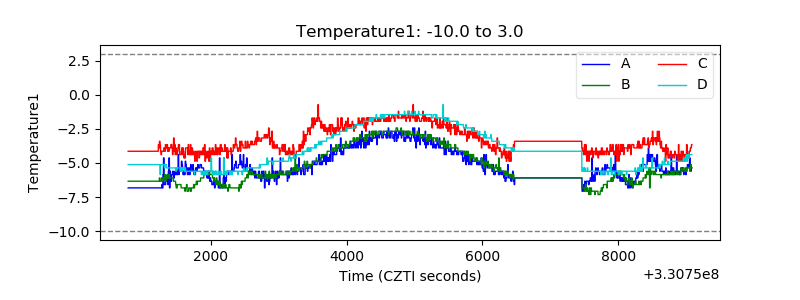 |
| Veto HV Monitor | 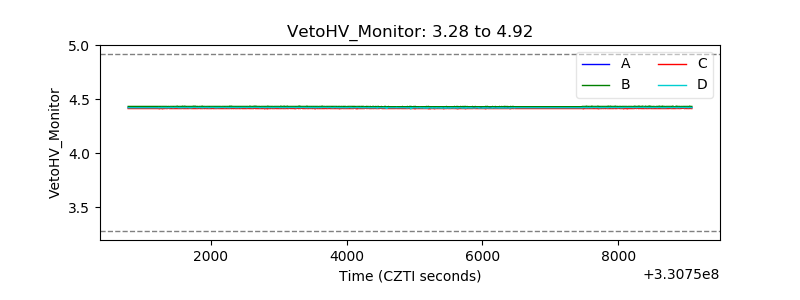 |
| Veto LLD | 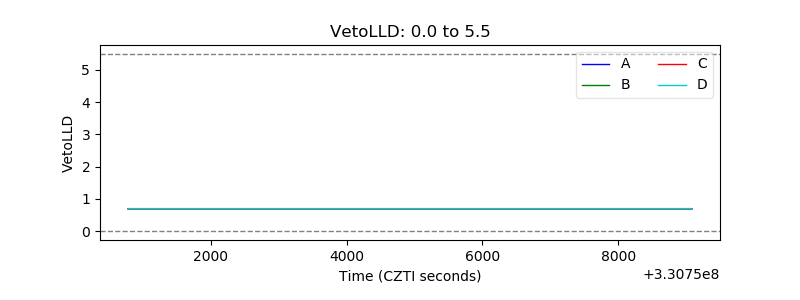 |
| Alpha Counter | 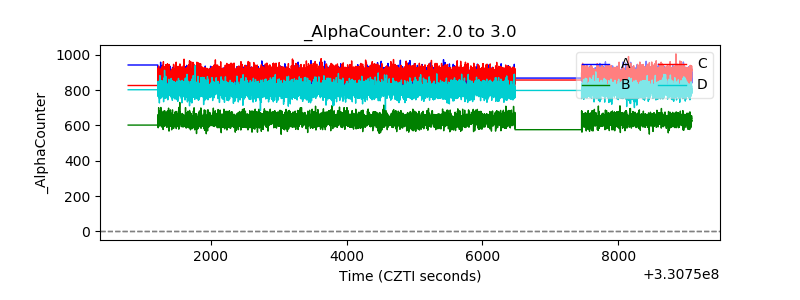 |
| _CPM_Rate | 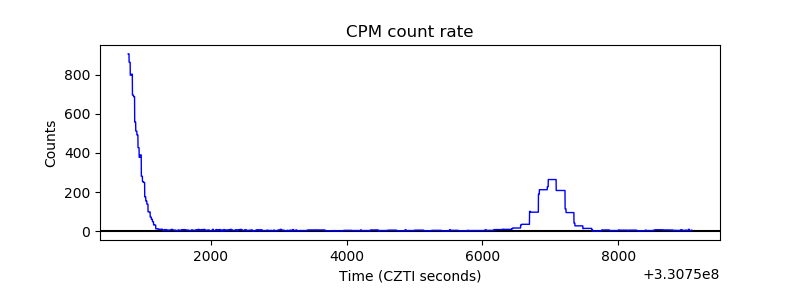 |
| CZT Counter | 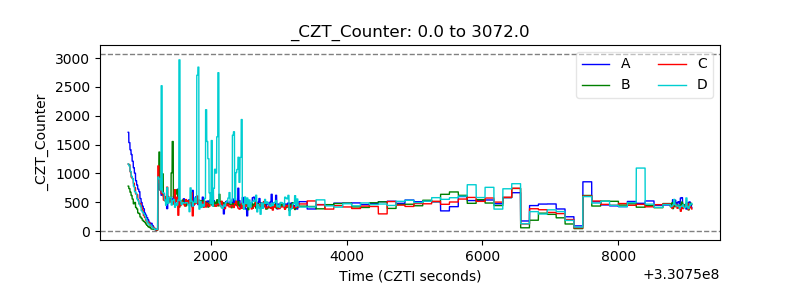 |
| +2.5 Volts monitor |  |
| +5 Volts monitor |  |
| _ROLL_ROT | 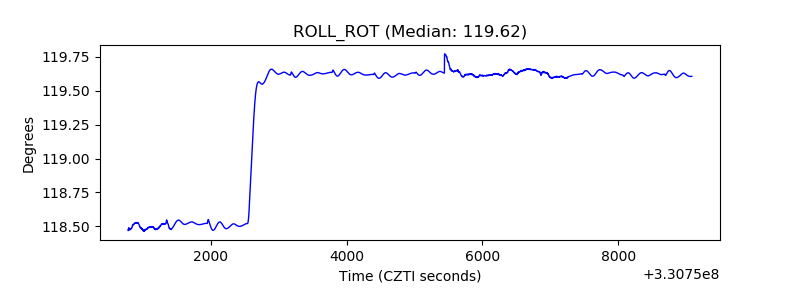 |
| _Roll_DEC |  |
| _Roll_RA | 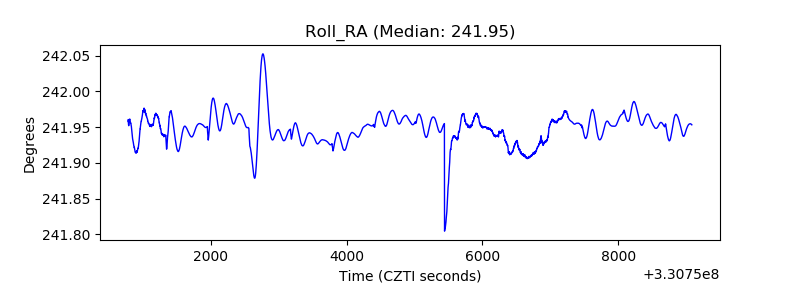 |
| Veto Counter | 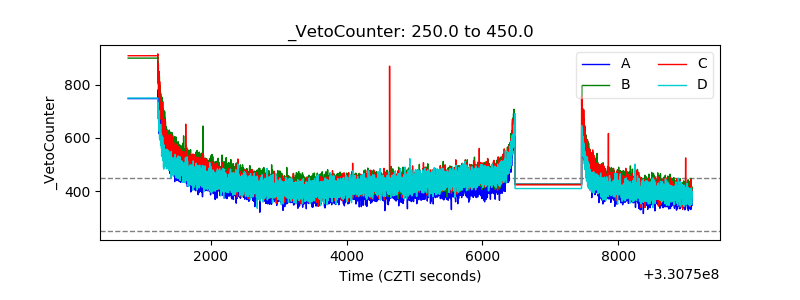 |