| Param | Original file | Final file |
|---|---|---|
| Filename | modeM0/AS1A09_013T02_9000003734_25639cztM0_level2.evt | modeM0/AS1A09_013T02_9000003734_25639cztM0_level2_quad_clean.evt |
| Size (bytes) | 553,982,400 | 94,078,080 |
| Size | 528.3 MB | 89.7 MB |
| Events in quadrant A | 3,815,947 | 586,807 |
| Events in quadrant B | 3,705,580 | 596,275 |
| Events in quadrant C | 3,651,061 | 567,406 |
| Events in quadrant D | 5,075,323 | 555,916 |
| Mode M9 | |||
|---|---|---|---|
| Quadrant | BADHDUFLAG | Total packets | Discarded packets |
| A | 0 | 2 | 0 |
| B | 0 | 2 | 0 |
| C | 0 | 2 | 0 |
| D | 0 | 2 | 0 |
| Mode M0 | |||
|---|---|---|---|
| Quadrant | BADHDUFLAG | Total packets | Discarded packets |
| A | 0 | 16092 | 0 |
| B | 0 | 16085 | 0 |
| C | 0 | 15992 | 0 |
| D | 0 | 20320 | 0 |
| Quadrant | Total seconds | Saturated seconds | Saturation percentage |
|---|---|---|---|
| A | 7797 | 187 | 2.398358% |
| B | 7798 | 229 | 2.936650% |
| C | 7798 | 208 | 2.667351% |
| D | 7798 | 349 | 4.475507% |
Noise dominated data is calculated using 1-second bins in cleaned event files. If a bin has >2000 counts, and if more than 50% of those come from <1% of pixels, then it is considered to be noise-dominated and hence unusable.
| Quadrant | # 1 sec bins | Bins with >0 counts | Bins with >2000 counts | High rate bins dominated by noise | Noise dominated (total time) | Noise dominated (detector-on time) | Marked lightcurve |
|---|---|---|---|---|---|---|---|
| A | 7997 | 7798 | 0 | 0 | 0.00% | 0.00% | 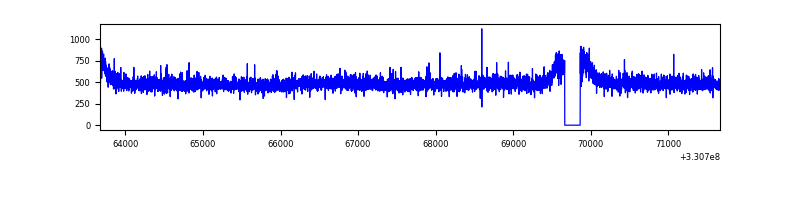 |
| B | 7998 | 7799 | 2 | 2 | 0.03% | 0.03% | 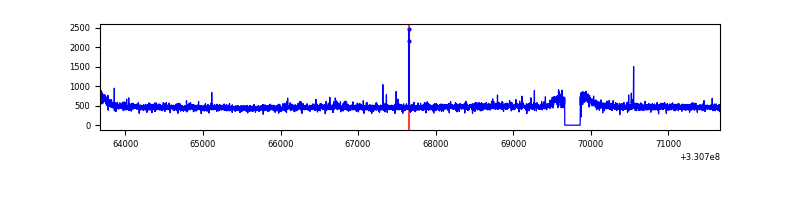 |
| C | 7998 | 7799 | 0 | 0 | 0.00% | 0.00% | 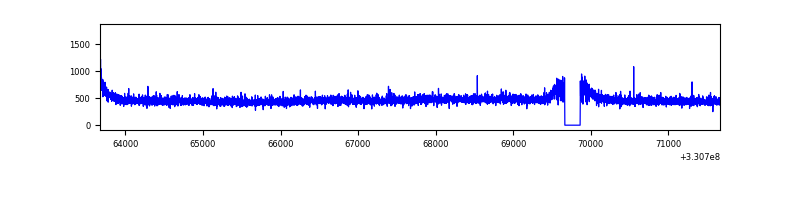 |
| D | 7998 | 7799 | 209 | 209 | 2.61% | 2.68% | 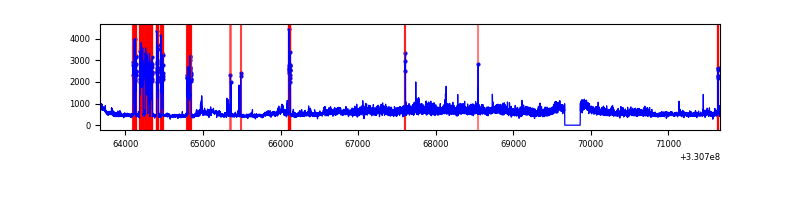 |
Top three noisy pixels from each quadrant. If the there are fewer than three noisy pixels in the level2.evt file, extra rows are filled as -1
| Pixel properties | Quadrant properties | ||||||
|---|---|---|---|---|---|---|---|
| Quadrant | DetID | PixID | Counts | Sigma | Mean | Median | Sigma |
| A | 8 | 192 | 202121 | 1067.32 | 937 | 916 | 188.5 |
| A | 13 | 254 | 11412 | 55.68 | 937 | 916 | 188.5 |
| A | 3 | 137 | 9028 | 43.03 | 937 | 916 | 188.5 |
| B | 3 | 112 | 23278 | 124.89 | 933 | 908 | 179.1 |
| B | 12 | 111 | 22530 | 120.71 | 933 | 908 | 179.1 |
| B | 11 | 111 | 20215 | 107.79 | 933 | 908 | 179.1 |
| C | 14 | 238 | 146102 | 696.48 | 896 | 898 | 208.5 |
| C | 3 | 233 | 11740 | 52.0 | 896 | 898 | 208.5 |
| C | 5 | 251 | 6396 | 26.37 | 896 | 898 | 208.5 |
| D | 8 | 195 | 873166 | 3784.42 | 894 | 869 | 230.5 |
| D | 1 | 52 | 779024 | 3375.99 | 894 | 869 | 230.5 |
| D | 2 | 234 | 29045 | 122.24 | 894 | 869 | 230.5 |
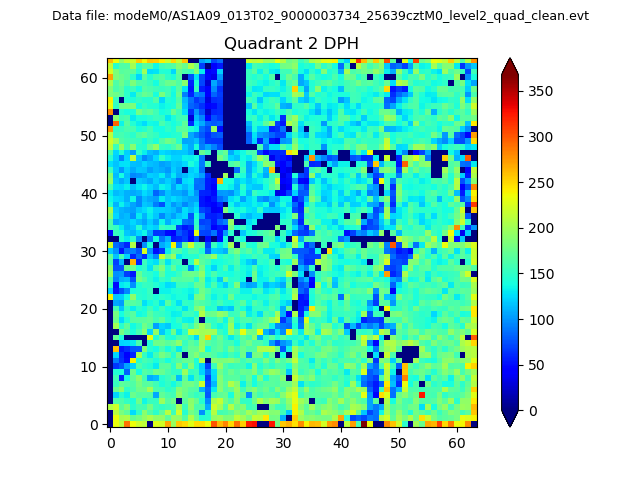
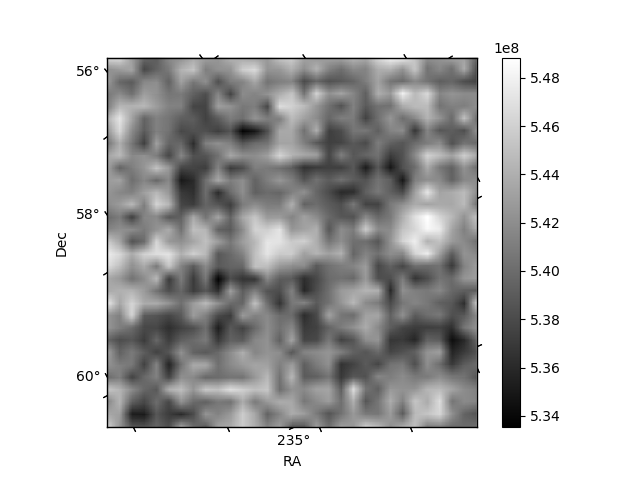
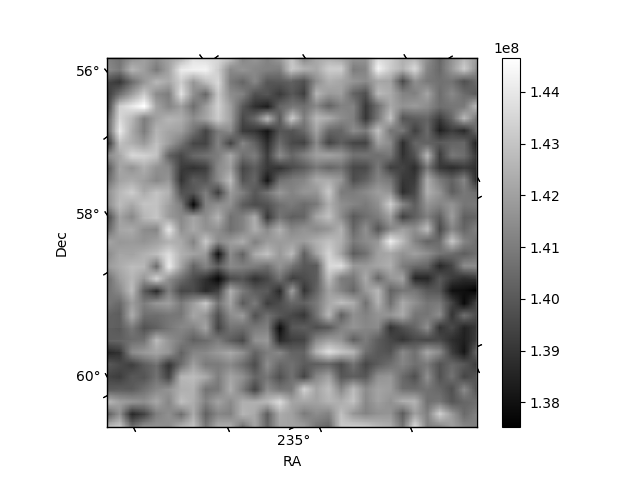
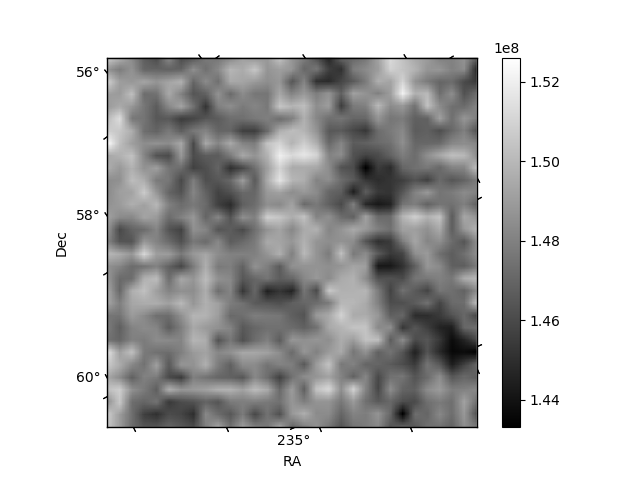
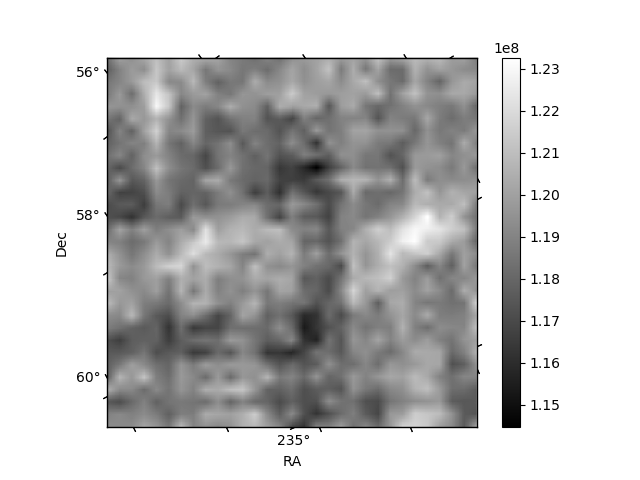
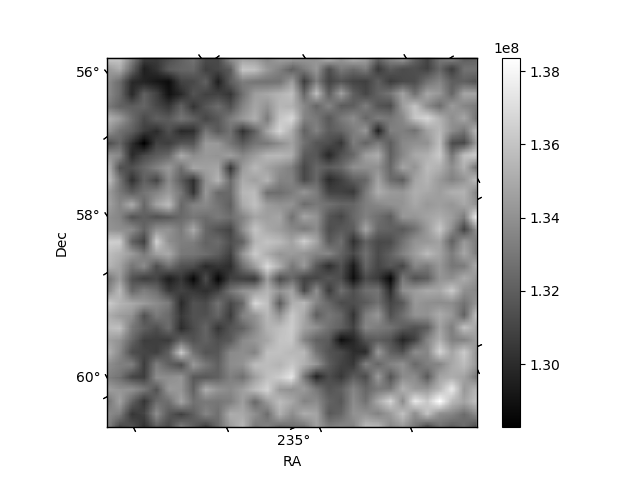
Histogram calculated using DETX and DETY for each event in the final _common_clean file
| Quadrant A | 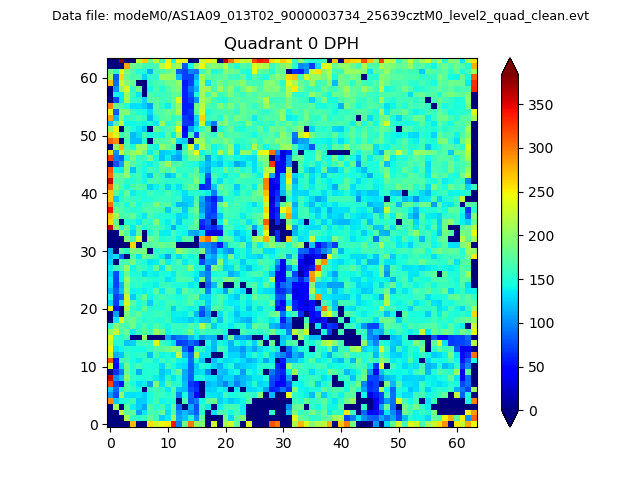 |
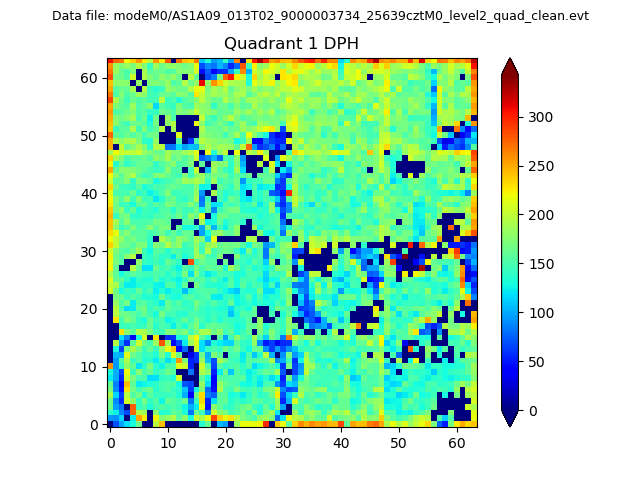 |
Quadrant B |
|---|---|---|---|
| Quadrant D | 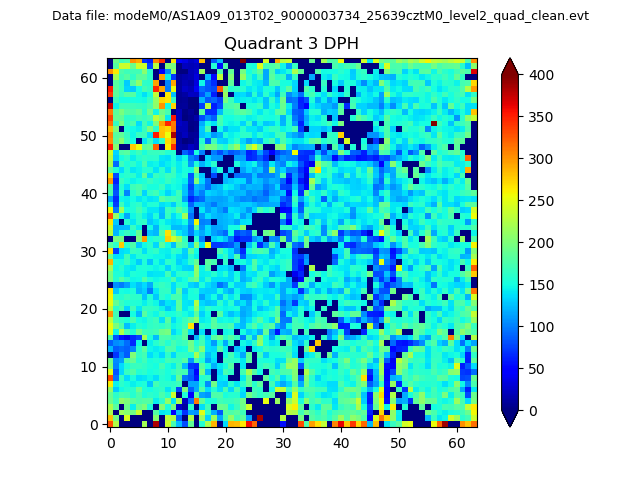 |
 |
Quadrant C |
| Plot type | Count rate plots | Images |
|---|---|---|
| Comparison with Poisson distribution Blue bars denote a histogram of data divided into 1 sec bins. Red curve is a Poisson curve with rate = median count rate of data. |
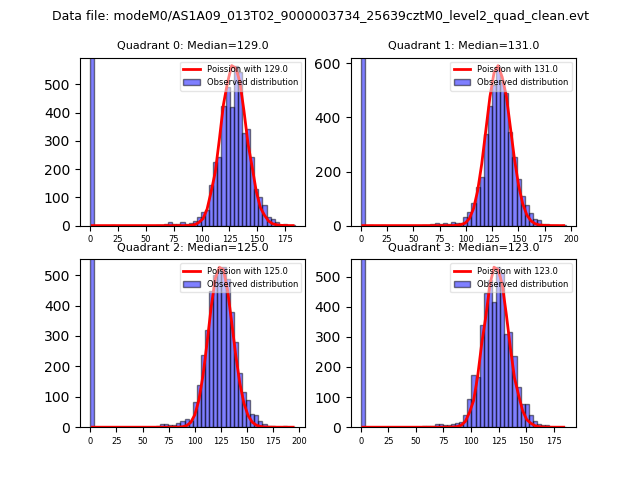 |
 |
| Quadrant-wise count rates Data is divided into 100 sec bins |
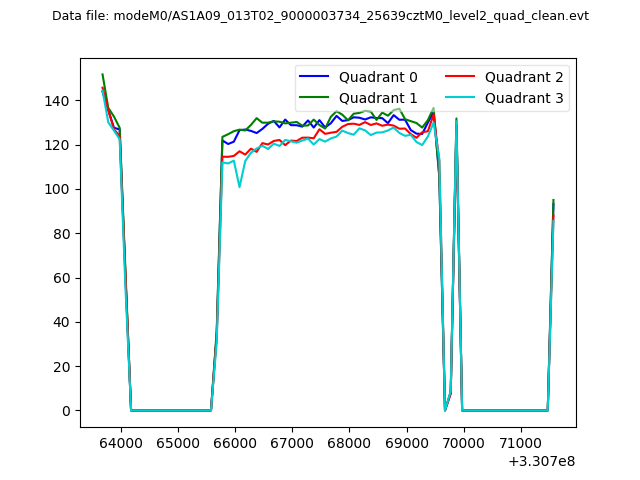 |
|
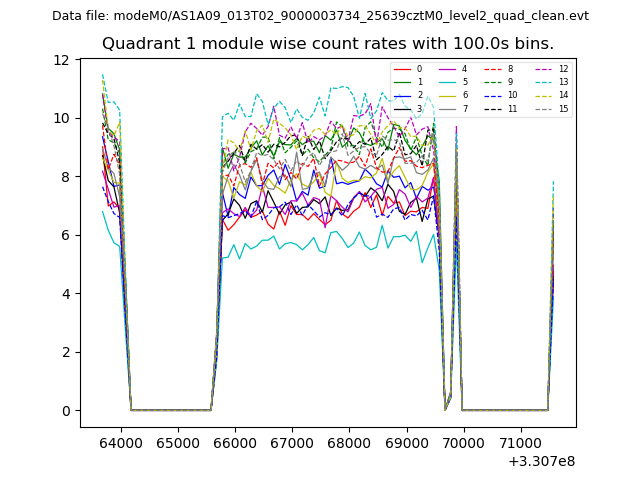
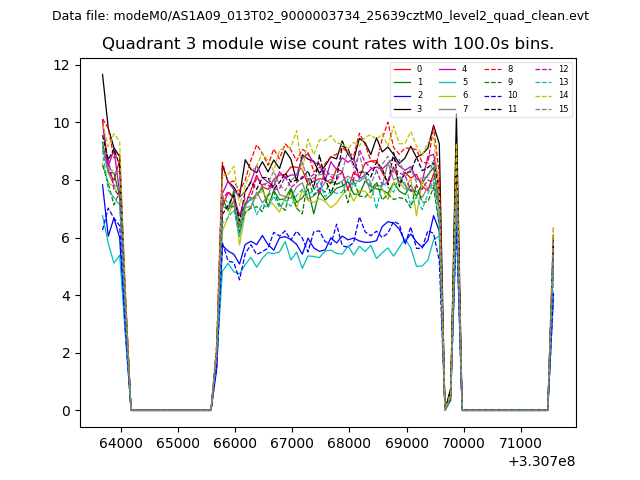
| Module-wise count rates for Quadrant A Data is divided into 100 sec bins |
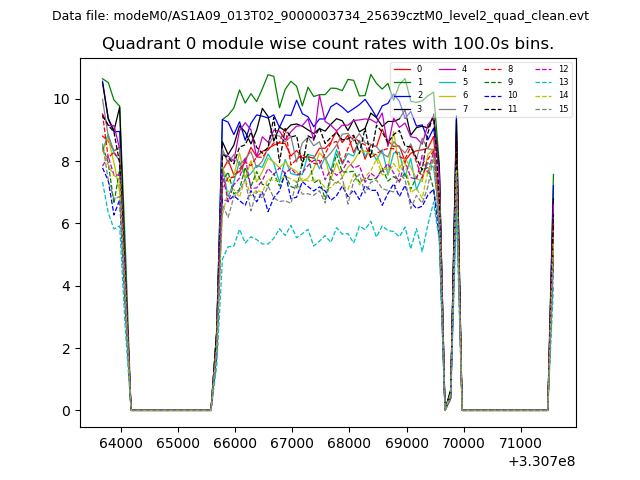 |
 |
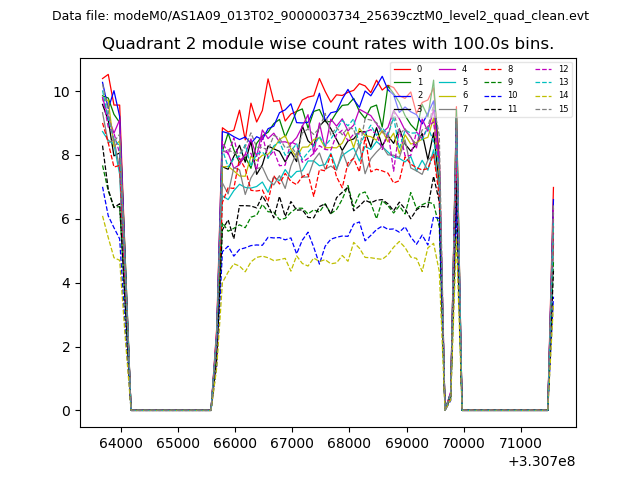
| Module-wise count rates for Quadrant B Data is divided into 100 sec bins |
 |
 |
| Module-wise count rates for Quadrant C Data is divided into 100 sec bins |
 |
 |
| Module-wise count rates for Quadrant D Data is divided into 100 sec bins |
 |
 |
| Parameter | Plot |
|---|---|
| CZT HV Monitor | 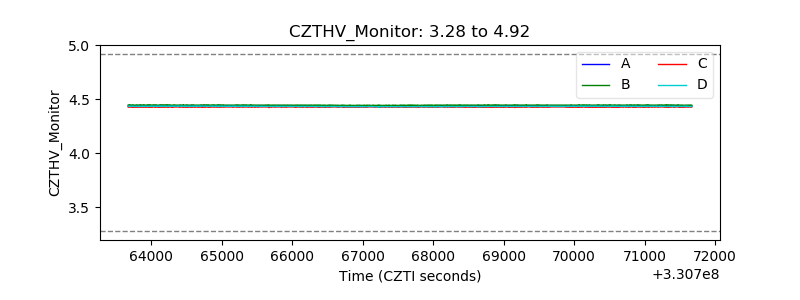 |
| D_VDD | 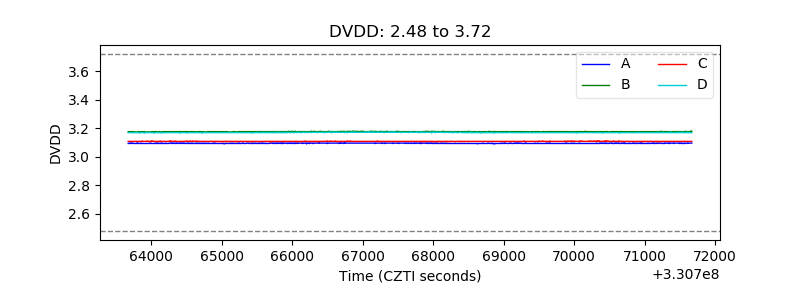 |
| Temperature 1 | 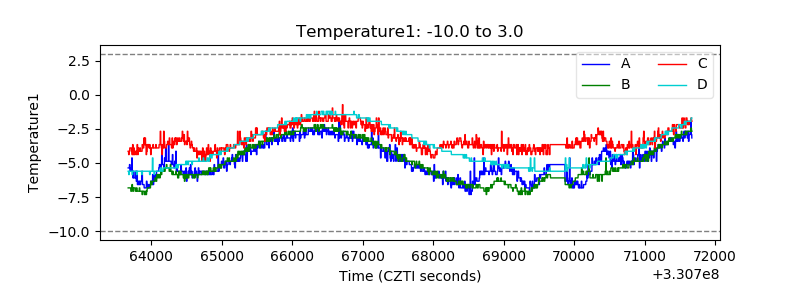 |
| Veto HV Monitor | 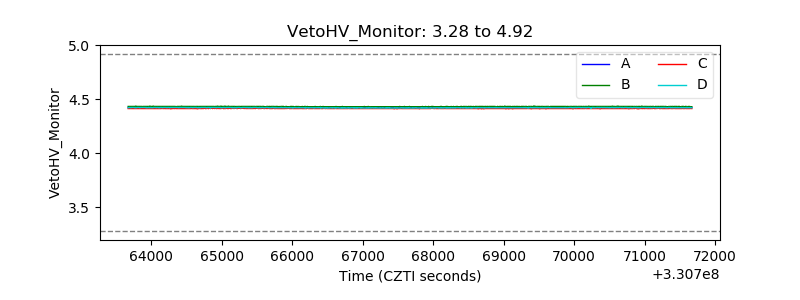 |
| Veto LLD | 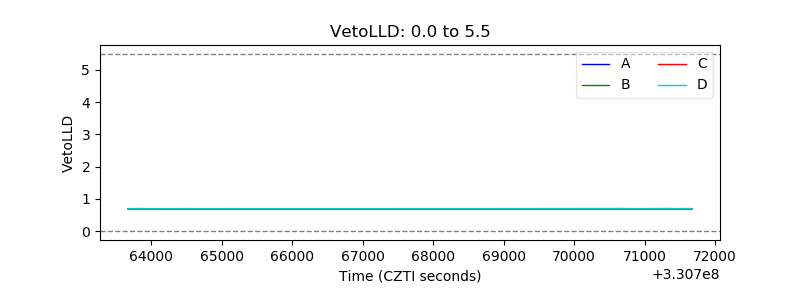 |
| Alpha Counter | 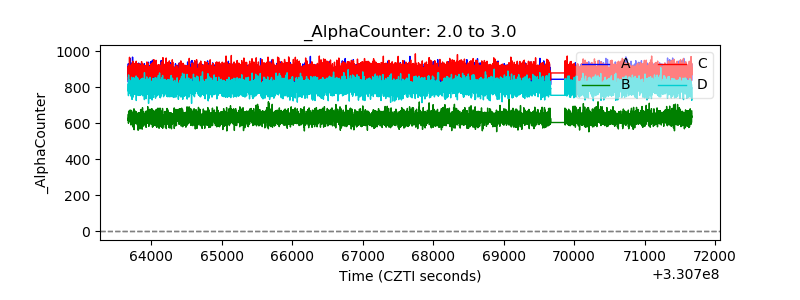 |
| _CPM_Rate | 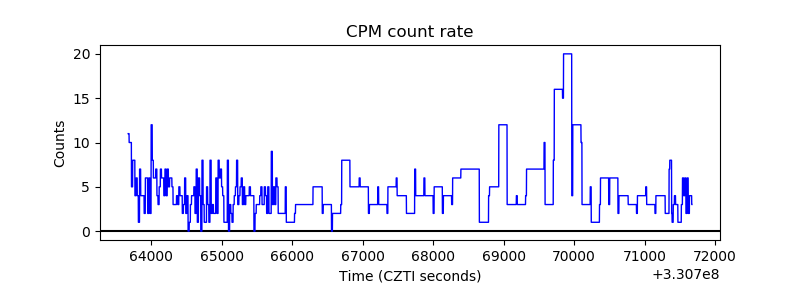 |
| CZT Counter | 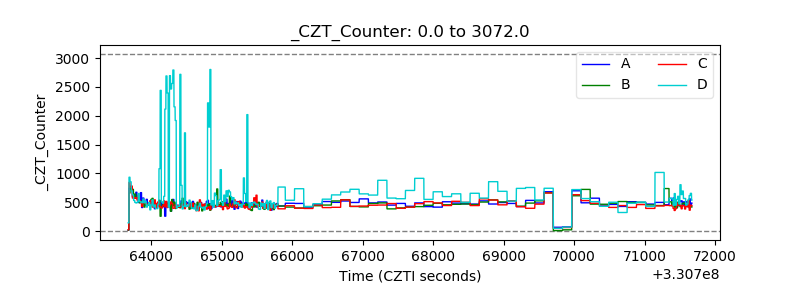 |
| +2.5 Volts monitor | 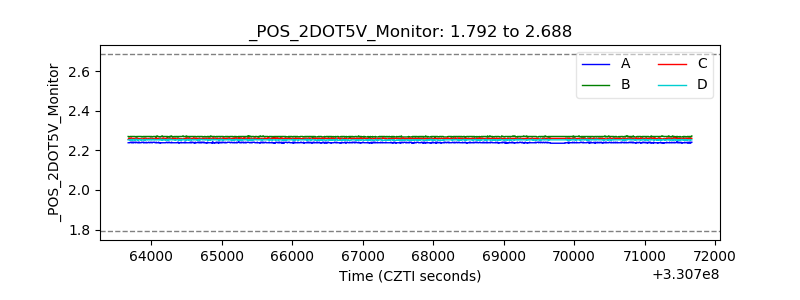 |
| +5 Volts monitor |  |
| _ROLL_ROT | 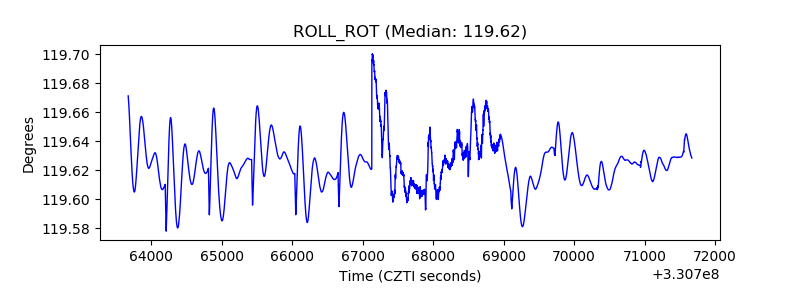 |
| _Roll_DEC | 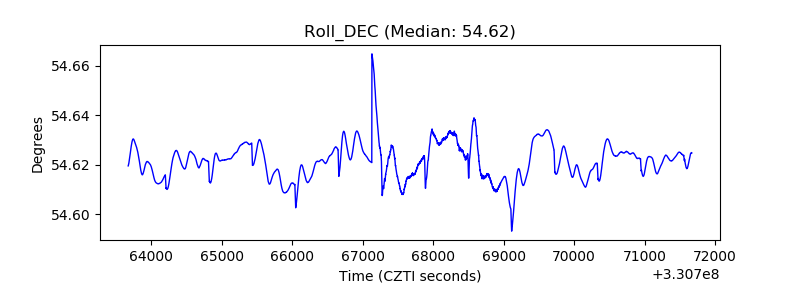 |
| _Roll_RA | 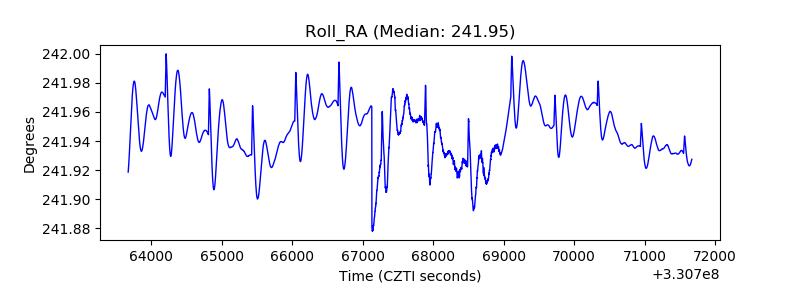 |
| Veto Counter | 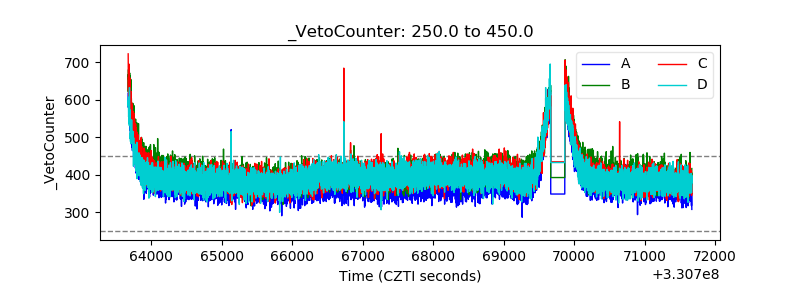 |