| Param | Original file | Final file |
|---|---|---|
| Filename | modeM0/AS1A09_013T02_9000003734_25640cztM0_level2.evt | modeM0/AS1A09_013T02_9000003734_25640cztM0_level2_quad_clean.evt |
| Size (bytes) | 509,950,080 | 92,652,480 |
| Size | 486.3 MB | 88.4 MB |
| Events in quadrant A | 3,594,364 | 584,971 |
| Events in quadrant B | 3,518,855 | 593,869 |
| Events in quadrant C | 3,429,821 | 562,200 |
| Events in quadrant D | 4,398,214 | 550,013 |
| Mode M9 | |||
|---|---|---|---|
| Quadrant | BADHDUFLAG | Total packets | Discarded packets |
| A | 0 | 2 | 0 |
| B | 0 | 2 | 0 |
| C | 0 | 2 | 0 |
| D | 0 | 2 | 0 |
| Mode M0 | |||
|---|---|---|---|
| Quadrant | BADHDUFLAG | Total packets | Discarded packets |
| A | 0 | 15150 | 0 |
| B | 0 | 15168 | 0 |
| C | 0 | 15044 | 0 |
| D | 0 | 18048 | 0 |
| Quadrant | Total seconds | Saturated seconds | Saturation percentage |
|---|---|---|---|
| A | 7396 | 146 | 1.974040% |
| B | 7397 | 171 | 2.311748% |
| C | 7397 | 183 | 2.473976% |
| D | 7397 | 128 | 1.730431% |
Noise dominated data is calculated using 1-second bins in cleaned event files. If a bin has >2000 counts, and if more than 50% of those come from <1% of pixels, then it is considered to be noise-dominated and hence unusable.
| Quadrant | # 1 sec bins | Bins with >0 counts | Bins with >2000 counts | High rate bins dominated by noise | Noise dominated (total time) | Noise dominated (detector-on time) | Marked lightcurve |
|---|---|---|---|---|---|---|---|
| A | 7611 | 7397 | 1 | 1 | 0.01% | 0.01% | 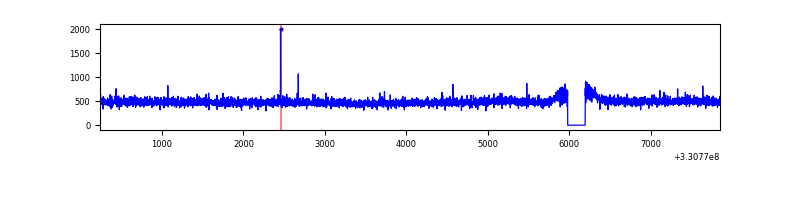 |
| B | 7612 | 7398 | 0 | 0 | 0.00% | 0.00% | 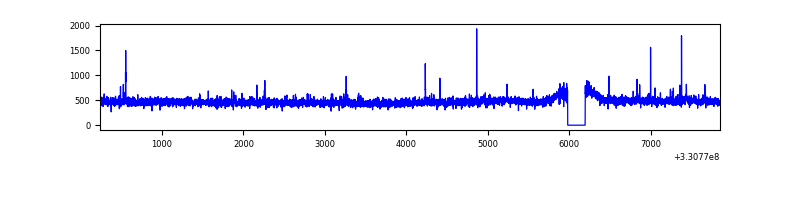 |
| C | 7612 | 7398 | 0 | 0 | 0.00% | 0.00% | 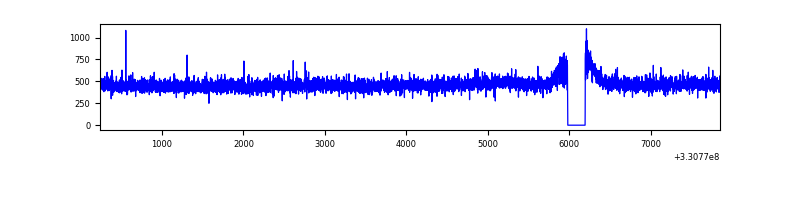 |
| D | 7612 | 7398 | 25 | 25 | 0.33% | 0.34% | 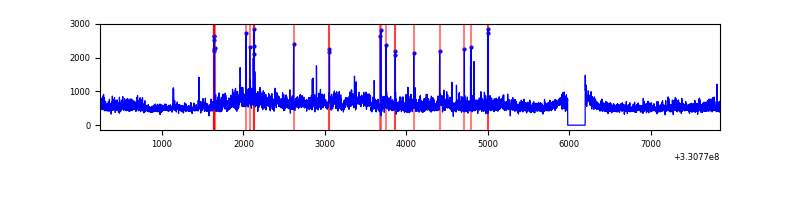 |
Top three noisy pixels from each quadrant. If the there are fewer than three noisy pixels in the level2.evt file, extra rows are filled as -1
| Pixel properties | Quadrant properties | ||||||
|---|---|---|---|---|---|---|---|
| Quadrant | DetID | PixID | Counts | Sigma | Mean | Median | Sigma |
| A | 8 | 192 | 186622 | 1039.53 | 882 | 864 | 178.7 |
| A | 13 | 254 | 11694 | 60.61 | 882 | 864 | 178.7 |
| A | 3 | 137 | 8448 | 42.44 | 882 | 864 | 178.7 |
| B | 3 | 112 | 37496 | 217.22 | 879 | 856 | 168.7 |
| B | 12 | 111 | 21003 | 119.44 | 879 | 856 | 168.7 |
| B | 11 | 111 | 18678 | 105.66 | 879 | 856 | 168.7 |
| C | 14 | 238 | 137164 | 690.17 | 842 | 847 | 197.5 |
| C | 3 | 233 | 11825 | 55.58 | 842 | 847 | 197.5 |
| C | 13 | 61 | 5814 | 25.15 | 842 | 847 | 197.5 |
| D | 8 | 195 | 848571 | 3805.49 | 845 | 823 | 222.8 |
| D | 1 | 52 | 301668 | 1350.47 | 845 | 823 | 222.8 |
| D | 2 | 234 | 29707 | 129.66 | 845 | 823 | 222.8 |
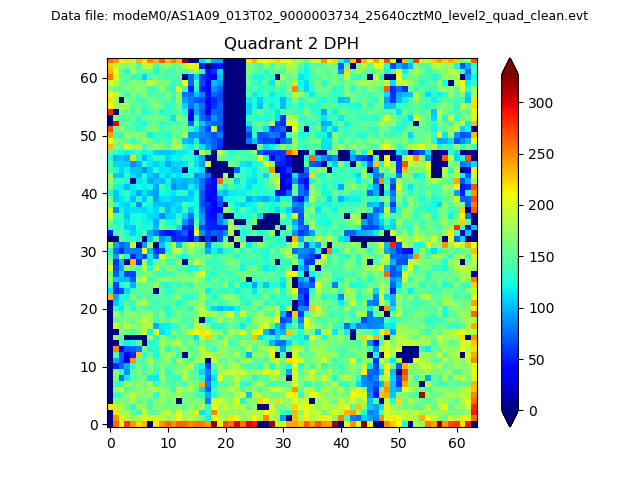
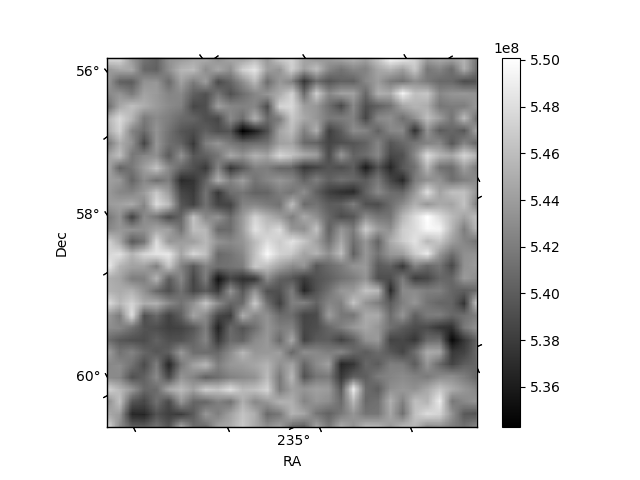
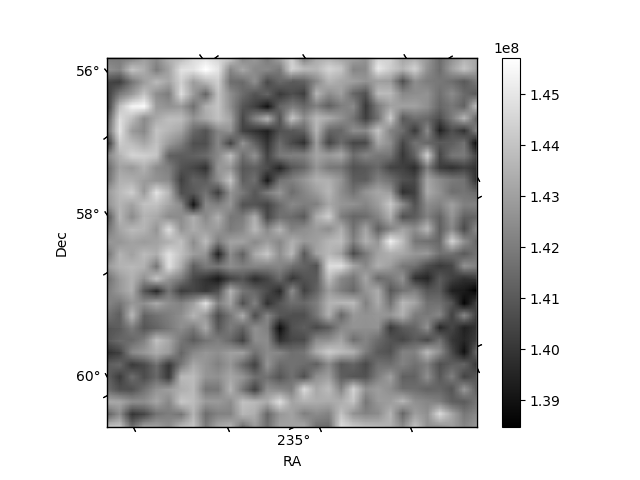
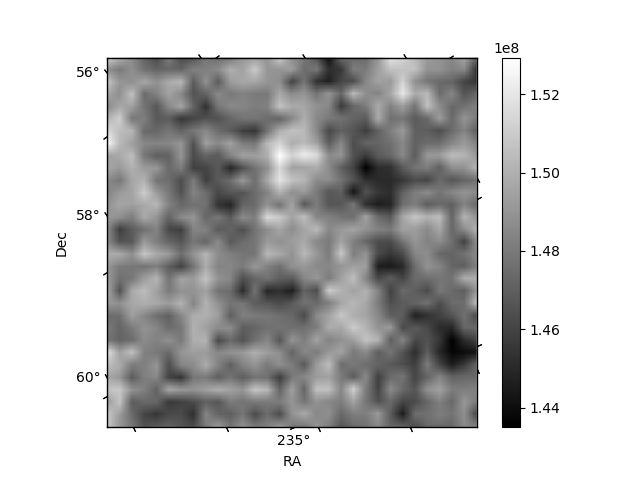
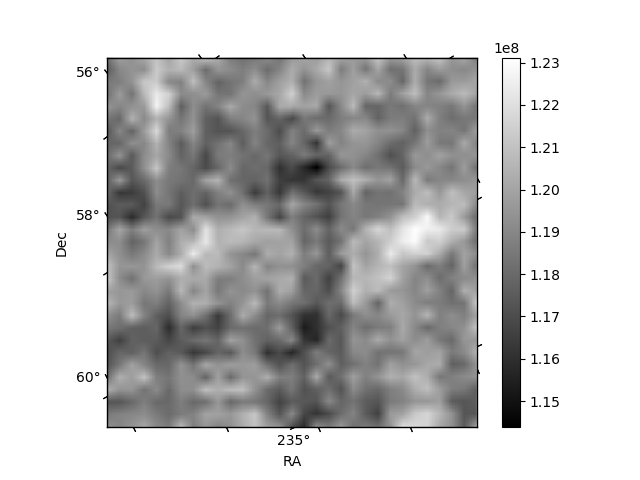
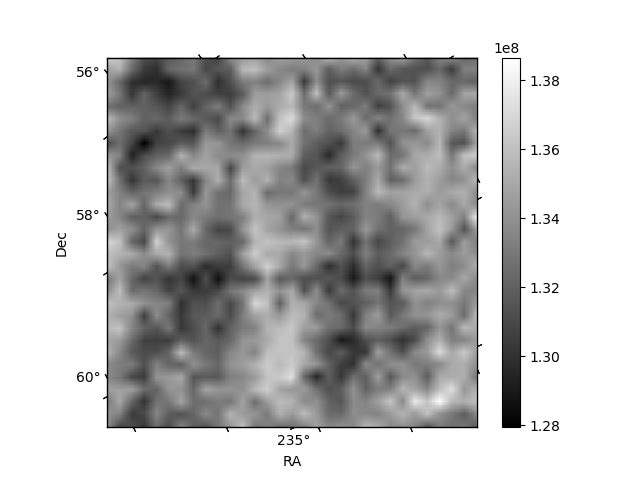
Histogram calculated using DETX and DETY for each event in the final _common_clean file
| Quadrant A | 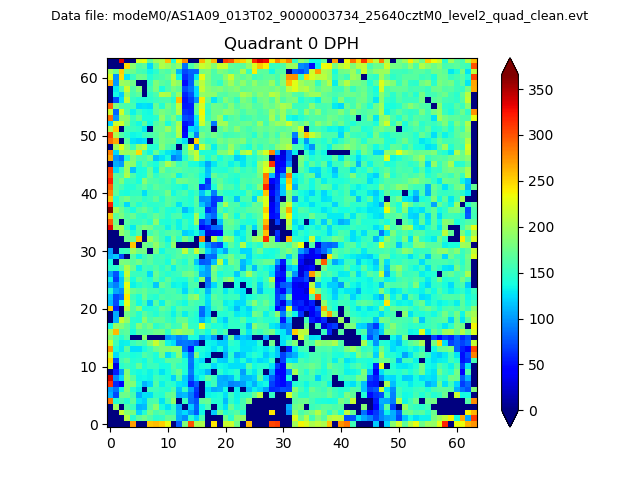 |
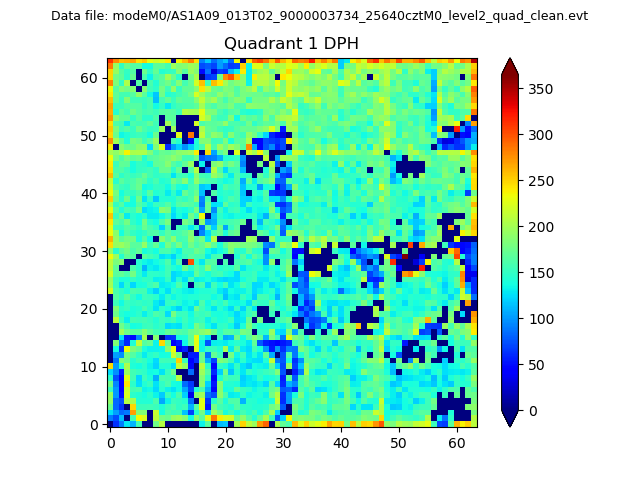 |
Quadrant B |
|---|---|---|---|
| Quadrant D | 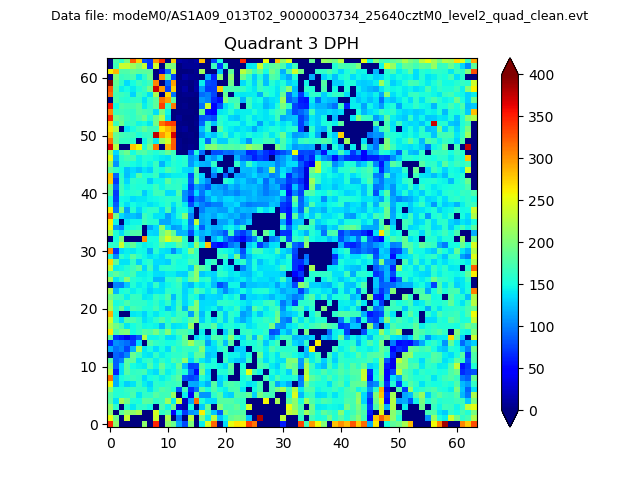 |
 |
Quadrant C |
| Plot type | Count rate plots | Images |
|---|---|---|
| Comparison with Poisson distribution Blue bars denote a histogram of data divided into 1 sec bins. Red curve is a Poisson curve with rate = median count rate of data. |
 |
 |
| Quadrant-wise count rates Data is divided into 100 sec bins |
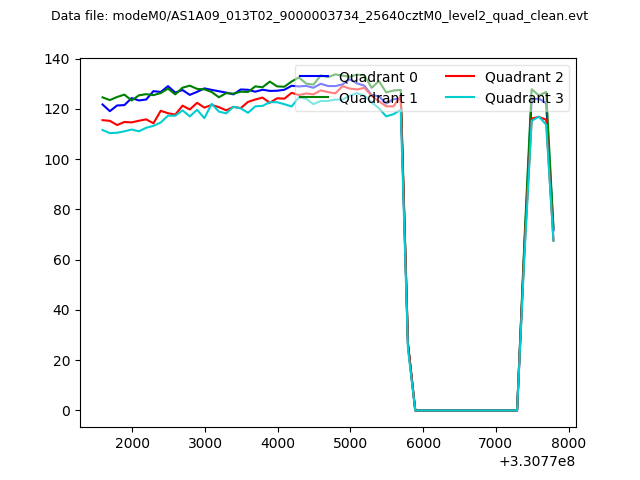 |
|
| Module-wise count rates for Quadrant A Data is divided into 100 sec bins |
 |
 |
| Module-wise count rates for Quadrant B Data is divided into 100 sec bins |
 |
 |
| Module-wise count rates for Quadrant C Data is divided into 100 sec bins |
 |
 |
| Module-wise count rates for Quadrant D Data is divided into 100 sec bins |
 |
 |
| Parameter | Plot |
|---|---|
| CZT HV Monitor |  |
| D_VDD | 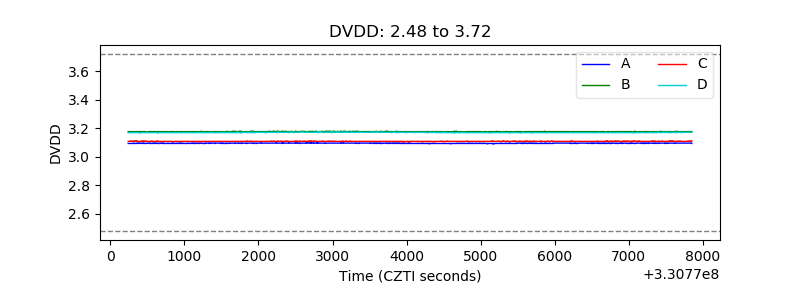 |
| Temperature 1 | 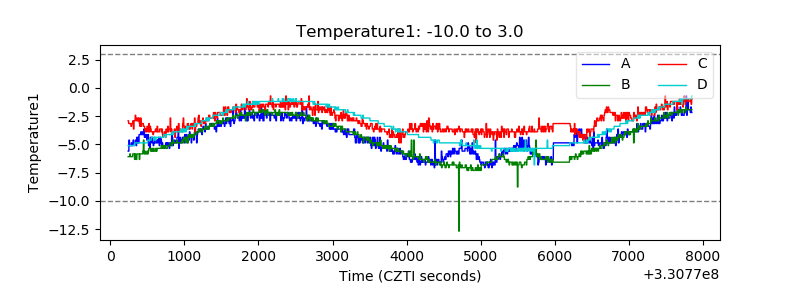 |
| Veto HV Monitor | 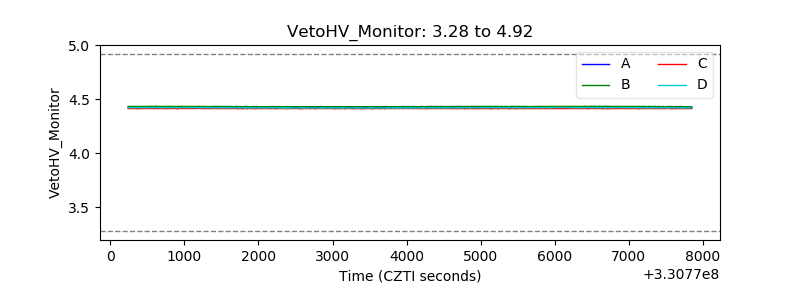 |
| Veto LLD | 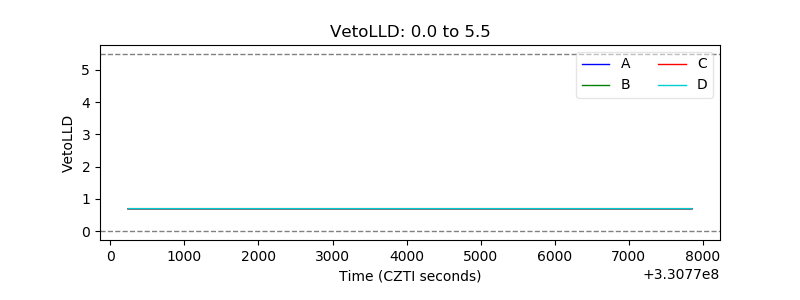 |
| Alpha Counter | 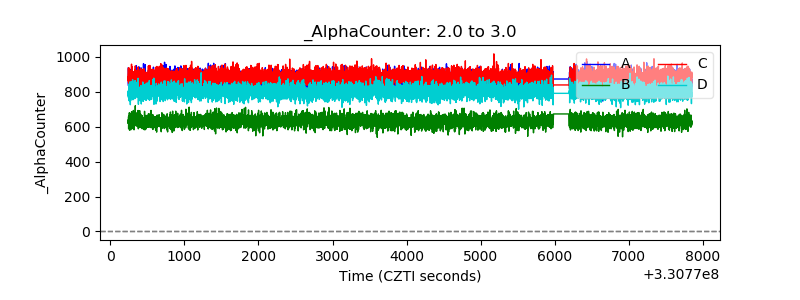 |
| _CPM_Rate | 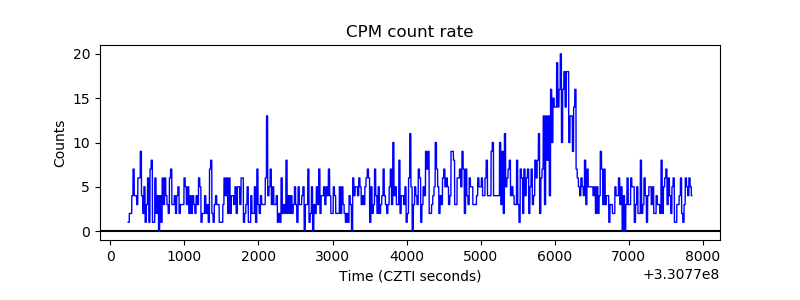 |
| CZT Counter | 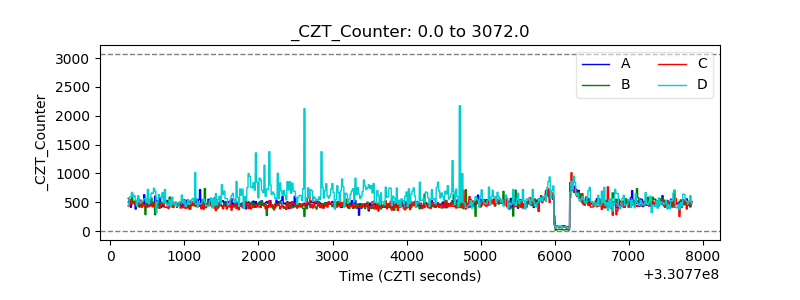 |
| +2.5 Volts monitor |  |
| +5 Volts monitor |  |
| _ROLL_ROT | 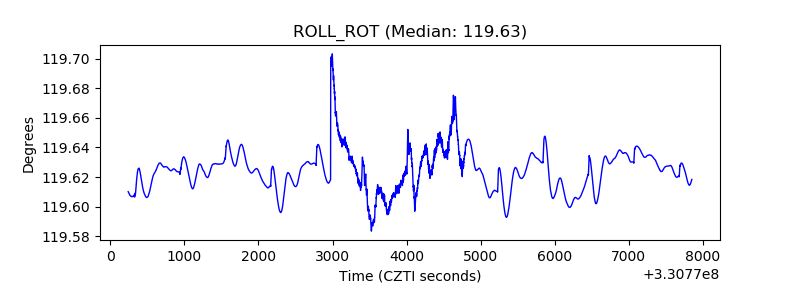 |
| _Roll_DEC |  |
| _Roll_RA | 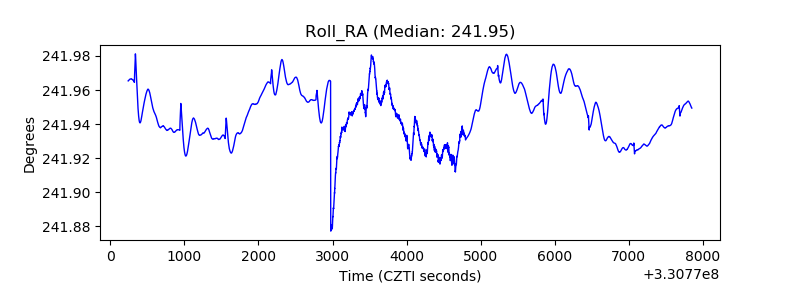 |
| Veto Counter |  |