| Param | Original file | Final file |
|---|---|---|
| Filename | modeM0/AS1A09_013T02_9000003734_25643cztM0_level2.evt | modeM0/AS1A09_013T02_9000003734_25643cztM0_level2_quad_clean.evt |
| Size (bytes) | 1,379,903,040 | 271,054,080 |
| Size | 1.3 GB | 258.5 MB |
| Events in quadrant A | 9,176,515 | 1,775,006 |
| Events in quadrant B | 8,812,093 | 1,793,309 |
| Events in quadrant C | 8,737,971 | 1,709,914 |
| Events in quadrant D | 13,813,281 | 1,655,673 |
| Mode M9 | |||
|---|---|---|---|
| Quadrant | BADHDUFLAG | Total packets | Discarded packets |
| A | 0 | 20 | 0 |
| B | 0 | 21 | 0 |
| C | 0 | 21 | 0 |
| D | 0 | 21 | 0 |
| Mode M0 | |||
|---|---|---|---|
| Quadrant | BADHDUFLAG | Total packets | Discarded packets |
| A | 0 | 38724 | 0 |
| B | 0 | 38074 | 0 |
| C | 0 | 37885 | 0 |
| D | 0 | 53989 | 0 |
| Quadrant | Total seconds | Saturated seconds | Saturation percentage |
|---|---|---|---|
| A | 18524 | 243 | 1.311812% |
| B | 18524 | 221 | 1.193047% |
| C | 18524 | 300 | 1.619521% |
| D | 18524 | 518 | 2.796372% |
Noise dominated data is calculated using 1-second bins in cleaned event files. If a bin has >2000 counts, and if more than 50% of those come from <1% of pixels, then it is considered to be noise-dominated and hence unusable.
| Quadrant | # 1 sec bins | Bins with >0 counts | Bins with >2000 counts | High rate bins dominated by noise | Noise dominated (total time) | Noise dominated (detector-on time) | Marked lightcurve |
|---|---|---|---|---|---|---|---|
| A | 20429 | 18527 | 21 | 21 | 0.10% | 0.11% | 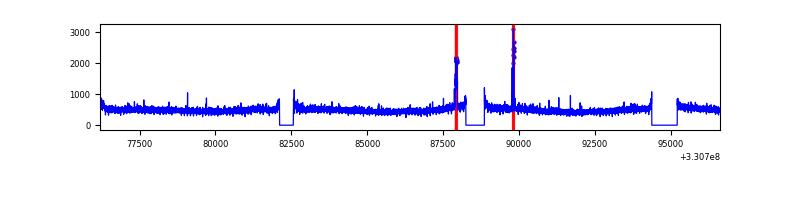 |
| B | 20429 | 18527 | 1 | 1 | 0.00% | 0.01% | 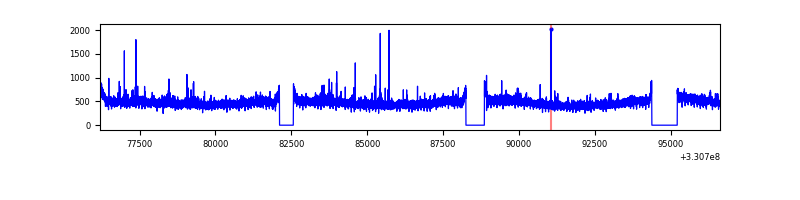 |
| C | 20429 | 18526 | 1 | 1 | 0.00% | 0.01% | 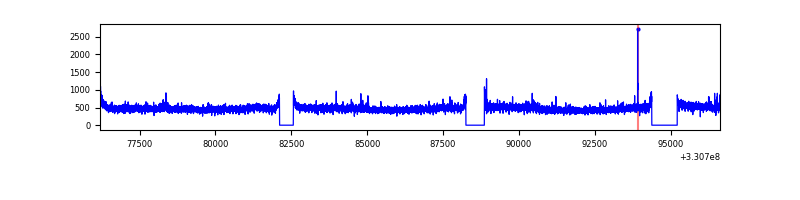 |
| D | 20429 | 18526 | 271 | 271 | 1.33% | 1.46% | 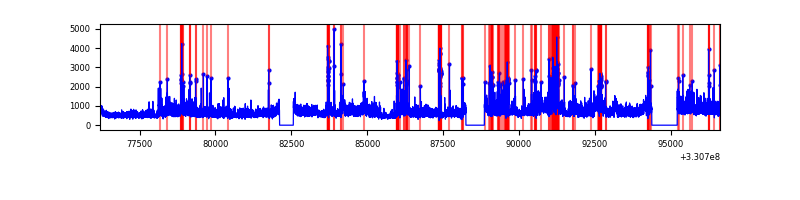 |
Top three noisy pixels from each quadrant. If the there are fewer than three noisy pixels in the level2.evt file, extra rows are filled as -1
| Pixel properties | Quadrant properties | ||||||
|---|---|---|---|---|---|---|---|
| Quadrant | DetID | PixID | Counts | Sigma | Mean | Median | Sigma |
| A | 8 | 192 | 495092 | 1119.34 | 2212 | 2165 | 440.4 |
| A | 13 | 170 | 116351 | 259.29 | 2212 | 2165 | 440.4 |
| A | 12 | 96 | 39118 | 83.91 | 2212 | 2165 | 440.4 |
| B | 3 | 112 | 84947 | 196.06 | 2205 | 2145 | 422.3 |
| B | 12 | 111 | 52470 | 119.16 | 2205 | 2145 | 422.3 |
| B | 11 | 111 | 46989 | 106.18 | 2205 | 2145 | 422.3 |
| C | 14 | 238 | 342484 | 686.42 | 2124 | 2133 | 495.8 |
| C | 3 | 233 | 117798 | 233.27 | 2124 | 2133 | 495.8 |
| C | 13 | 61 | 14858 | 25.66 | 2124 | 2133 | 495.8 |
| D | 8 | 195 | 3315031 | 5852.45 | 2116 | 2070 | 566.1 |
| D | 1 | 52 | 2313822 | 4083.79 | 2116 | 2070 | 566.1 |
| D | 2 | 234 | 79298 | 136.43 | 2116 | 2070 | 566.1 |
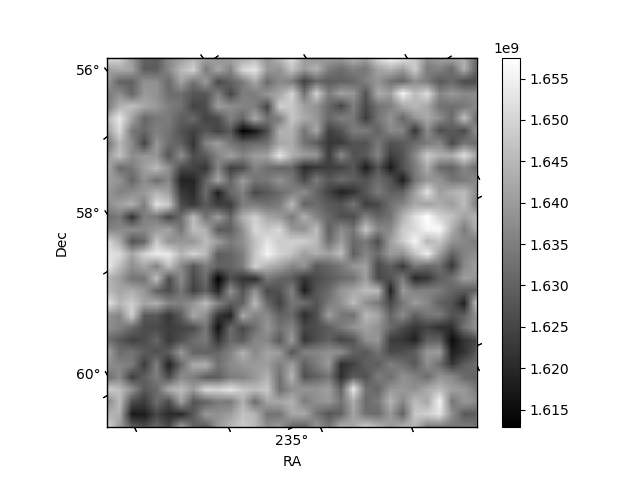
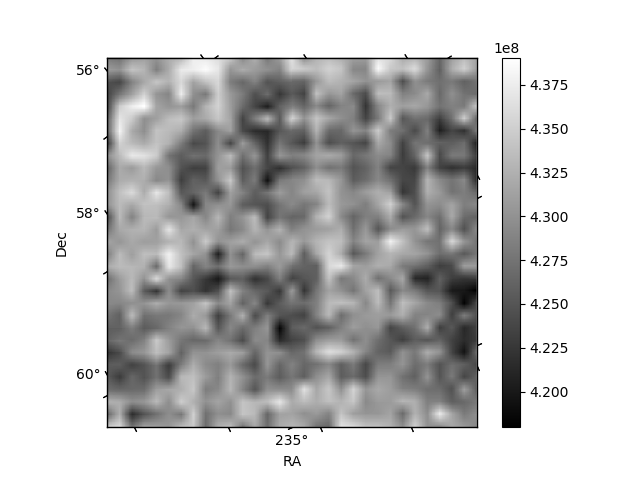
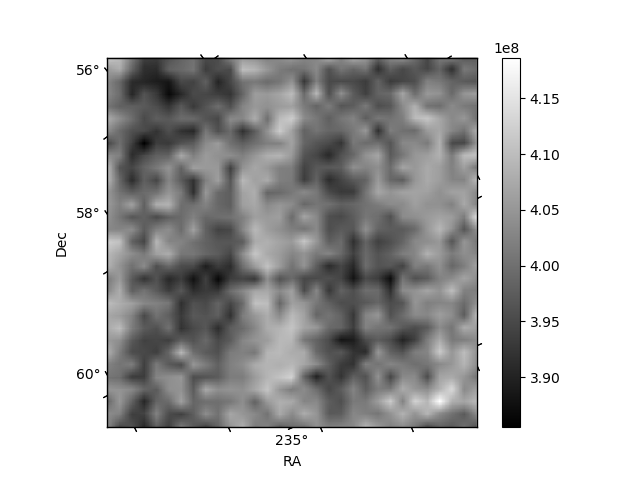
Histogram calculated using DETX and DETY for each event in the final _common_clean file
| Quadrant A | 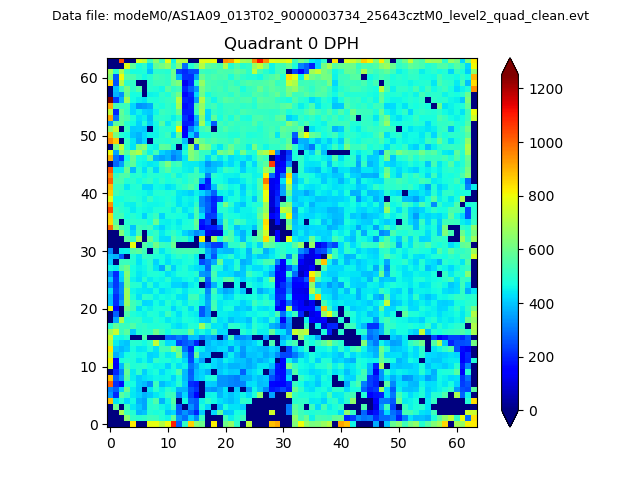 |
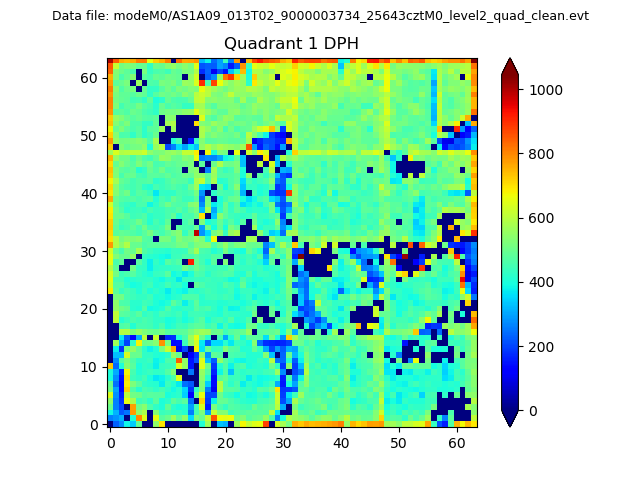 |
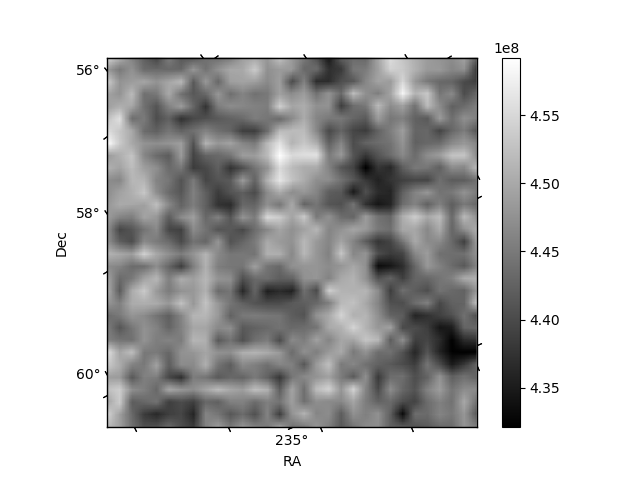
Quadrant B |
|---|---|---|---|
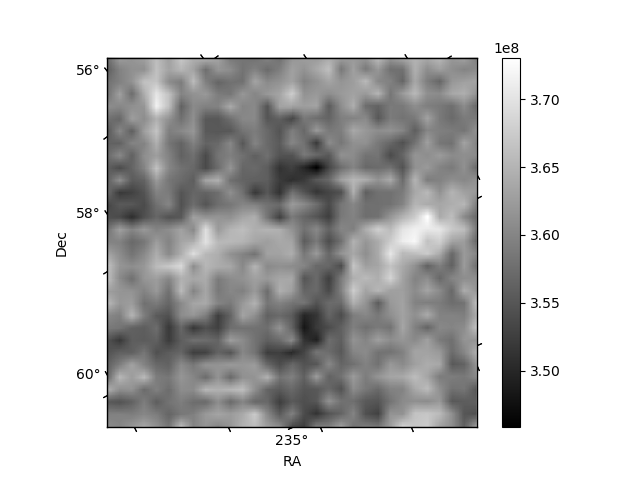
| Quadrant D | 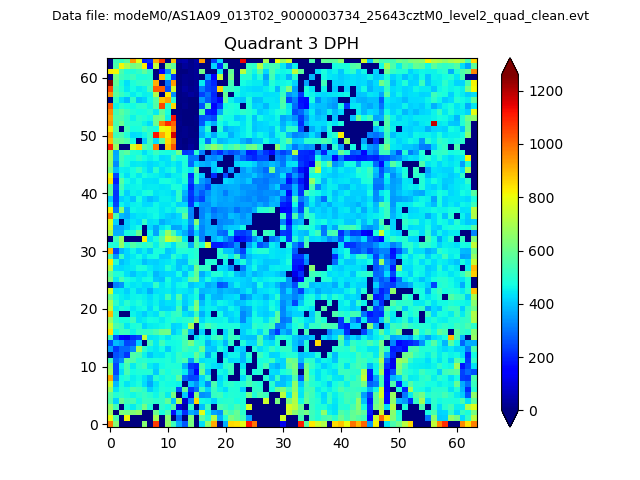 |
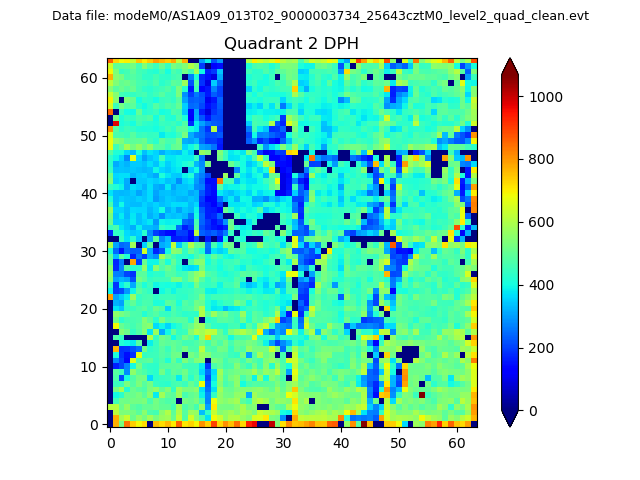 |
Quadrant C |
| Plot type | Count rate plots | Images |
|---|---|---|
| Comparison with Poisson distribution Blue bars denote a histogram of data divided into 1 sec bins. Red curve is a Poisson curve with rate = median count rate of data. |
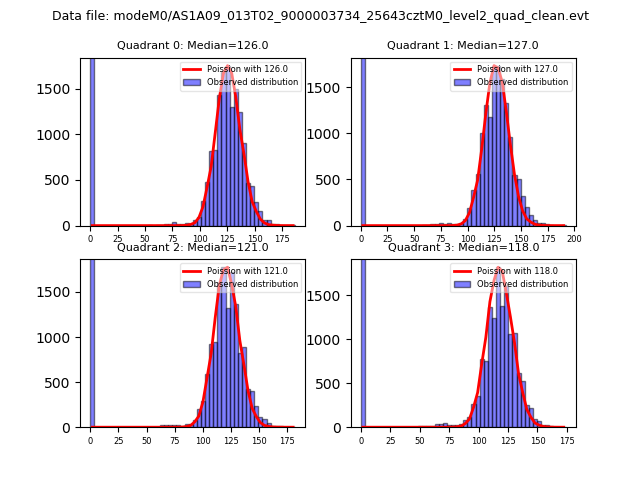 |
 |
| Quadrant-wise count rates Data is divided into 100 sec bins |
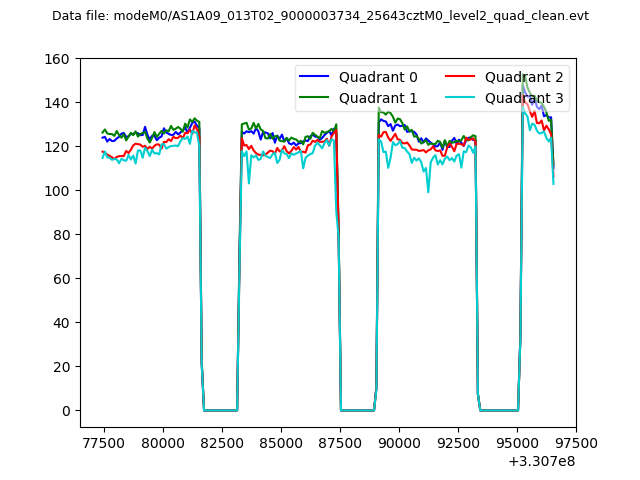 |
|
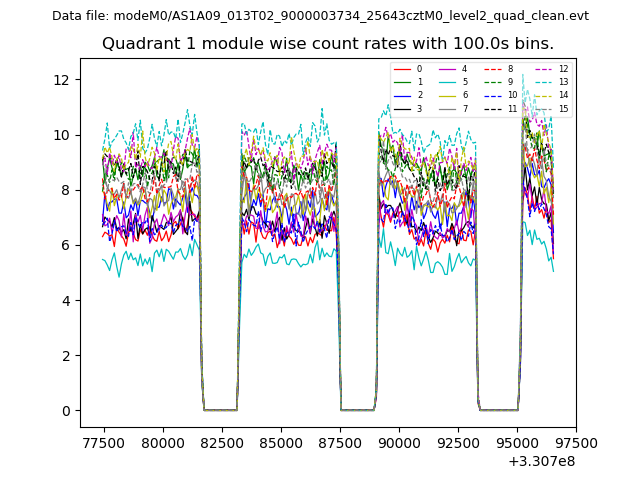
| Module-wise count rates for Quadrant A Data is divided into 100 sec bins |
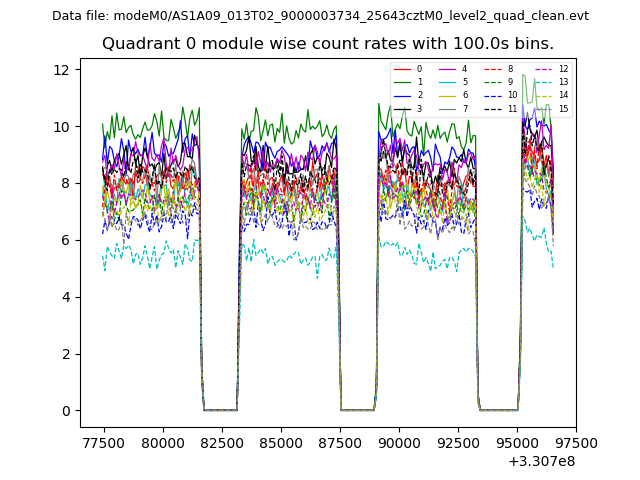 |
 |
| Module-wise count rates for Quadrant B Data is divided into 100 sec bins |
 |
 |
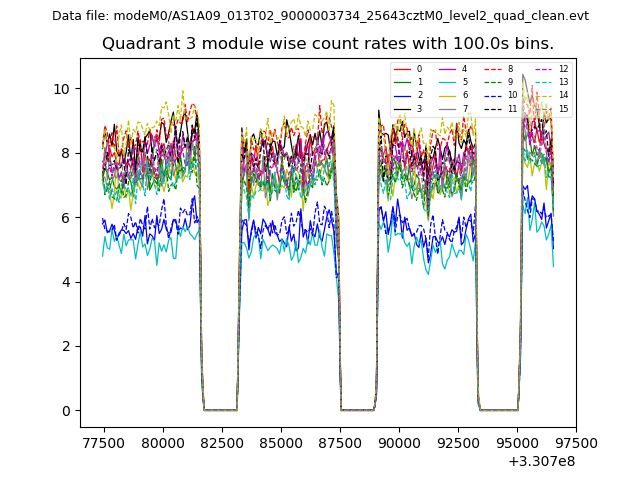
| Module-wise count rates for Quadrant C Data is divided into 100 sec bins |
 |
 |
| Module-wise count rates for Quadrant D Data is divided into 100 sec bins |
 |
 |
| Parameter | Plot |
|---|---|
| CZT HV Monitor |  |
| D_VDD | 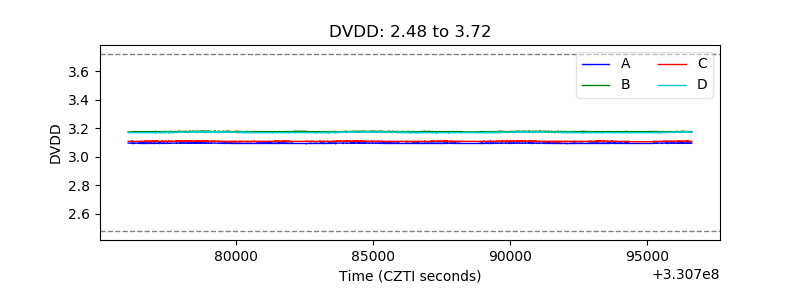 |
| Temperature 1 | 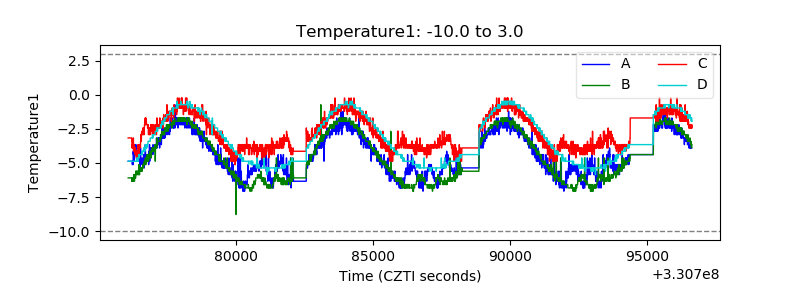 |
| Veto HV Monitor | 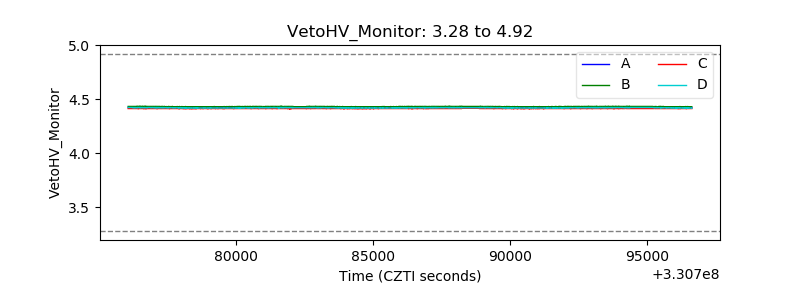 |
| Veto LLD | 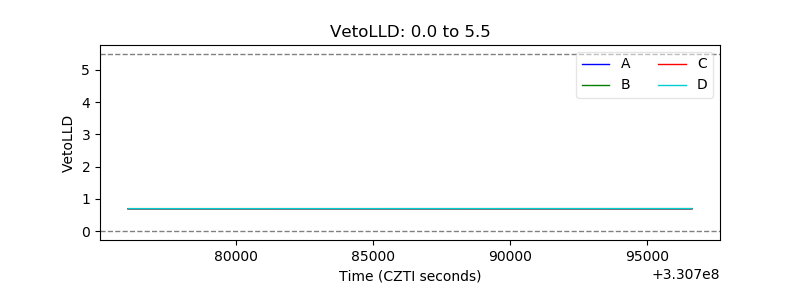 |
| Alpha Counter | 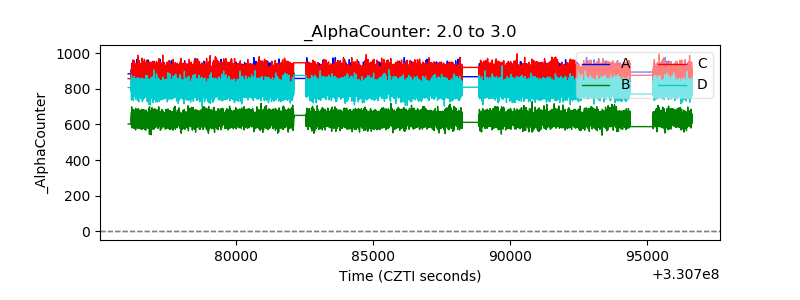 |
| _CPM_Rate | 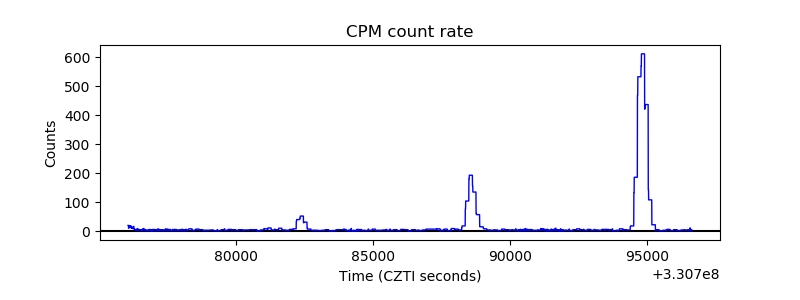 |
| CZT Counter | 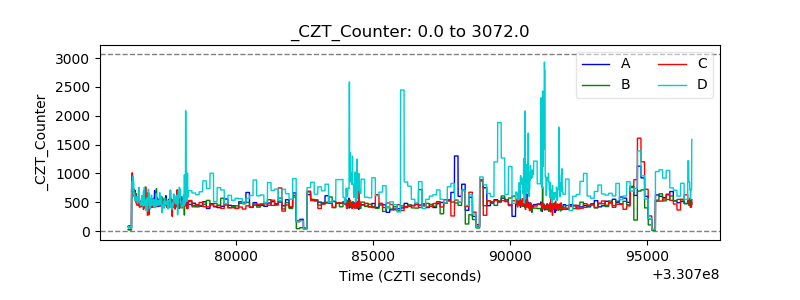 |
| +2.5 Volts monitor |  |
| +5 Volts monitor |  |
| _ROLL_ROT | 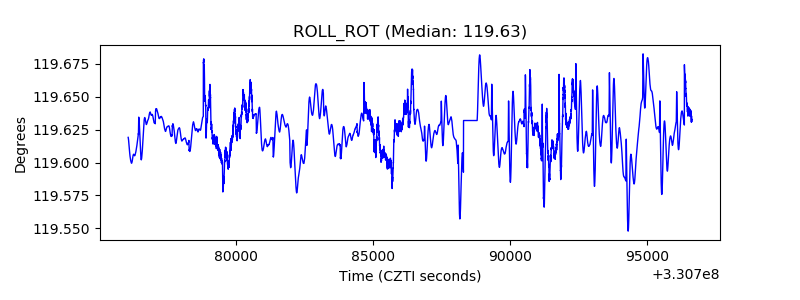 |
| _Roll_DEC | 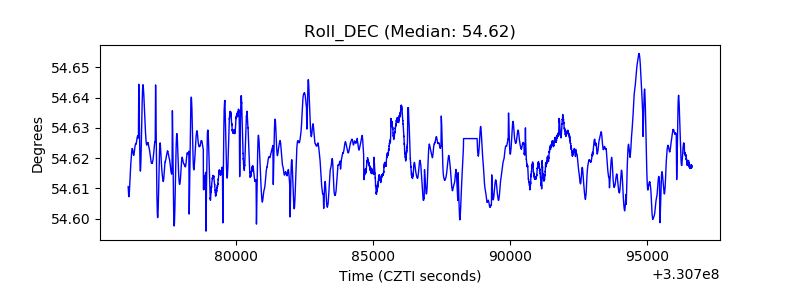 |
| _Roll_RA | 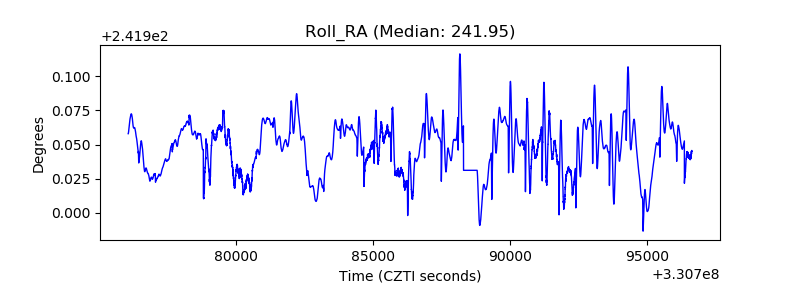 |
| Veto Counter | 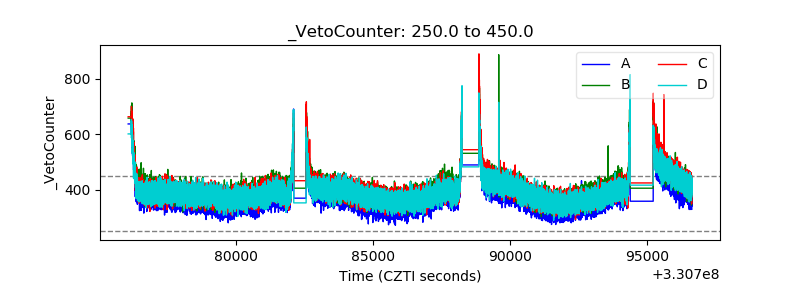 |