| Param | Original file | Final file |
|---|---|---|
| Filename | modeM0/AS1A09_013T02_9000003734_25644cztM0_level2.evt | modeM0/AS1A09_013T02_9000003734_25644cztM0_level2_quad_clean.evt |
| Size (bytes) | 504,432,000 | 106,079,040 |
| Size | 481.1 MB | 101.2 MB |
| Events in quadrant A | 3,300,961 | 702,492 |
| Events in quadrant B | 3,180,774 | 711,541 |
| Events in quadrant C | 3,196,201 | 683,576 |
| Events in quadrant D | 5,151,258 | 655,002 |
| Mode M9 | |||
|---|---|---|---|
| Quadrant | BADHDUFLAG | Total packets | Discarded packets |
| A | 0 | 10 | 0 |
| B | 0 | 10 | 0 |
| C | 0 | 10 | 0 |
| D | 0 | 10 | 0 |
| Mode M0 | |||
|---|---|---|---|
| Quadrant | BADHDUFLAG | Total packets | Discarded packets |
| A | 0 | 14095 | 0 |
| B | 0 | 13842 | 0 |
| C | 0 | 13823 | 0 |
| D | 0 | 19965 | 0 |
| Quadrant | Total seconds | Saturated seconds | Saturation percentage |
|---|---|---|---|
| A | 6599 | 32 | 0.484922% |
| B | 6605 | 37 | 0.560182% |
| C | 6602 | 85 | 1.287489% |
| D | 6587 | 113 | 1.715500% |
Noise dominated data is calculated using 1-second bins in cleaned event files. If a bin has >2000 counts, and if more than 50% of those come from <1% of pixels, then it is considered to be noise-dominated and hence unusable.
| Quadrant | # 1 sec bins | Bins with >0 counts | Bins with >2000 counts | High rate bins dominated by noise | Noise dominated (total time) | Noise dominated (detector-on time) | Marked lightcurve |
|---|---|---|---|---|---|---|---|
| A | 7623 | 6619 | 0 | 0 | 0.00% | 0.00% | 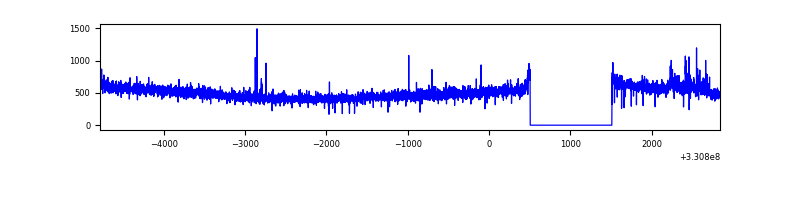 |
| B | 7624 | 6619 | 0 | 0 | 0.00% | 0.00% | 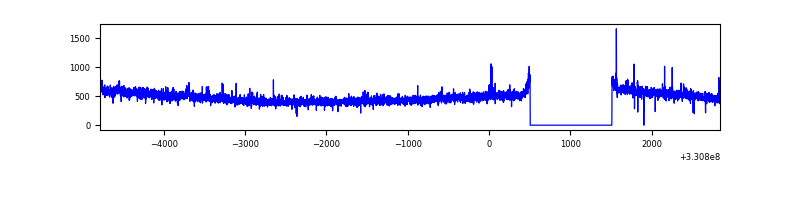 |
| C | 7623 | 6618 | 0 | 0 | 0.00% | 0.00% | 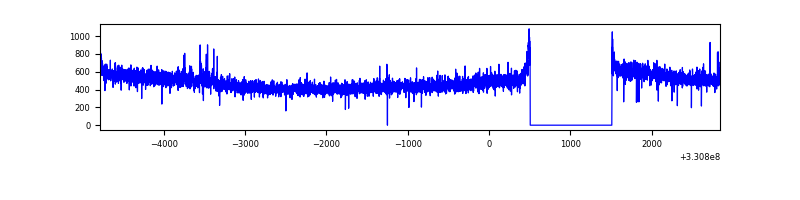 |
| D | 7623 | 6618 | 55 | 55 | 0.72% | 0.83% | 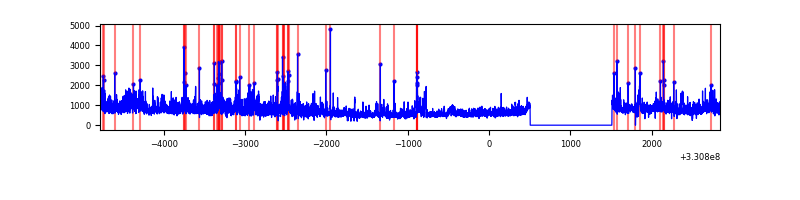 |
Top three noisy pixels from each quadrant. If the there are fewer than three noisy pixels in the level2.evt file, extra rows are filled as -1
| Pixel properties | Quadrant properties | ||||||
|---|---|---|---|---|---|---|---|
| Quadrant | DetID | PixID | Counts | Sigma | Mean | Median | Sigma |
| A | 8 | 192 | 196209 | 1205.3 | 803 | 787 | 162.1 |
| A | 13 | 254 | 9643 | 54.62 | 803 | 787 | 162.1 |
| A | 12 | 96 | 8404 | 46.98 | 803 | 787 | 162.1 |
| B | 12 | 111 | 18532 | 117.05 | 801 | 780 | 151.7 |
| B | 11 | 111 | 16465 | 103.42 | 801 | 780 | 151.7 |
| B | 0 | 190 | 16334 | 102.56 | 801 | 780 | 151.7 |
| C | 14 | 238 | 123818 | 673.66 | 779 | 782 | 182.6 |
| C | 3 | 233 | 37285 | 199.87 | 779 | 782 | 182.6 |
| C | 13 | 61 | 5414 | 25.36 | 779 | 782 | 182.6 |
| D | 8 | 195 | 1274639 | 6686.91 | 785 | 761 | 190.5 |
| D | 1 | 52 | 823989 | 4321.33 | 785 | 761 | 190.5 |
| D | 2 | 244 | 63581 | 329.76 | 785 | 761 | 190.5 |
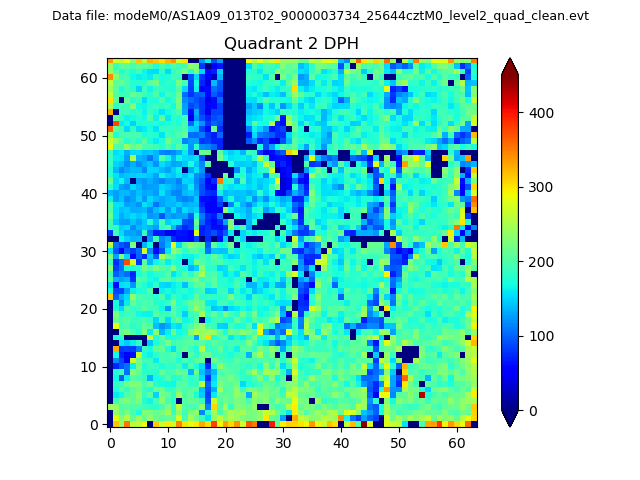
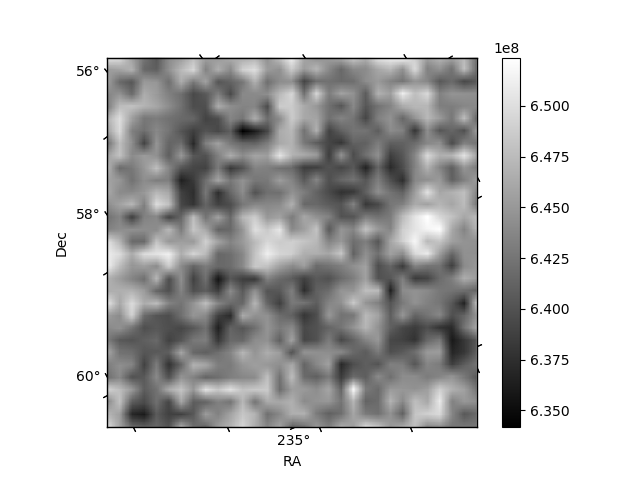
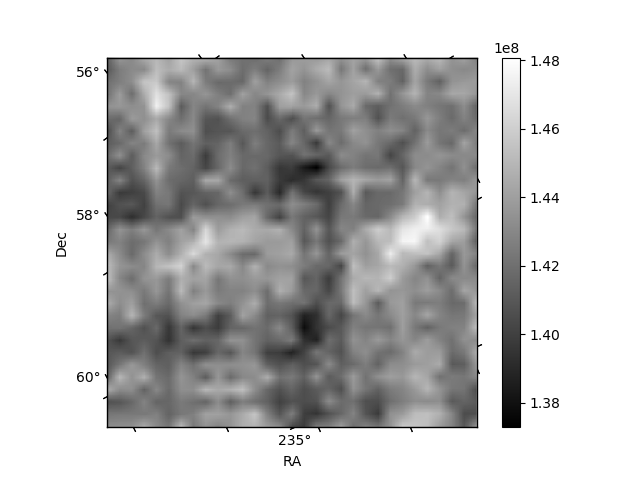
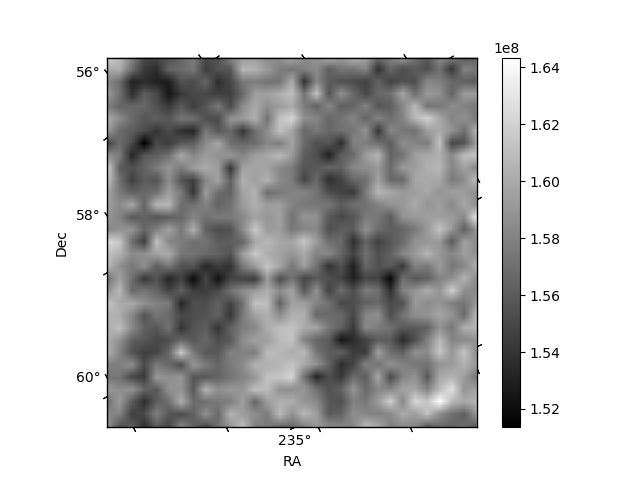
Histogram calculated using DETX and DETY for each event in the final _common_clean file
| Quadrant A | 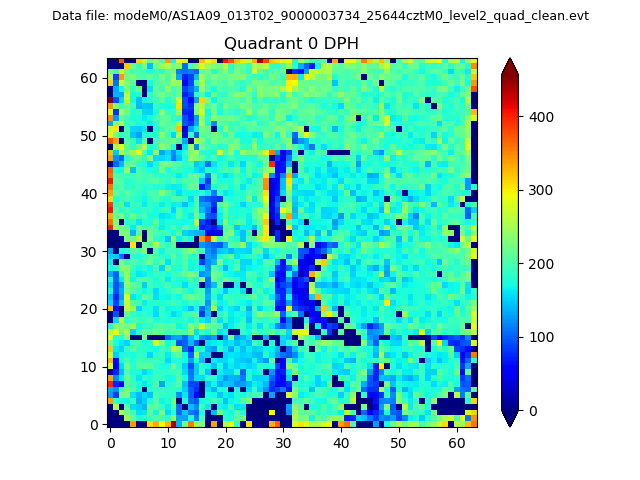 |
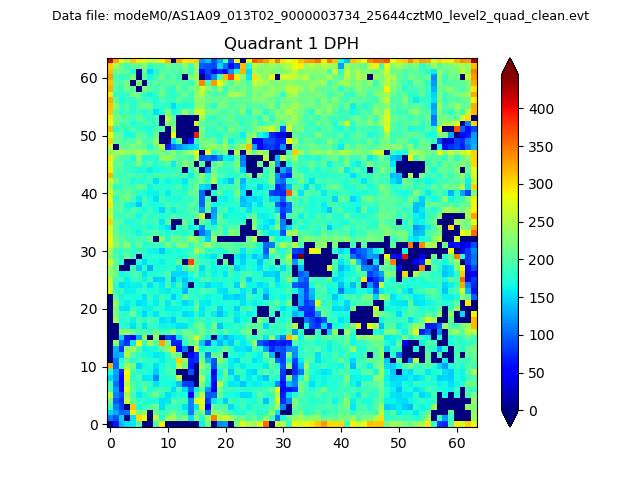 |
Quadrant B |
|---|---|---|---|
| Quadrant D | 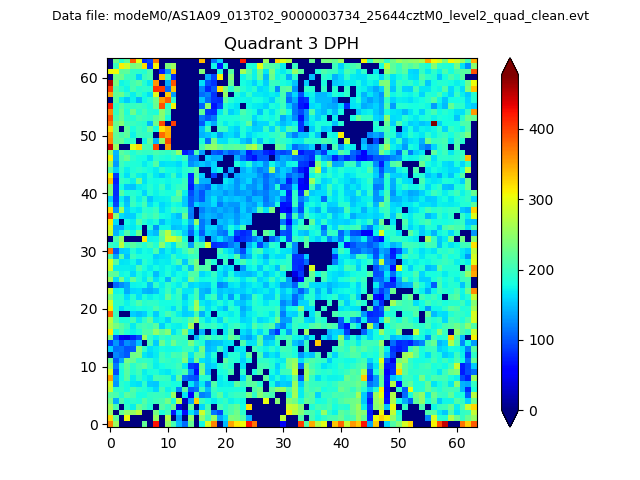 |
 |
Quadrant C |
| Plot type | Count rate plots | Images |
|---|---|---|
| Comparison with Poisson distribution Blue bars denote a histogram of data divided into 1 sec bins. Red curve is a Poisson curve with rate = median count rate of data. |
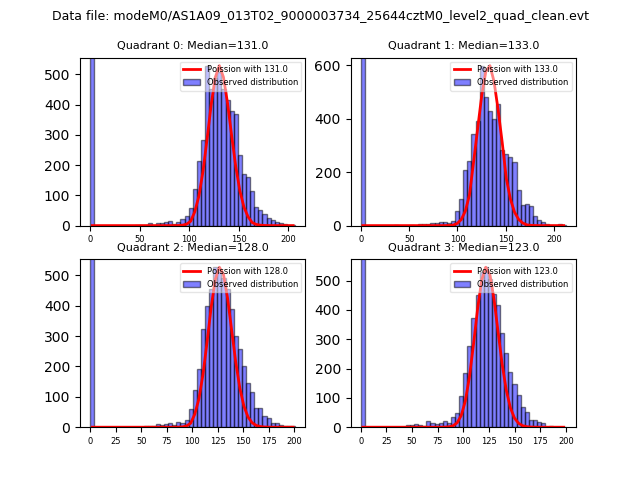 |
 |
| Quadrant-wise count rates Data is divided into 100 sec bins |
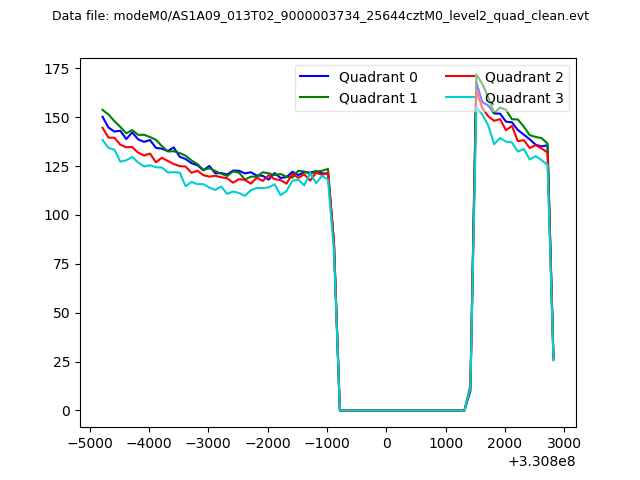 |
|
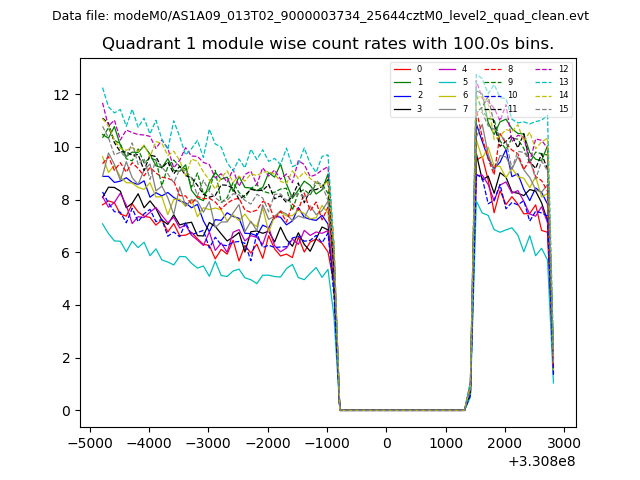
| Module-wise count rates for Quadrant A Data is divided into 100 sec bins |
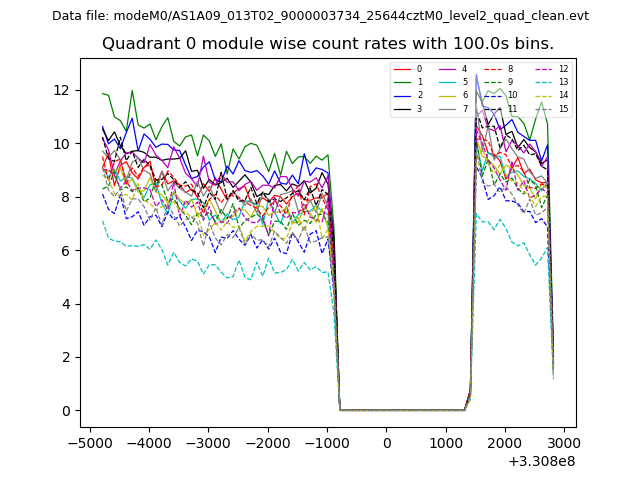 |
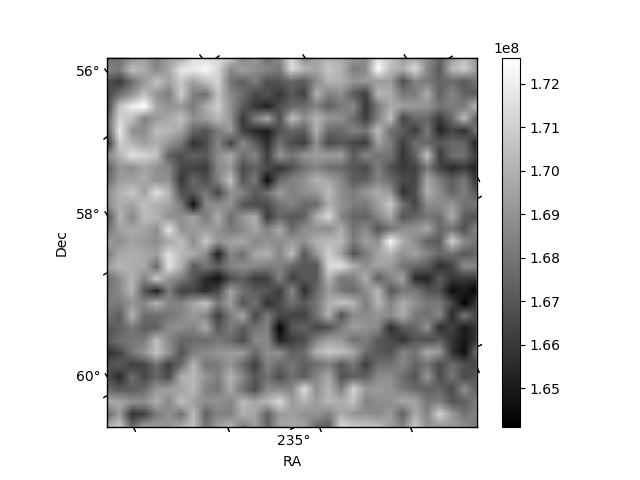 |
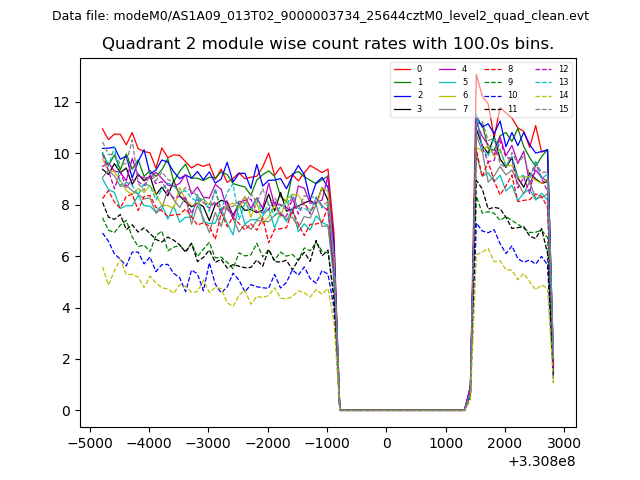
| Module-wise count rates for Quadrant B Data is divided into 100 sec bins |
 |
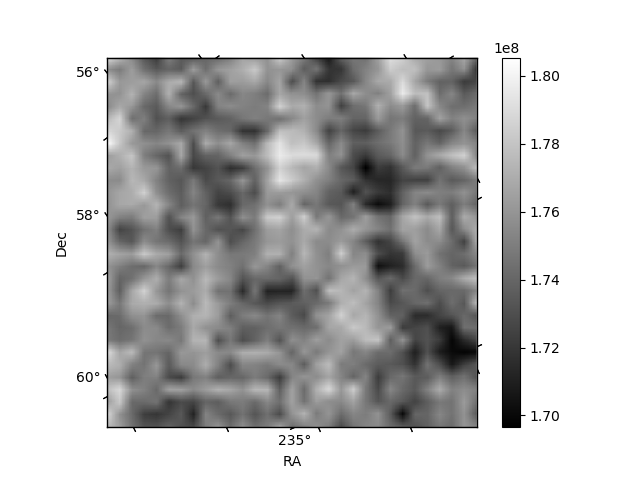 |
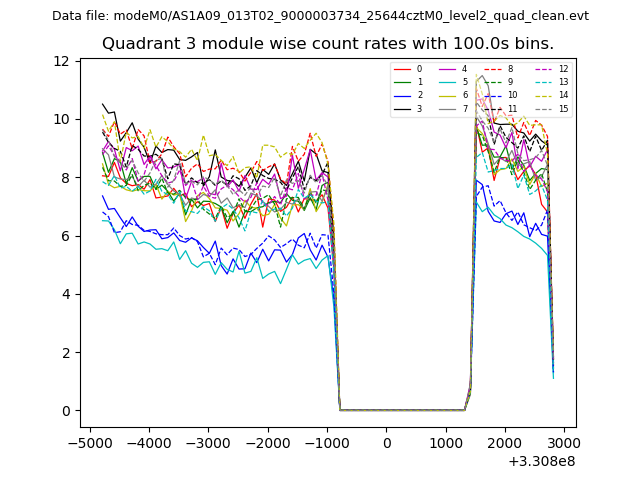
| Module-wise count rates for Quadrant C Data is divided into 100 sec bins |
 |
 |
| Module-wise count rates for Quadrant D Data is divided into 100 sec bins |
 |
 |
| Parameter | Plot |
|---|---|
| CZT HV Monitor | 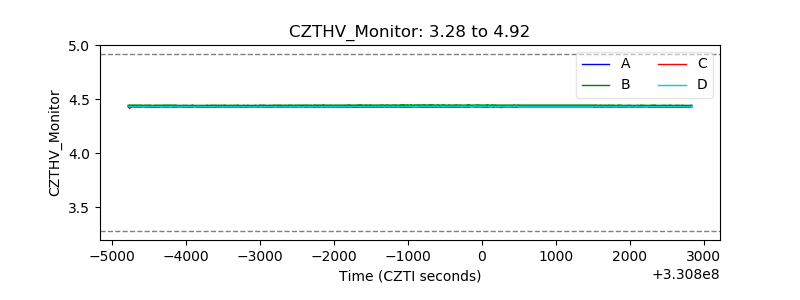 |
| D_VDD | 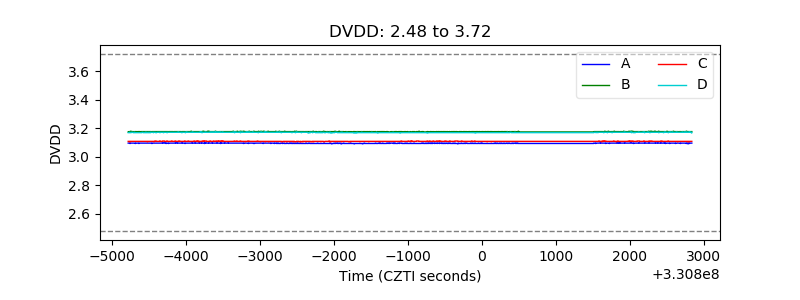 |
| Temperature 1 | 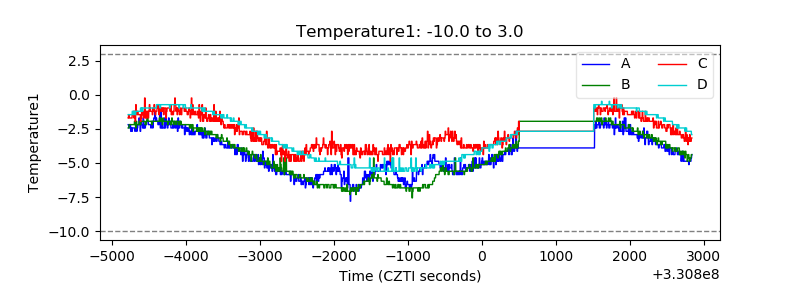 |
| Veto HV Monitor | 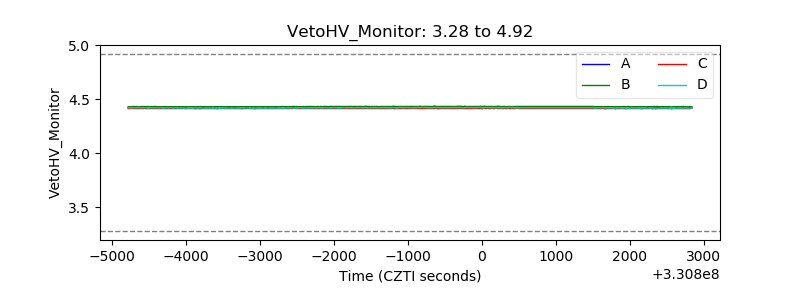 |
| Veto LLD |  |
| Alpha Counter |  |
| _CPM_Rate | 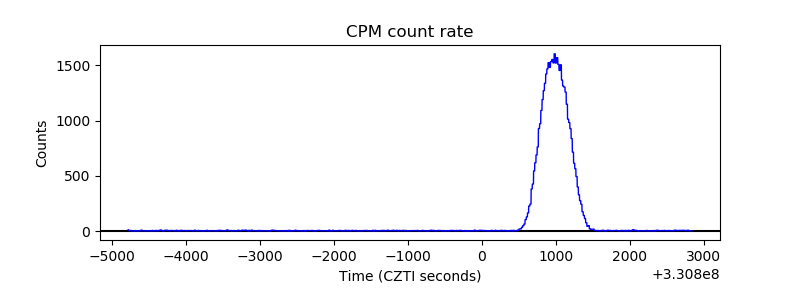 |
| CZT Counter | 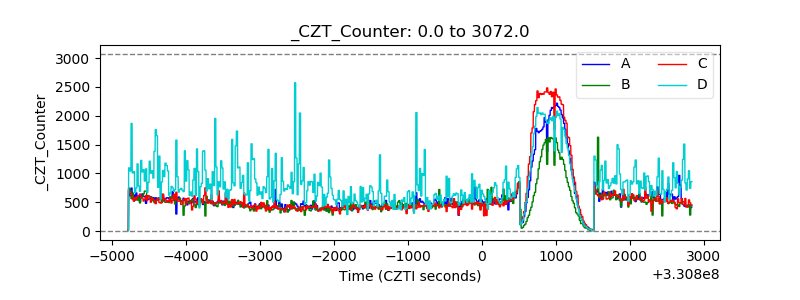 |
| +2.5 Volts monitor |  |
| +5 Volts monitor |  |
| _ROLL_ROT | 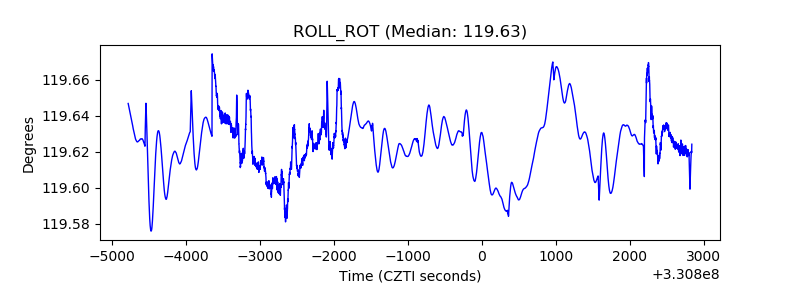 |
| _Roll_DEC | 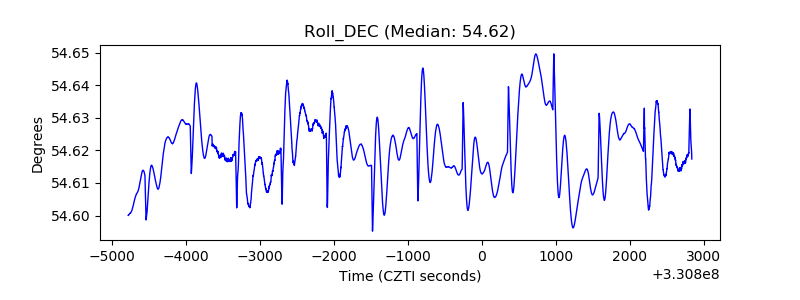 |
| _Roll_RA | 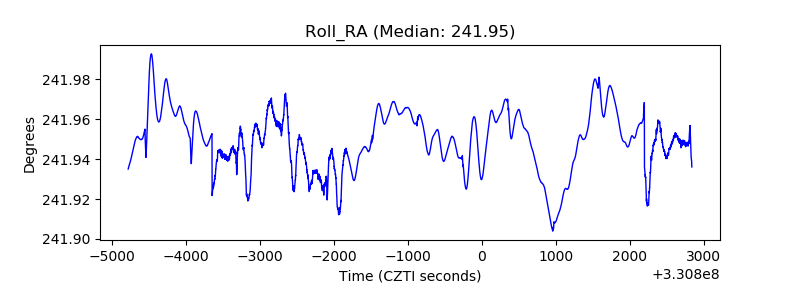 |
| Veto Counter | 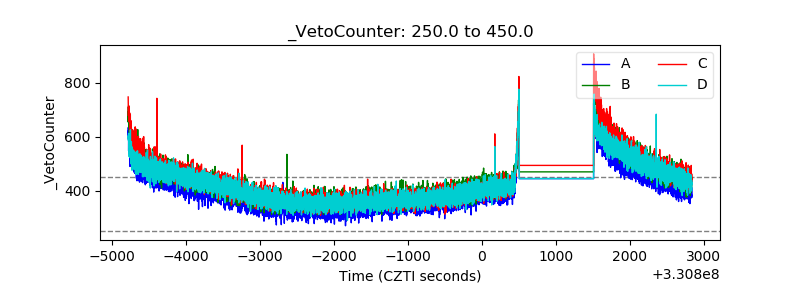 |