| Param | Original file | Final file |
|---|---|---|
| Filename | modeM0/AS1A09_013T02_9000003734_25646cztM0_level2.evt | modeM0/AS1A09_013T02_9000003734_25646cztM0_level2_quad_clean.evt |
| Size (bytes) | 500,339,520 | 105,419,520 |
| Size | 477.2 MB | 100.5 MB |
| Events in quadrant A | 3,503,650 | 692,280 |
| Events in quadrant B | 3,214,117 | 707,061 |
| Events in quadrant C | 3,263,699 | 683,410 |
| Events in quadrant D | 4,728,167 | 654,306 |
| Mode M9 | |||
|---|---|---|---|
| Quadrant | BADHDUFLAG | Total packets | Discarded packets |
| A | 0 | 15 | 0 |
| B | 0 | 16 | 0 |
| C | 0 | 16 | 0 |
| D | 0 | 16 | 0 |
| Mode M0 | |||
|---|---|---|---|
| Quadrant | BADHDUFLAG | Total packets | Discarded packets |
| A | 0 | 14717 | 0 |
| B | 0 | 13960 | 0 |
| C | 0 | 14059 | 0 |
| D | 0 | 18533 | 0 |
| Quadrant | Total seconds | Saturated seconds | Saturation percentage |
|---|---|---|---|
| A | 6536 | 36 | 0.550796% |
| B | 6536 | 42 | 0.642595% |
| C | 6536 | 98 | 1.499388% |
| D | 6536 | 150 | 2.294982% |
Noise dominated data is calculated using 1-second bins in cleaned event files. If a bin has >2000 counts, and if more than 50% of those come from <1% of pixels, then it is considered to be noise-dominated and hence unusable.
| Quadrant | # 1 sec bins | Bins with >0 counts | Bins with >2000 counts | High rate bins dominated by noise | Noise dominated (total time) | Noise dominated (detector-on time) | Marked lightcurve |
|---|---|---|---|---|---|---|---|
| A | 7656 | 6537 | 0 | 0 | 0.00% | 0.00% | 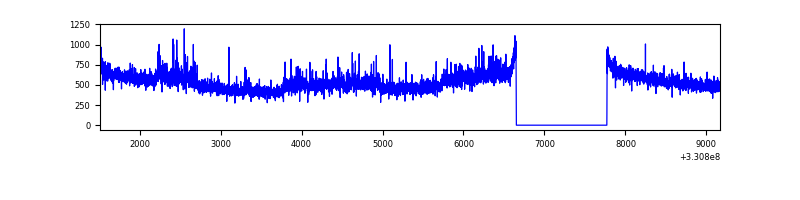 |
| B | 7656 | 6537 | 1 | 1 | 0.01% | 0.02% | 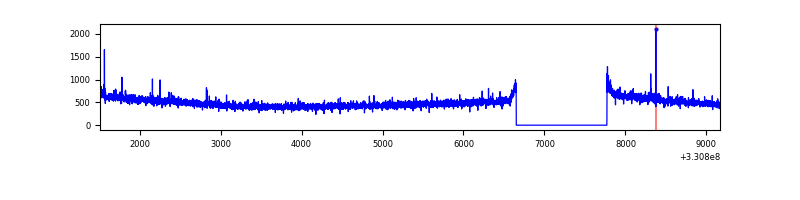 |
| C | 7656 | 6537 | 0 | 0 | 0.00% | 0.00% | 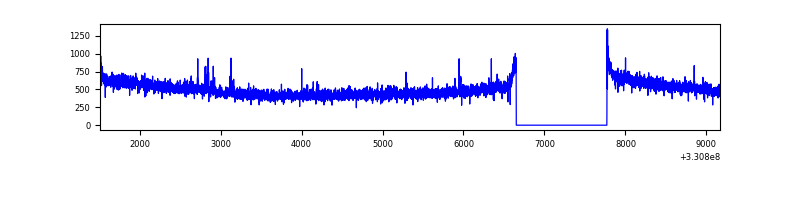 |
| D | 7656 | 6537 | 81 | 81 | 1.06% | 1.24% | 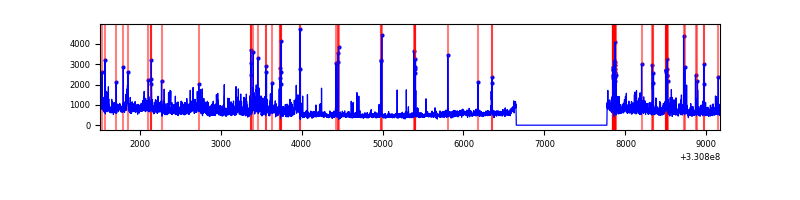 |
Top three noisy pixels from each quadrant. If the there are fewer than three noisy pixels in the level2.evt file, extra rows are filled as -1
| Pixel properties | Quadrant properties | ||||||
|---|---|---|---|---|---|---|---|
| Quadrant | DetID | PixID | Counts | Sigma | Mean | Median | Sigma |
| A | 8 | 192 | 376834 | 2327.6 | 810 | 795 | 161.6 |
| A | 13 | 254 | 10143 | 57.86 | 810 | 795 | 161.6 |
| A | 3 | 137 | 7274 | 40.1 | 810 | 795 | 161.6 |
| B | 12 | 111 | 18157 | 114.68 | 810 | 789 | 151.4 |
| B | 11 | 111 | 16181 | 101.63 | 810 | 789 | 151.4 |
| B | 3 | 112 | 14453 | 90.22 | 810 | 789 | 151.4 |
| C | 14 | 238 | 127612 | 690.08 | 791 | 794 | 183.8 |
| C | 3 | 233 | 46789 | 250.28 | 791 | 794 | 183.8 |
| C | 13 | 61 | 5364 | 24.87 | 791 | 794 | 183.8 |
| D | 8 | 195 | 844328 | 4434.53 | 791 | 767 | 190.2 |
| D | 1 | 52 | 728318 | 3824.67 | 791 | 767 | 190.2 |
| D | 2 | 244 | 122025 | 637.44 | 791 | 767 | 190.2 |
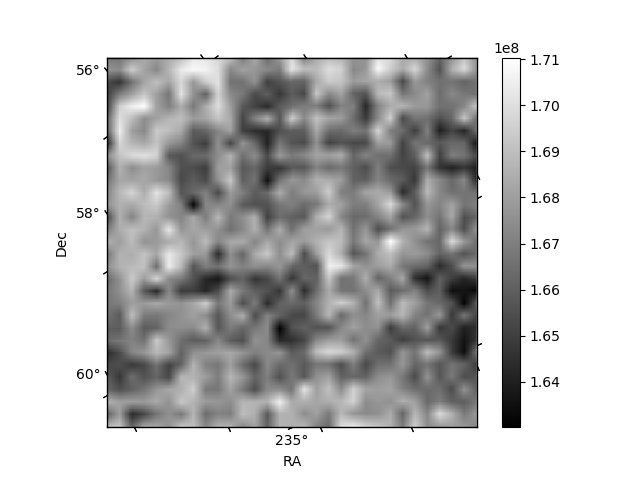
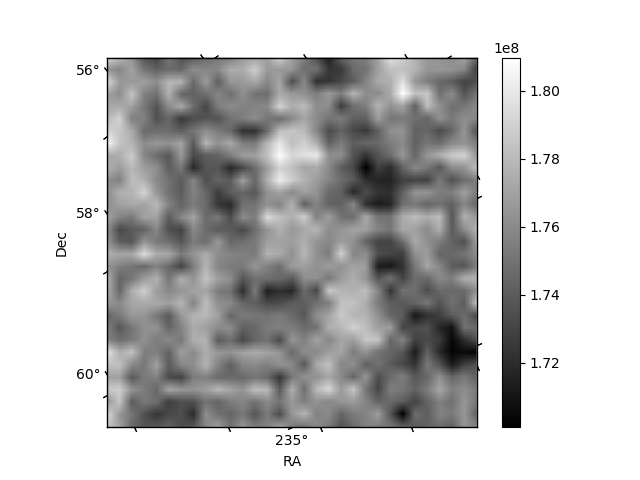
Histogram calculated using DETX and DETY for each event in the final _common_clean file
| Quadrant A | 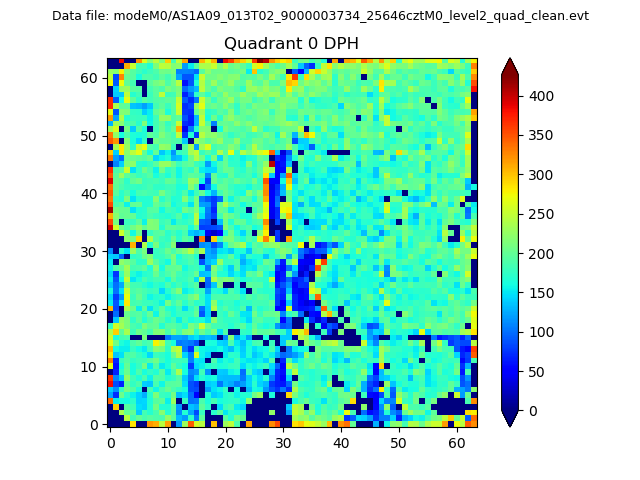 |
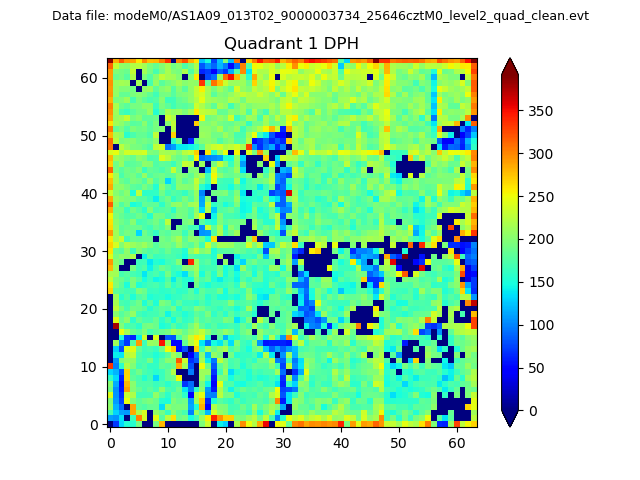 |
Quadrant B |
|---|---|---|---|
| Quadrant D | 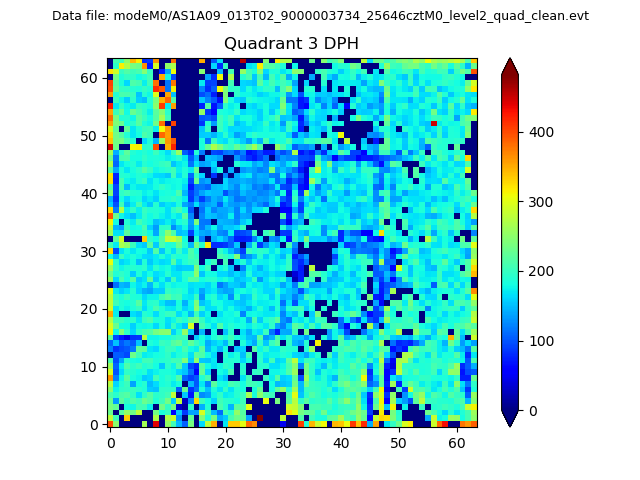 |
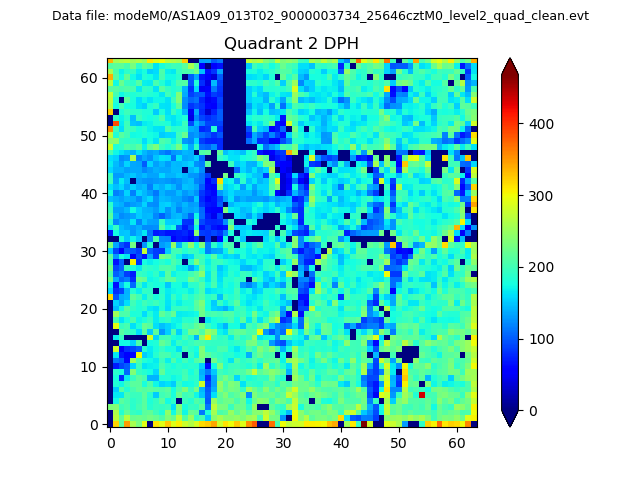 |
Quadrant C |
| Plot type | Count rate plots | Images |
|---|---|---|
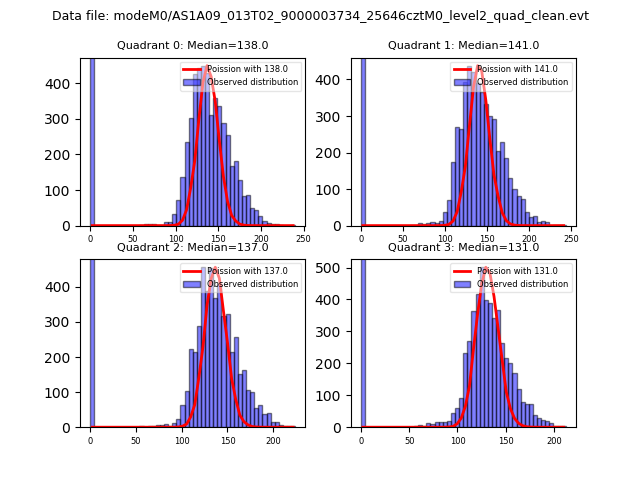
| Comparison with Poisson distribution Blue bars denote a histogram of data divided into 1 sec bins. Red curve is a Poisson curve with rate = median count rate of data. |
 |
 |
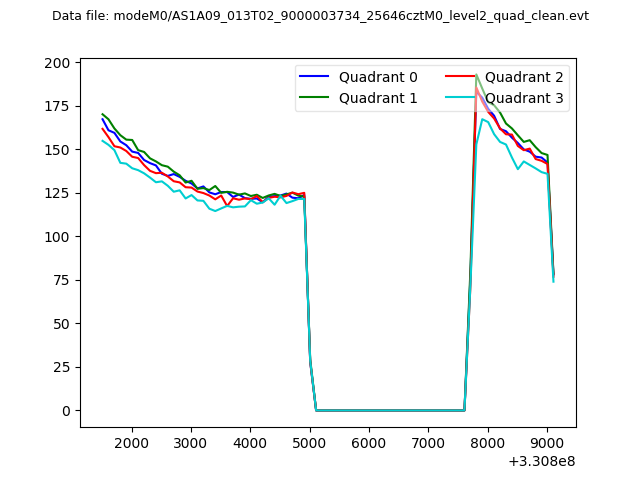
| Quadrant-wise count rates Data is divided into 100 sec bins |
 |
|
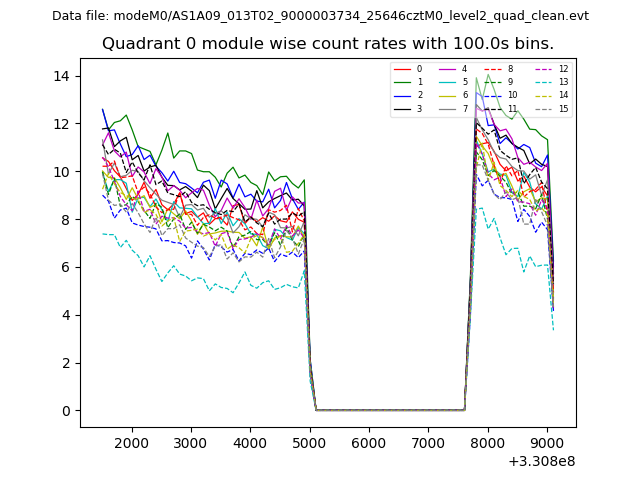
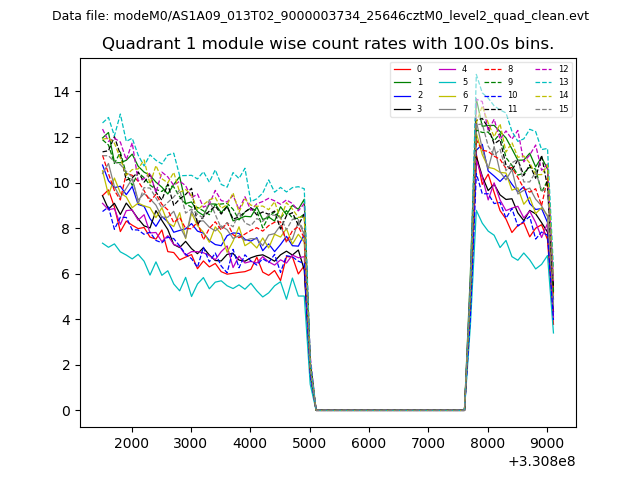
| Module-wise count rates for Quadrant A Data is divided into 100 sec bins |
 |
 |
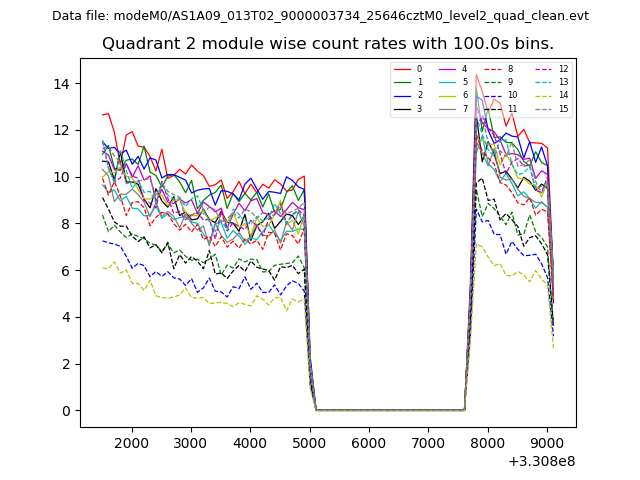
| Module-wise count rates for Quadrant B Data is divided into 100 sec bins |
 |
 |
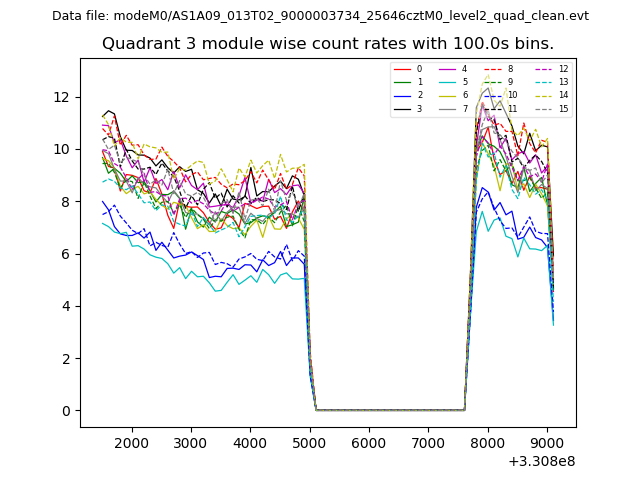
| Module-wise count rates for Quadrant C Data is divided into 100 sec bins |
 |
 |
| Module-wise count rates for Quadrant D Data is divided into 100 sec bins |
 |
 |
| Parameter | Plot |
|---|---|
| CZT HV Monitor | 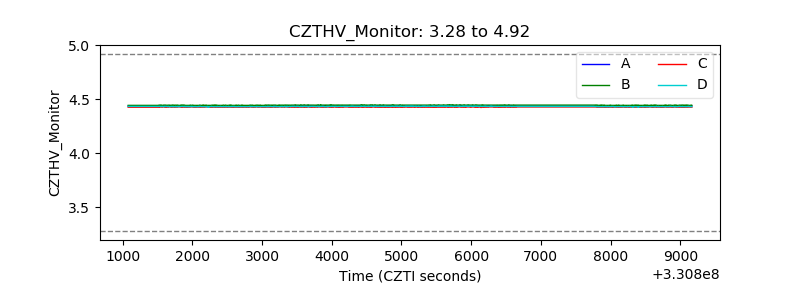 |
| D_VDD | 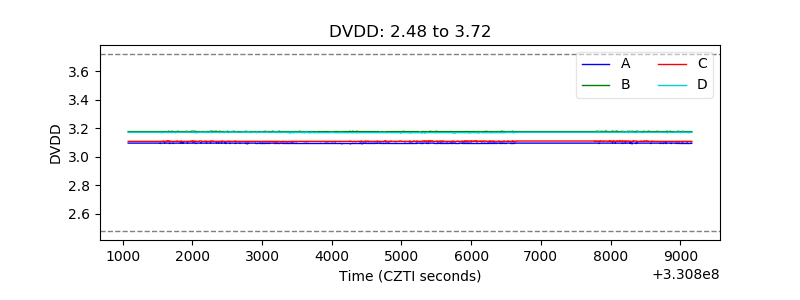 |
| Temperature 1 | 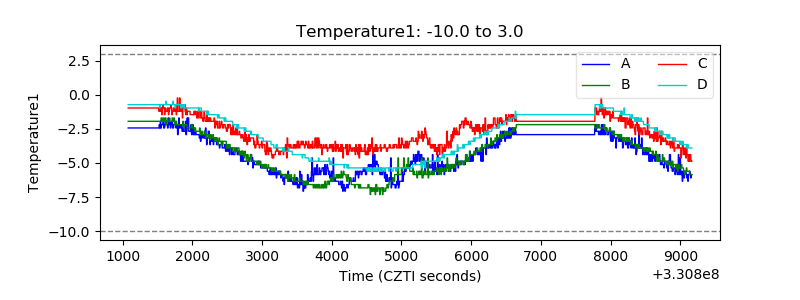 |
| Veto HV Monitor | 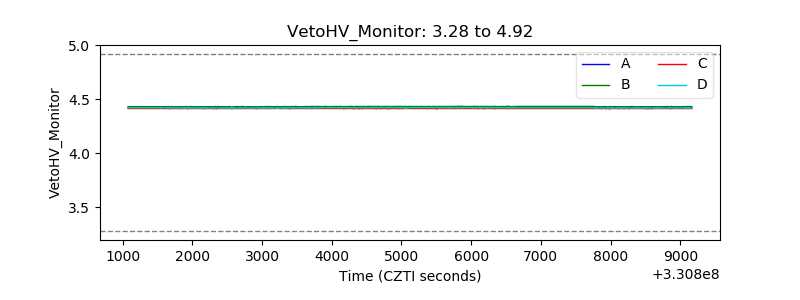 |
| Veto LLD | 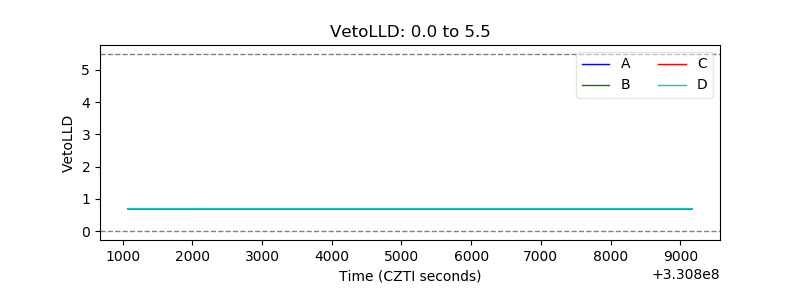 |
| Alpha Counter |  |
| _CPM_Rate | 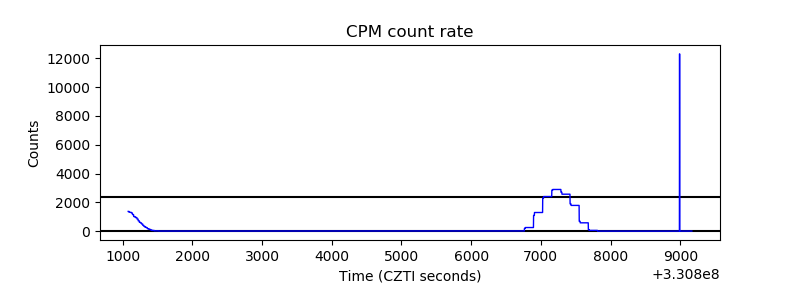 |
| CZT Counter | 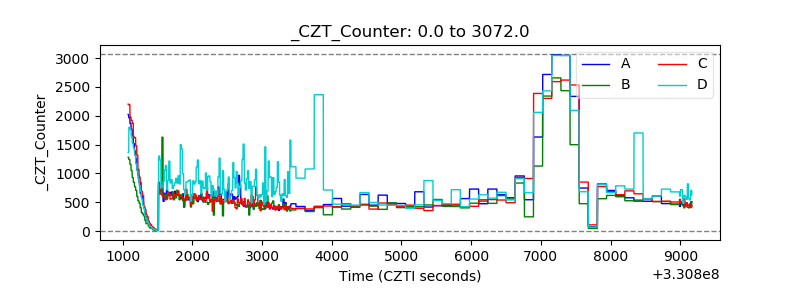 |
| +2.5 Volts monitor |  |
| +5 Volts monitor |  |
| _ROLL_ROT | 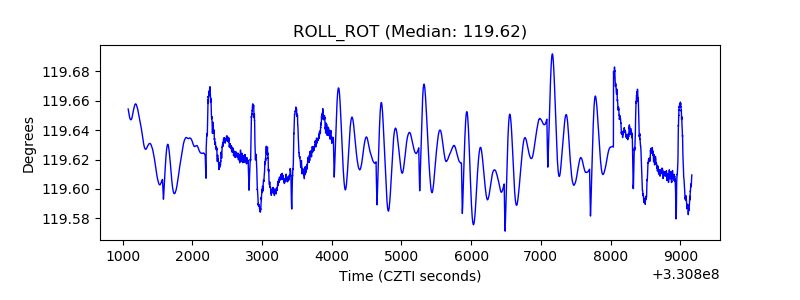 |
| _Roll_DEC | 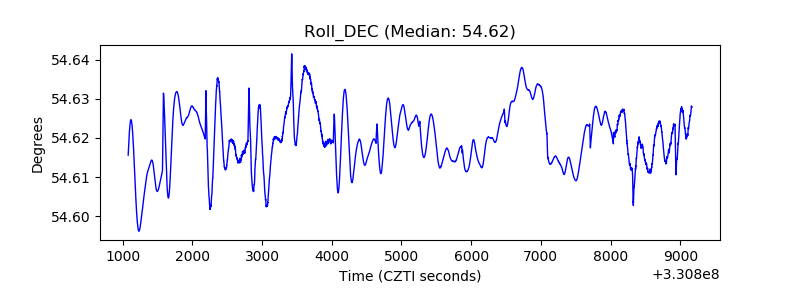 |
| _Roll_RA | 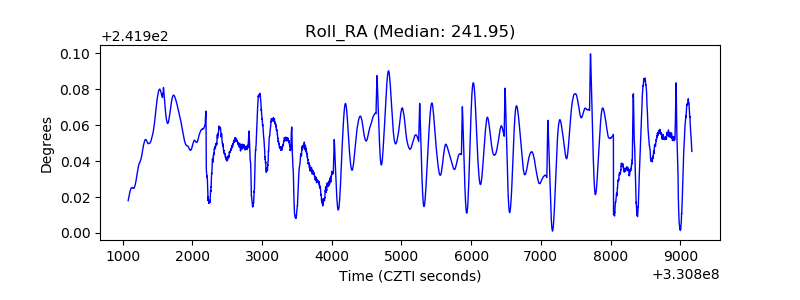 |
| Veto Counter | 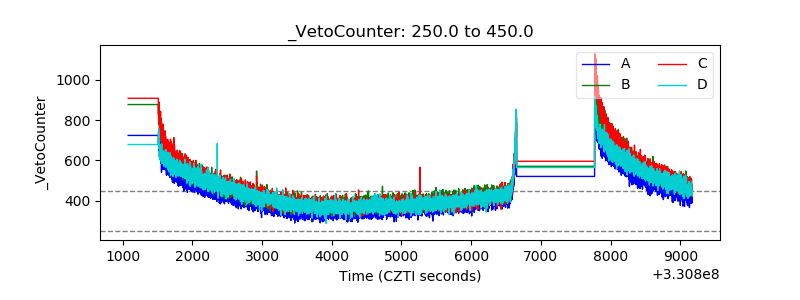 |