| Param | Original file | Final file |
|---|---|---|
| Filename | modeM0/AS1A09_013T02_9000003734_25647cztM0_level2.evt | modeM0/AS1A09_013T02_9000003734_25647cztM0_level2_quad_clean.evt |
| Size (bytes) | 469,926,720 | 103,201,920 |
| Size | 448.2 MB | 98.4 MB |
| Events in quadrant A | 3,182,820 | 678,732 |
| Events in quadrant B | 3,113,065 | 702,297 |
| Events in quadrant C | 3,186,813 | 674,454 |
| Events in quadrant D | 4,331,397 | 640,257 |
| Mode M9 | |||
|---|---|---|---|
| Quadrant | BADHDUFLAG | Total packets | Discarded packets |
| A | 0 | 13 | 0 |
| B | 0 | 13 | 0 |
| C | 0 | 13 | 0 |
| D | 0 | 13 | 0 |
| Mode M0 | |||
|---|---|---|---|
| Quadrant | BADHDUFLAG | Total packets | Discarded packets |
| A | 0 | 13495 | 0 |
| B | 0 | 13346 | 0 |
| C | 0 | 13536 | 0 |
| D | 0 | 17116 | 0 |
| Quadrant | Total seconds | Saturated seconds | Saturation percentage |
|---|---|---|---|
| A | 6159 | 8 | 0.129891% |
| B | 6159 | 20 | 0.324728% |
| C | 6160 | 69 | 1.120130% |
| D | 6160 | 101 | 1.639610% |
Noise dominated data is calculated using 1-second bins in cleaned event files. If a bin has >2000 counts, and if more than 50% of those come from <1% of pixels, then it is considered to be noise-dominated and hence unusable.
| Quadrant | # 1 sec bins | Bins with >0 counts | Bins with >2000 counts | High rate bins dominated by noise | Noise dominated (total time) | Noise dominated (detector-on time) | Marked lightcurve |
|---|---|---|---|---|---|---|---|
| A | 7424 | 6160 | 0 | 0 | 0.00% | 0.00% | 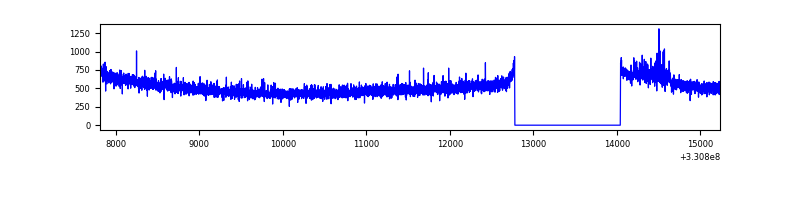 |
| B | 7424 | 6160 | 1 | 1 | 0.01% | 0.02% | 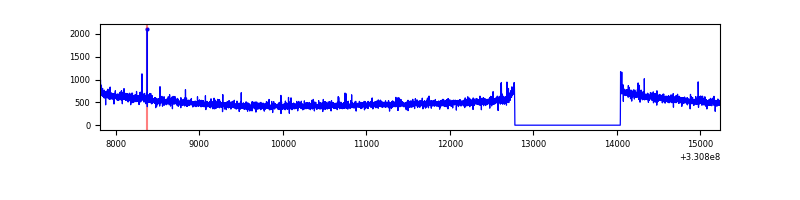 |
| C | 7425 | 6161 | 0 | 0 | 0.00% | 0.00% | 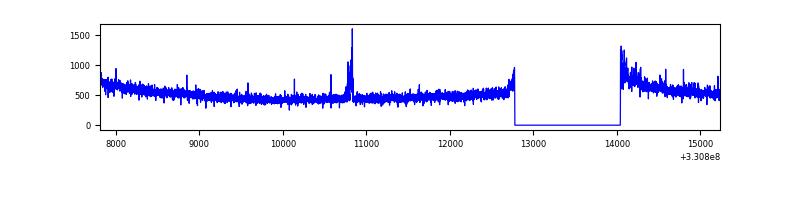 |
| D | 7425 | 6161 | 69 | 69 | 0.93% | 1.12% | 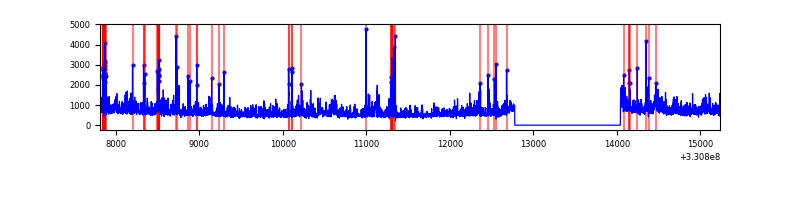 |
Top three noisy pixels from each quadrant. If the there are fewer than three noisy pixels in the level2.evt file, extra rows are filled as -1
| Pixel properties | Quadrant properties | ||||||
|---|---|---|---|---|---|---|---|
| Quadrant | DetID | PixID | Counts | Sigma | Mean | Median | Sigma |
| A | 8 | 192 | 182697 | 1174.02 | 777 | 762 | 155.0 |
| A | 13 | 254 | 9989 | 59.54 | 777 | 762 | 155.0 |
| A | 0 | 226 | 6806 | 39.0 | 777 | 762 | 155.0 |
| B | 12 | 111 | 16953 | 111.39 | 784 | 765 | 145.3 |
| B | 11 | 111 | 14989 | 97.87 | 784 | 765 | 145.3 |
| B | 14 | 111 | 13487 | 87.54 | 784 | 765 | 145.3 |
| C | 14 | 238 | 124922 | 704.78 | 764 | 769 | 176.2 |
| C | 3 | 233 | 72463 | 406.99 | 764 | 769 | 176.2 |
| C | 2 | 16 | 8623 | 44.58 | 764 | 769 | 176.2 |
| D | 8 | 195 | 703733 | 3839.6 | 760 | 738 | 183.1 |
| D | 1 | 52 | 507814 | 2769.53 | 760 | 738 | 183.1 |
| D | 2 | 244 | 208654 | 1135.59 | 760 | 738 | 183.1 |
Histogram calculated using DETX and DETY for each event in the final _common_clean file
| Quadrant A | 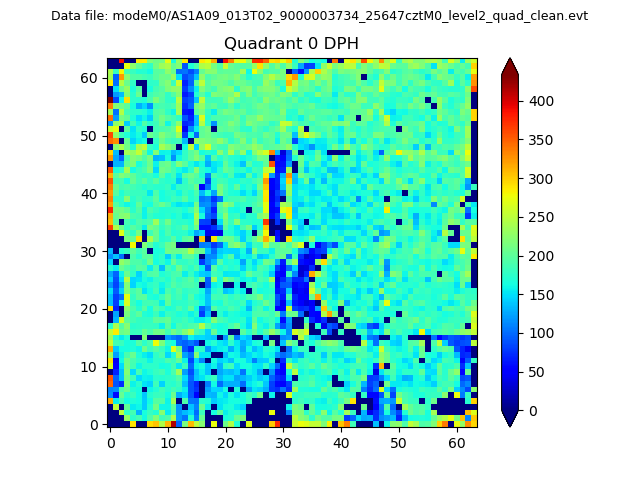 |
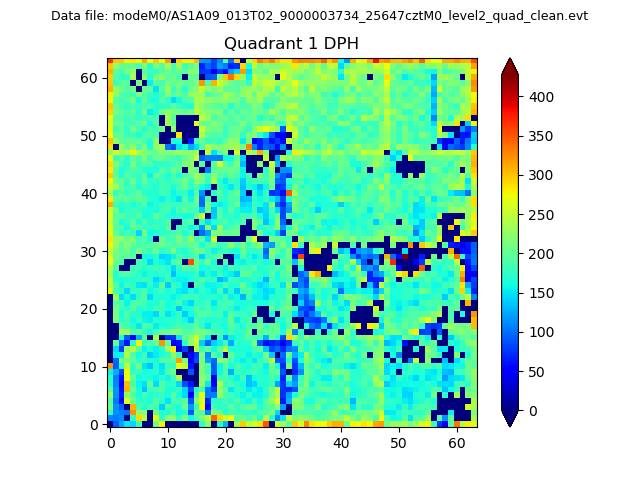 |
Quadrant B |
|---|---|---|---|
| Quadrant D | 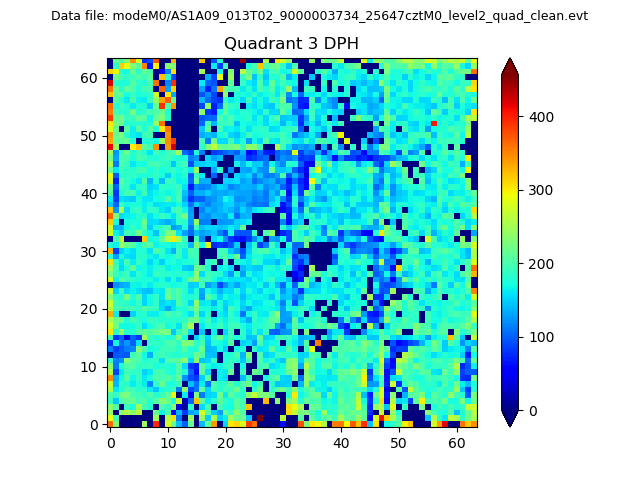 |
 |
Quadrant C |
| Plot type | Count rate plots | Images |
|---|---|---|
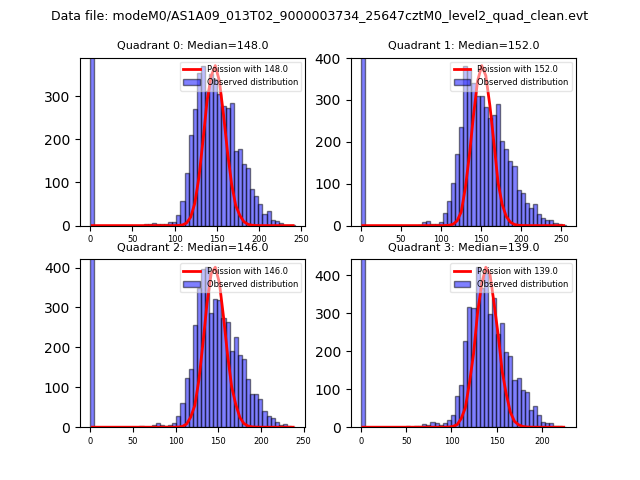
| Comparison with Poisson distribution Blue bars denote a histogram of data divided into 1 sec bins. Red curve is a Poisson curve with rate = median count rate of data. |
 |
 |
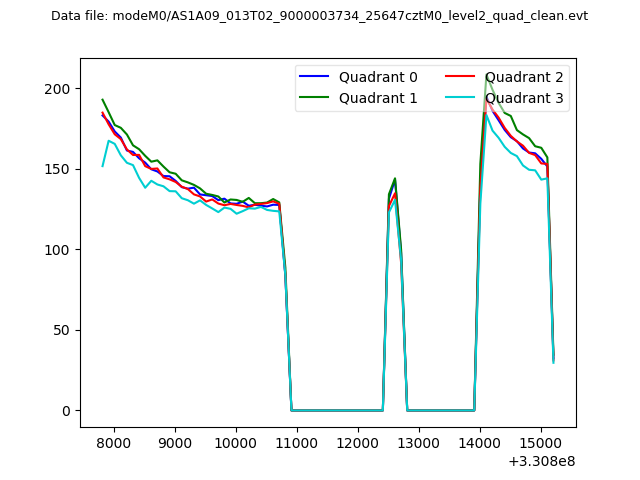
| Quadrant-wise count rates Data is divided into 100 sec bins |
 |
|
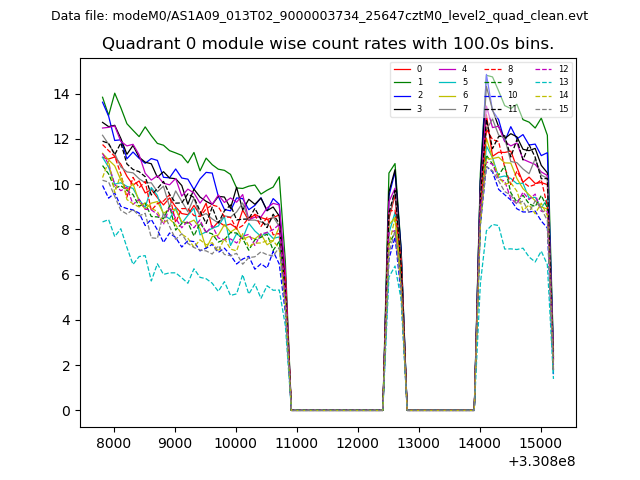
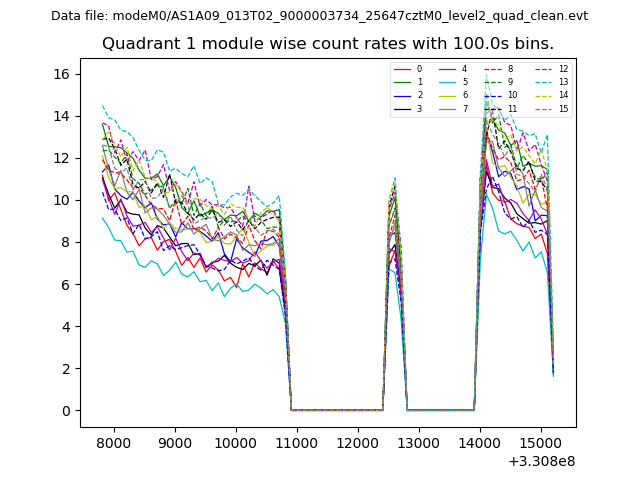
| Module-wise count rates for Quadrant A Data is divided into 100 sec bins |
 |
 |
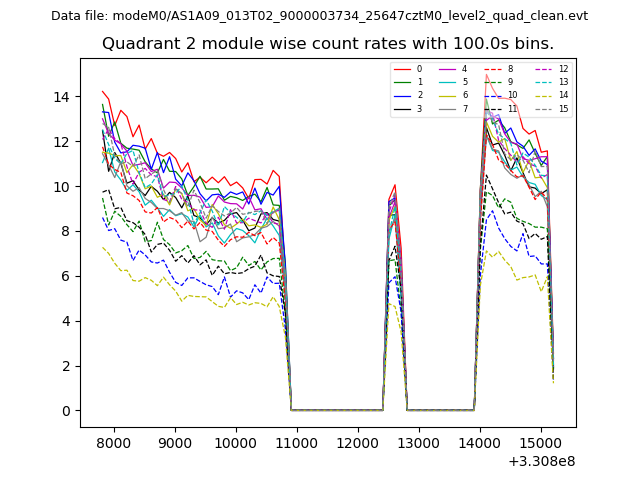
| Module-wise count rates for Quadrant B Data is divided into 100 sec bins |
 |
 |
| Module-wise count rates for Quadrant C Data is divided into 100 sec bins |
 |
 |
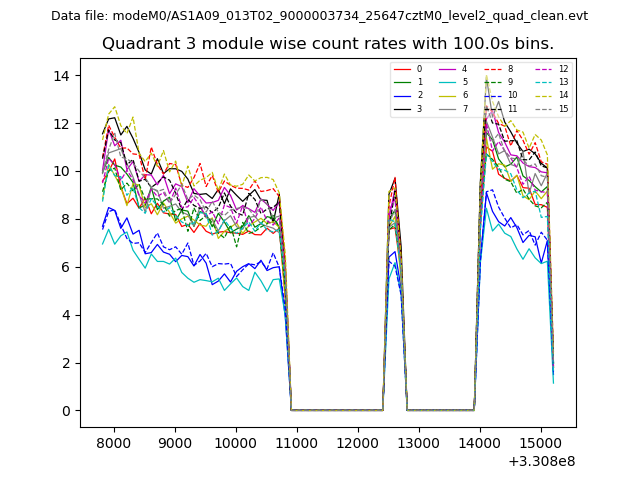
| Module-wise count rates for Quadrant D Data is divided into 100 sec bins |
 |
 |
| Parameter | Plot |
|---|---|
| CZT HV Monitor | 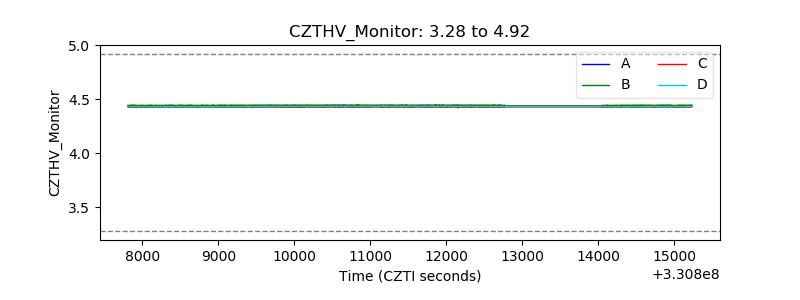 |
| D_VDD | 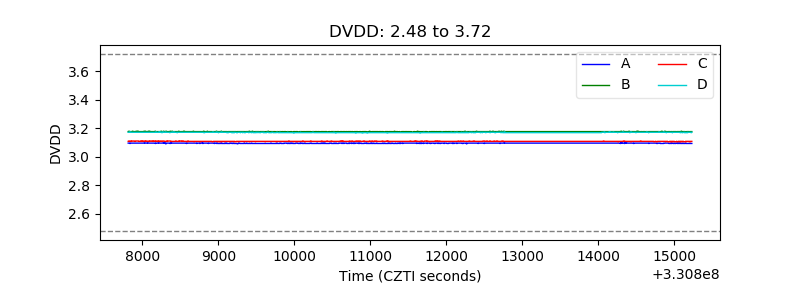 |
| Temperature 1 | 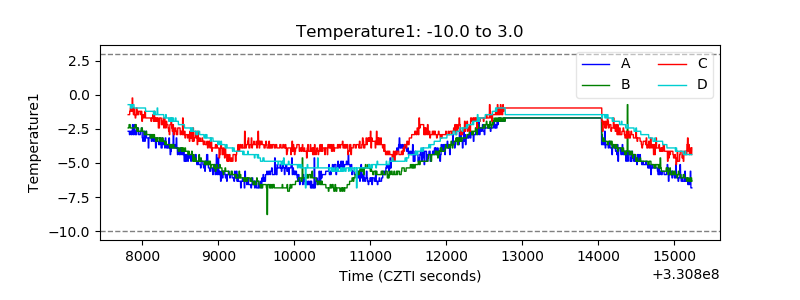 |
| Veto HV Monitor | 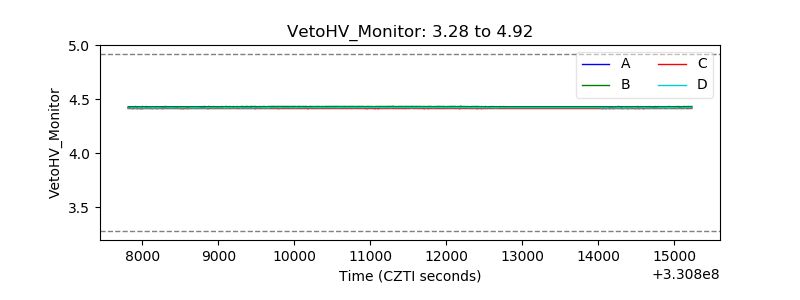 |
| Veto LLD | 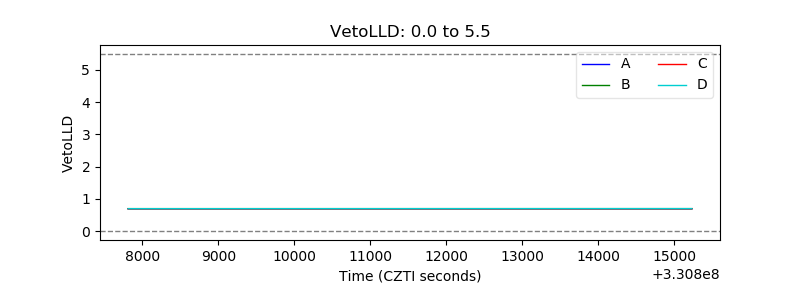 |
| Alpha Counter | 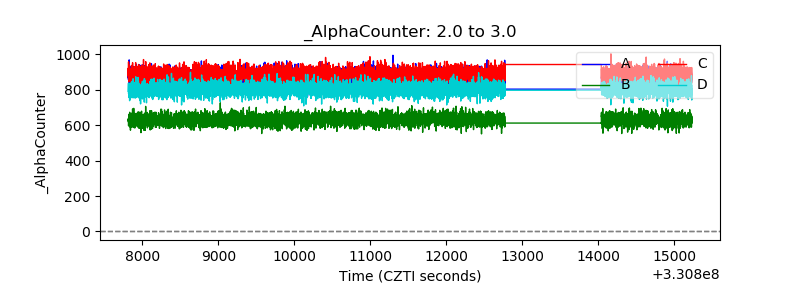 |
| _CPM_Rate | 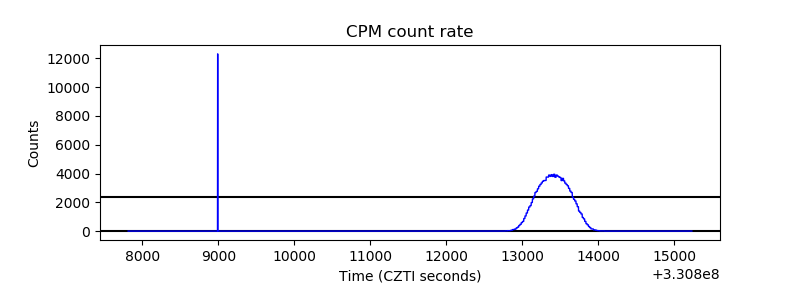 |
| CZT Counter | 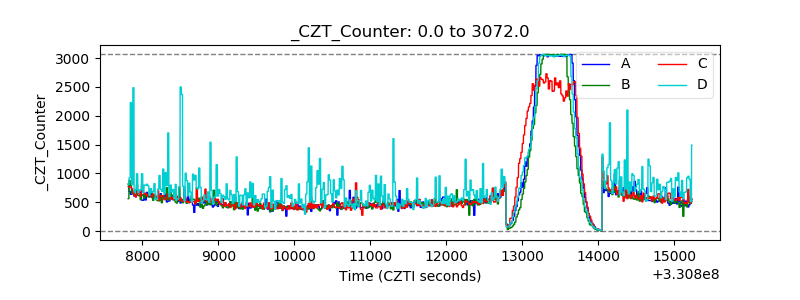 |
| +2.5 Volts monitor |  |
| +5 Volts monitor | 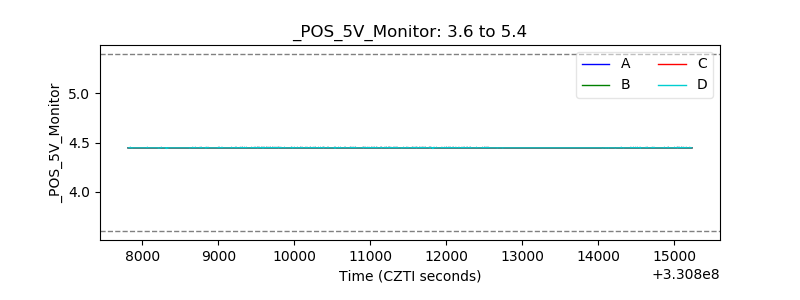 |
| _ROLL_ROT | 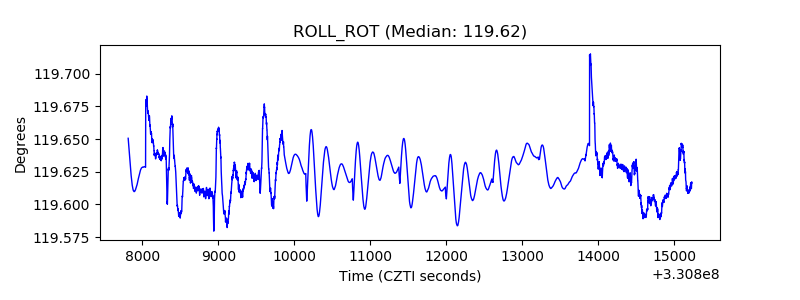 |
| _Roll_DEC | 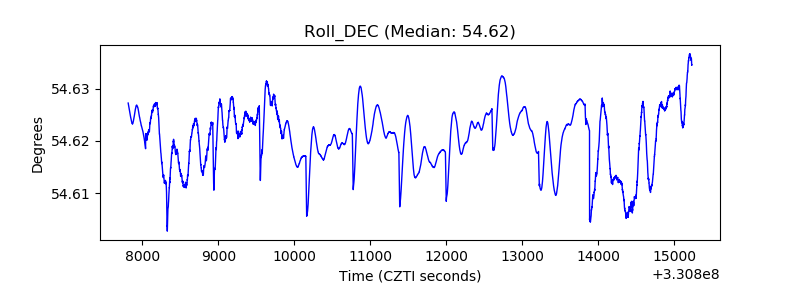 |
| _Roll_RA | 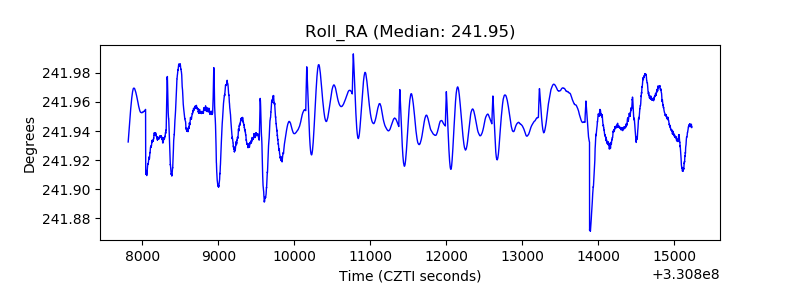 |
| Veto Counter | 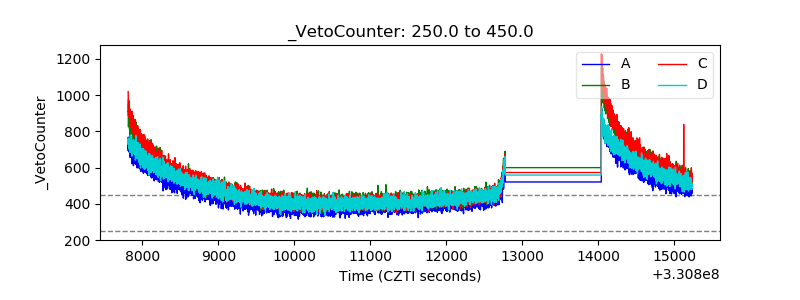 |