| Param | Original file | Final file |
|---|---|---|
| Filename | modeM0/AS1A09_013T02_9000003734_25648cztM0_level2.evt | modeM0/AS1A09_013T02_9000003734_25648cztM0_level2_quad_clean.evt |
| Size (bytes) | 473,149,440 | 108,057,600 |
| Size | 451.2 MB | 103.1 MB |
| Events in quadrant A | 3,250,423 | 716,209 |
| Events in quadrant B | 3,217,615 | 745,383 |
| Events in quadrant C | 3,290,078 | 710,022 |
| Events in quadrant D | 4,152,512 | 670,296 |
| Mode M9 | |||
|---|---|---|---|
| Quadrant | BADHDUFLAG | Total packets | Discarded packets |
| A | 0 | 15 | 0 |
| B | 0 | 16 | 0 |
| C | 0 | 16 | 0 |
| D | 0 | 16 | 0 |
| Mode M0 | |||
|---|---|---|---|
| Quadrant | BADHDUFLAG | Total packets | Discarded packets |
| A | 0 | 13558 | 0 |
| B | 0 | 13506 | 0 |
| C | 0 | 13693 | 0 |
| D | 0 | 16491 | 0 |
| Quadrant | Total seconds | Saturated seconds | Saturation percentage |
|---|---|---|---|
| A | 6170 | 28 | 0.453809% |
| B | 6170 | 51 | 0.826580% |
| C | 6170 | 92 | 1.491086% |
| D | 6170 | 83 | 1.345219% |
Noise dominated data is calculated using 1-second bins in cleaned event files. If a bin has >2000 counts, and if more than 50% of those come from <1% of pixels, then it is considered to be noise-dominated and hence unusable.
| Quadrant | # 1 sec bins | Bins with >0 counts | Bins with >2000 counts | High rate bins dominated by noise | Noise dominated (total time) | Noise dominated (detector-on time) | Marked lightcurve |
|---|---|---|---|---|---|---|---|
| A | 7490 | 6171 | 0 | 0 | 0.00% | 0.00% | 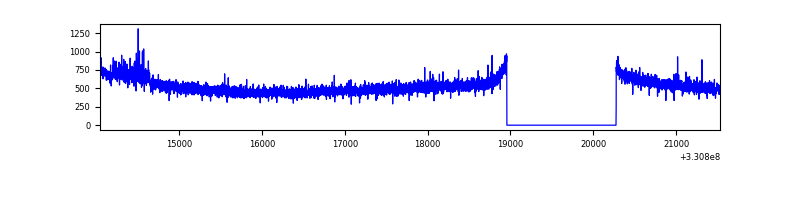 |
| B | 7490 | 6171 | 0 | 0 | 0.00% | 0.00% | 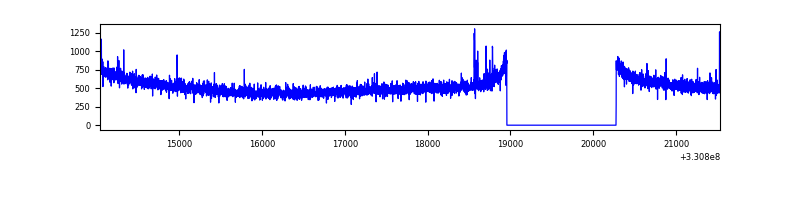 |
| C | 7490 | 6171 | 0 | 0 | 0.00% | 0.00% | 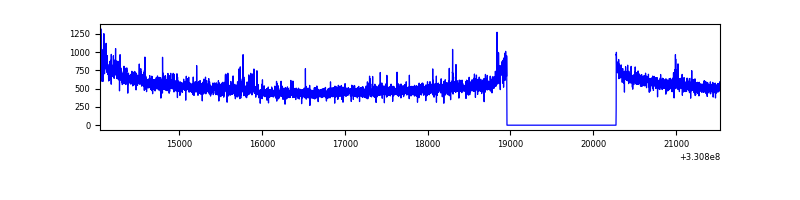 |
| D | 7490 | 6171 | 25 | 25 | 0.33% | 0.41% | 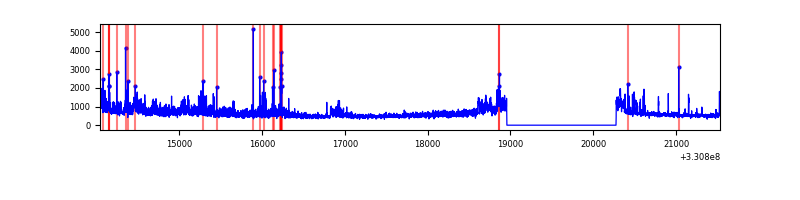 |
Top three noisy pixels from each quadrant. If the there are fewer than three noisy pixels in the level2.evt file, extra rows are filled as -1
| Pixel properties | Quadrant properties | ||||||
|---|---|---|---|---|---|---|---|
| Quadrant | DetID | PixID | Counts | Sigma | Mean | Median | Sigma |
| A | 8 | 192 | 173775 | 1088.24 | 798 | 786 | 159.0 |
| A | 13 | 254 | 9457 | 54.55 | 798 | 786 | 159.0 |
| A | 0 | 226 | 6687 | 37.12 | 798 | 786 | 159.0 |
| B | 0 | 219 | 17720 | 113.74 | 811 | 793 | 148.8 |
| B | 0 | 190 | 17473 | 112.08 | 811 | 793 | 148.8 |
| B | 12 | 111 | 17358 | 111.31 | 811 | 793 | 148.8 |
| C | 14 | 238 | 127621 | 706.22 | 785 | 792 | 179.6 |
| C | 3 | 233 | 79093 | 436.0 | 785 | 792 | 179.6 |
| C | 2 | 16 | 23795 | 128.09 | 785 | 792 | 179.6 |
| D | 8 | 195 | 608364 | 3260.09 | 778 | 754 | 186.4 |
| D | 1 | 52 | 560410 | 3002.79 | 778 | 754 | 186.4 |
| D | 2 | 244 | 29011 | 151.61 | 778 | 754 | 186.4 |
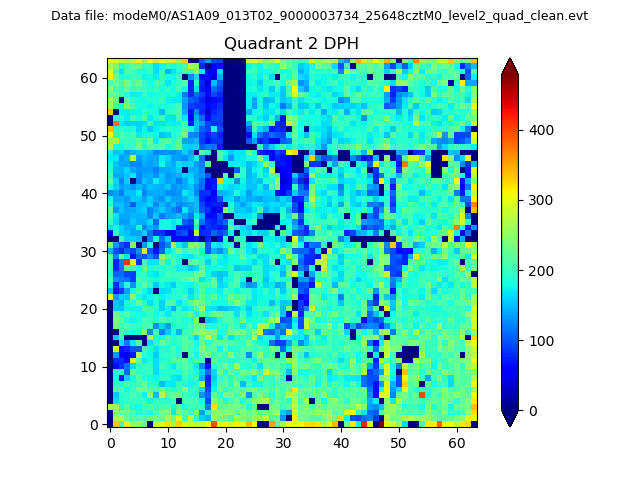
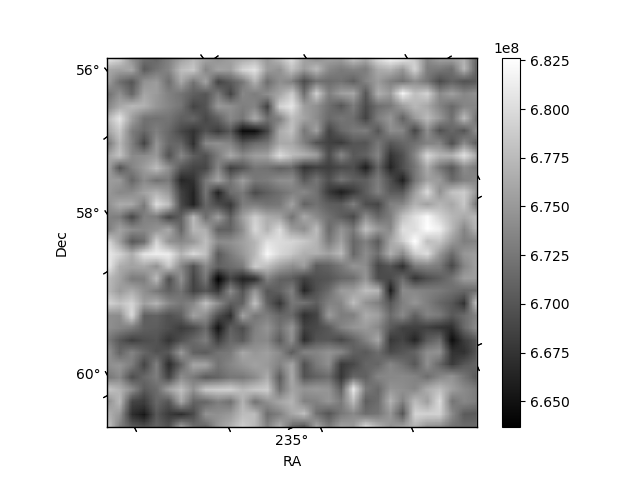
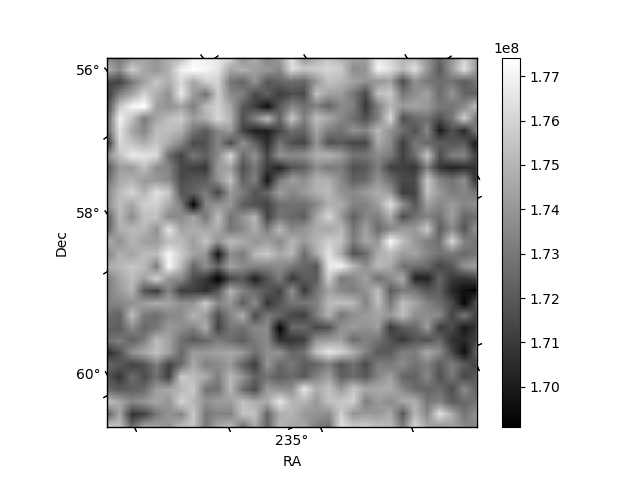
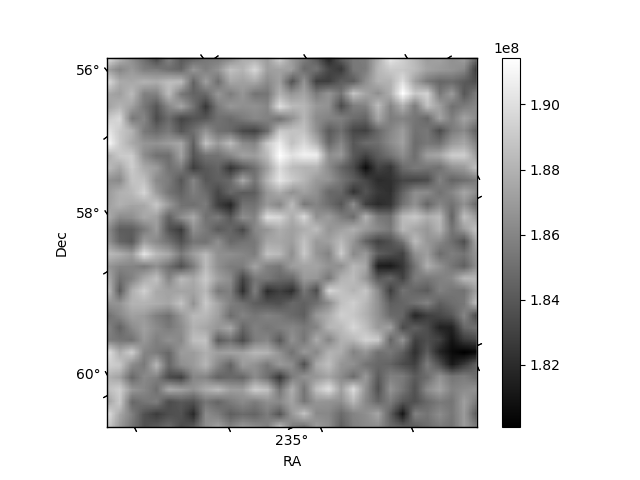
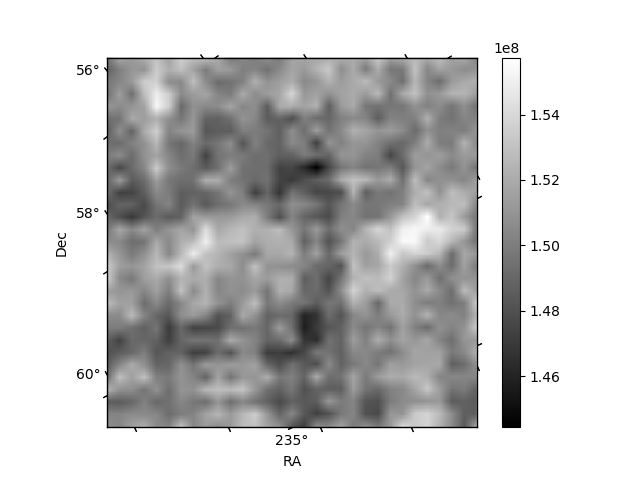
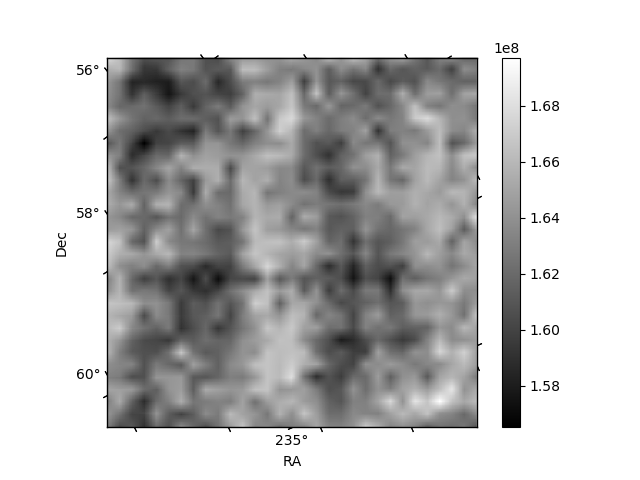
Histogram calculated using DETX and DETY for each event in the final _common_clean file
| Quadrant A | 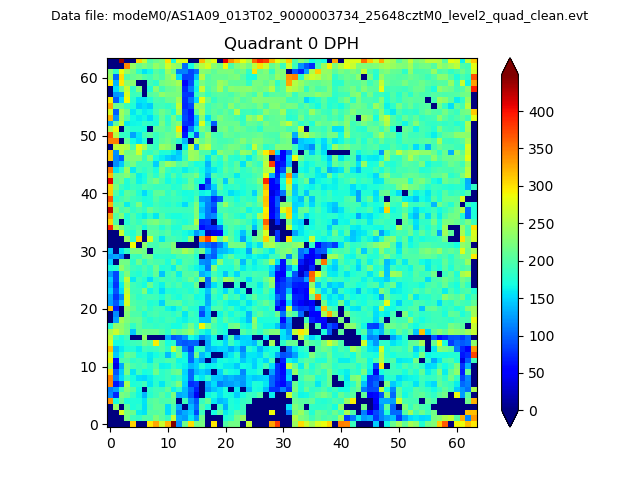 |
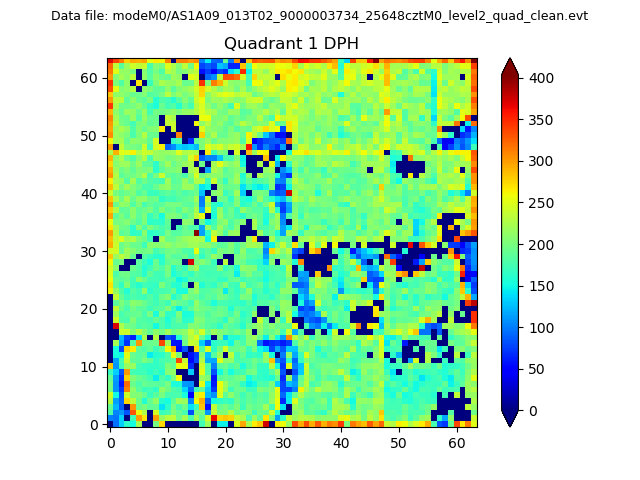 |
Quadrant B |
|---|---|---|---|
| Quadrant D | 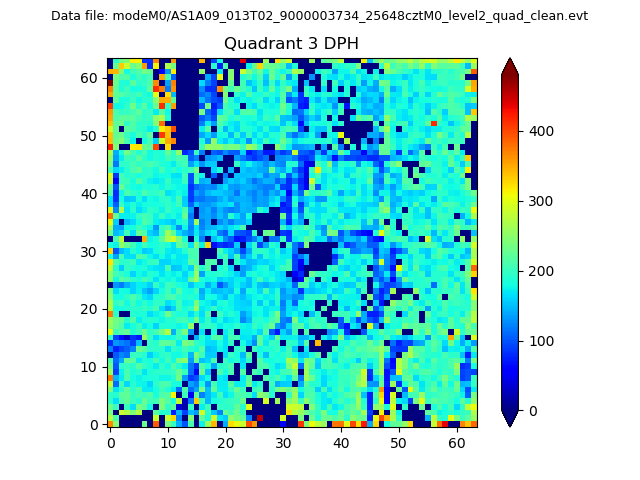 |
 |
Quadrant C |
| Plot type | Count rate plots | Images |
|---|---|---|
| Comparison with Poisson distribution Blue bars denote a histogram of data divided into 1 sec bins. Red curve is a Poisson curve with rate = median count rate of data. |
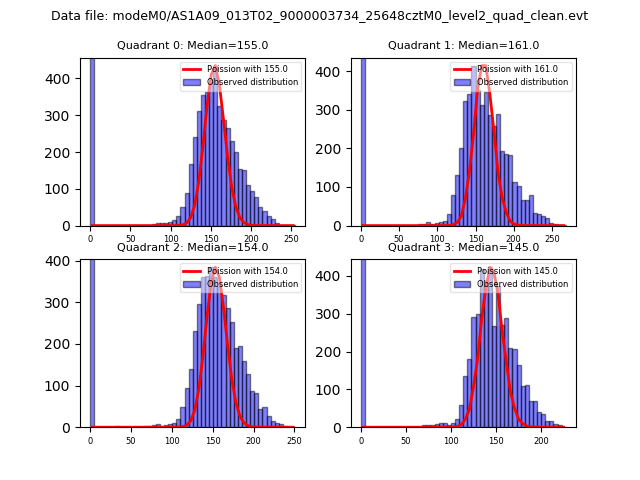 |
 |
| Quadrant-wise count rates Data is divided into 100 sec bins |
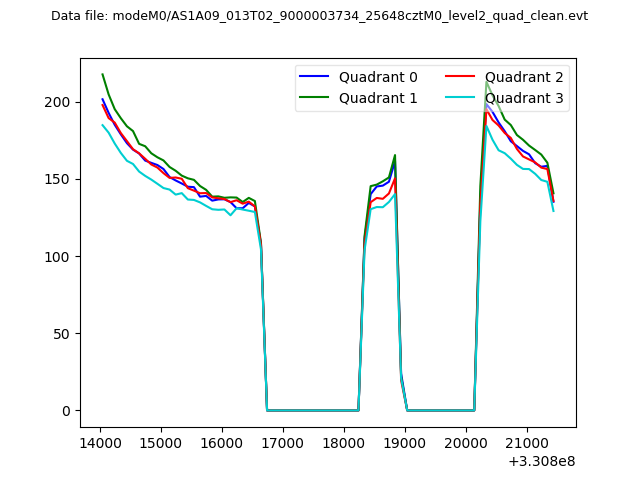 |
|
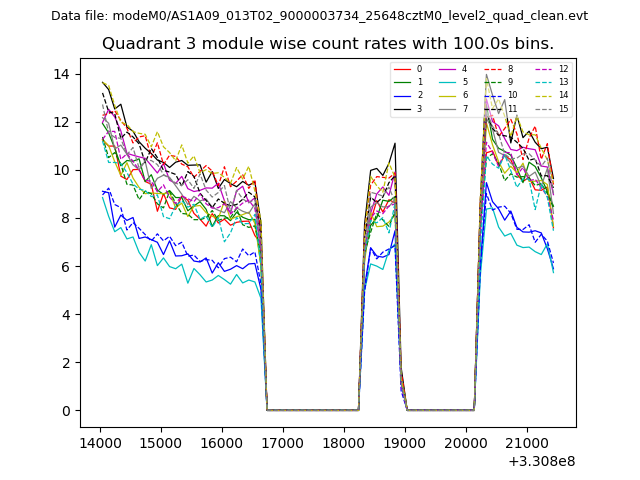
| Module-wise count rates for Quadrant A Data is divided into 100 sec bins |
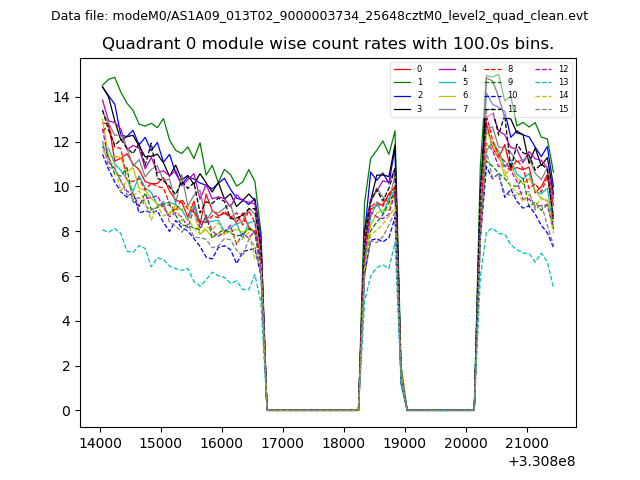 |
 |
| Module-wise count rates for Quadrant B Data is divided into 100 sec bins |
 |
 |
| Module-wise count rates for Quadrant C Data is divided into 100 sec bins |
 |
 |
| Module-wise count rates for Quadrant D Data is divided into 100 sec bins |
 |
 |
| Parameter | Plot |
|---|---|
| CZT HV Monitor |  |
| D_VDD | 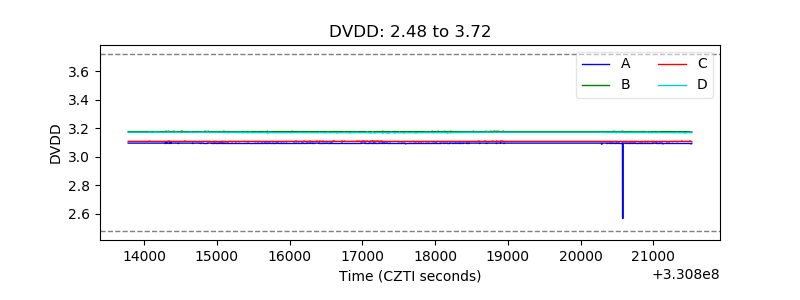 |
| Temperature 1 | 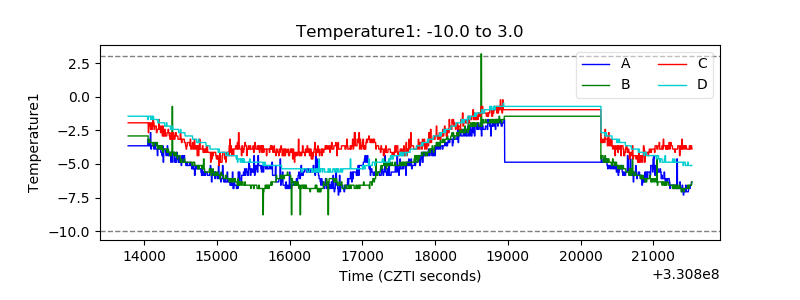 |
| Veto HV Monitor | 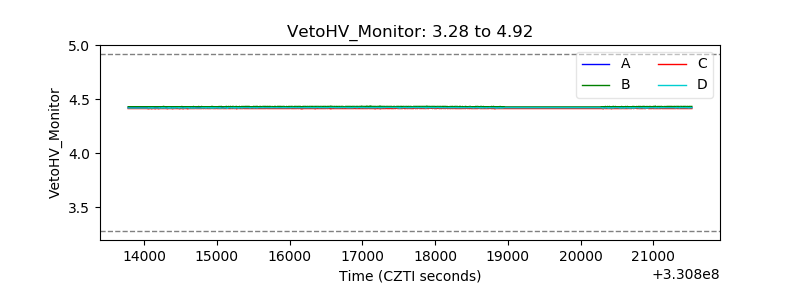 |
| Veto LLD | 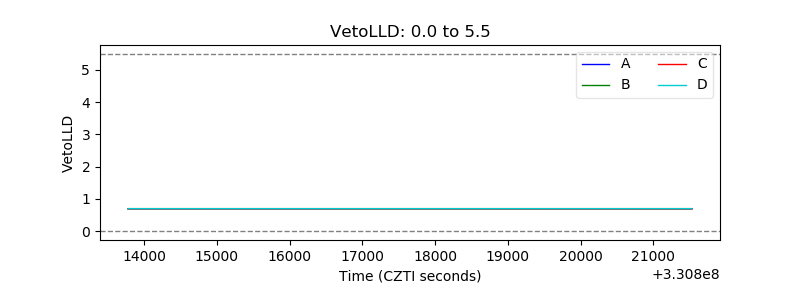 |
| Alpha Counter | 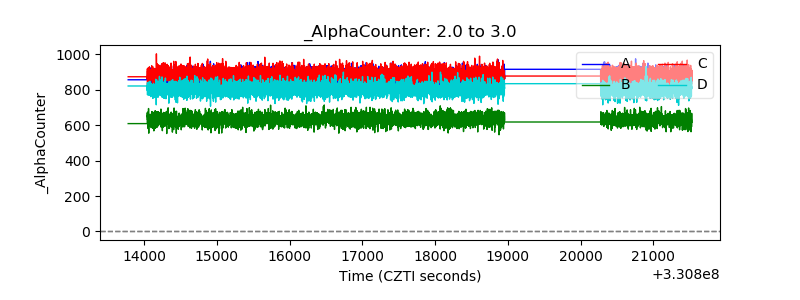 |
| _CPM_Rate | 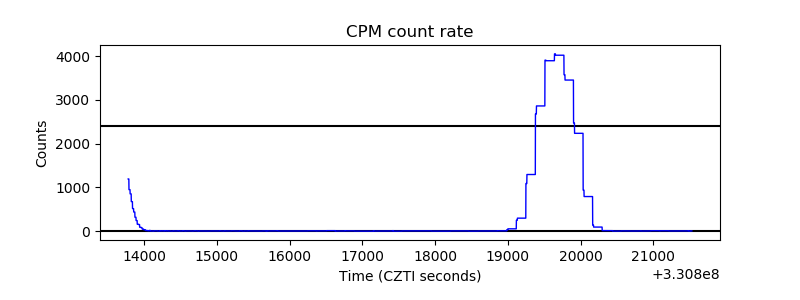 |
| CZT Counter | 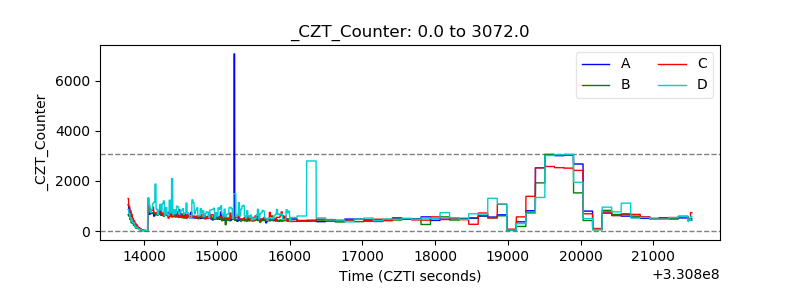 |
| +2.5 Volts monitor |  |
| +5 Volts monitor |  |
| _ROLL_ROT | 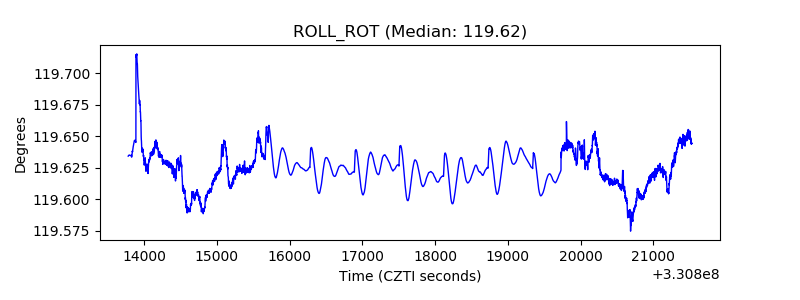 |
| _Roll_DEC | 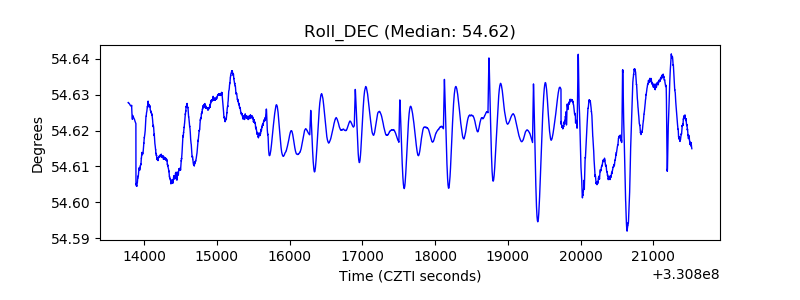 |
| _Roll_RA | 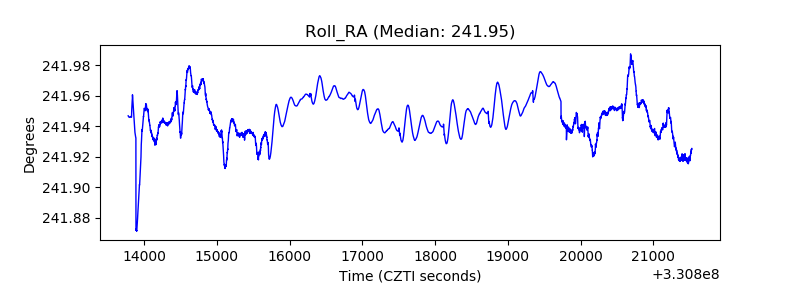 |
| Veto Counter | 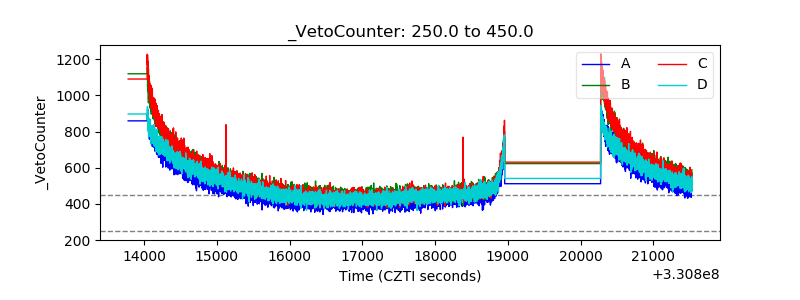 |