| Param | Original file | Final file |
|---|---|---|
| Filename | modeM0/AS1A09_013T02_9000003734_25650cztM0_level2.evt | modeM0/AS1A09_013T02_9000003734_25650cztM0_level2_quad_clean.evt |
| Size (bytes) | 440,317,440 | 105,638,400 |
| Size | 419.9 MB | 100.7 MB |
| Events in quadrant A | 3,196,007 | 699,621 |
| Events in quadrant B | 3,148,677 | 725,115 |
| Events in quadrant C | 3,141,319 | 680,793 |
| Events in quadrant D | 3,425,644 | 658,942 |
| Mode M9 | |||
|---|---|---|---|
| Quadrant | BADHDUFLAG | Total packets | Discarded packets |
| A | 0 | 15 | 0 |
| B | 0 | 16 | 0 |
| C | 0 | 16 | 0 |
| D | 0 | 16 | 0 |
| Mode M0 | |||
|---|---|---|---|
| Quadrant | BADHDUFLAG | Total packets | Discarded packets |
| A | 0 | 13142 | 0 |
| B | 0 | 13108 | 0 |
| C | 0 | 13136 | 0 |
| D | 0 | 14292 | 0 |
| Quadrant | Total seconds | Saturated seconds | Saturation percentage |
|---|---|---|---|
| A | 6227 | 18 | 0.289064% |
| B | 6227 | 34 | 0.546009% |
| C | 6227 | 67 | 1.075960% |
| D | 6226 | 21 | 0.337295% |
Noise dominated data is calculated using 1-second bins in cleaned event files. If a bin has >2000 counts, and if more than 50% of those come from <1% of pixels, then it is considered to be noise-dominated and hence unusable.
| Quadrant | # 1 sec bins | Bins with >0 counts | Bins with >2000 counts | High rate bins dominated by noise | Noise dominated (total time) | Noise dominated (detector-on time) | Marked lightcurve |
|---|---|---|---|---|---|---|---|
| A | 7592 | 6228 | 0 | 0 | 0.00% | 0.00% | 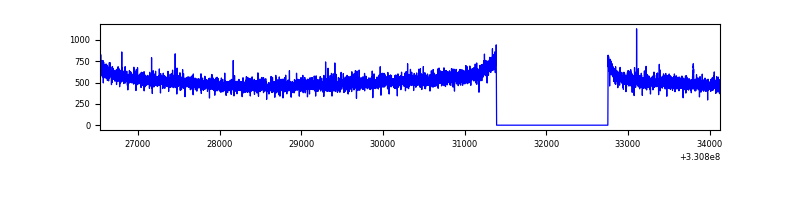 |
| B | 7592 | 6228 | 1 | 1 | 0.01% | 0.02% | 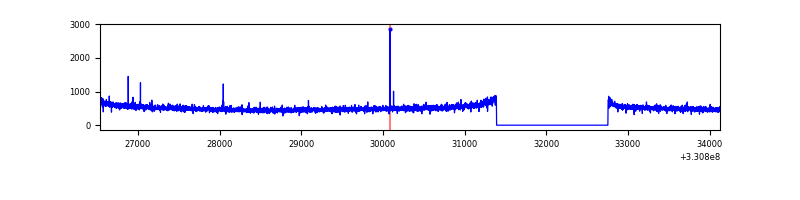 |
| C | 7592 | 6228 | 0 | 0 | 0.00% | 0.00% | 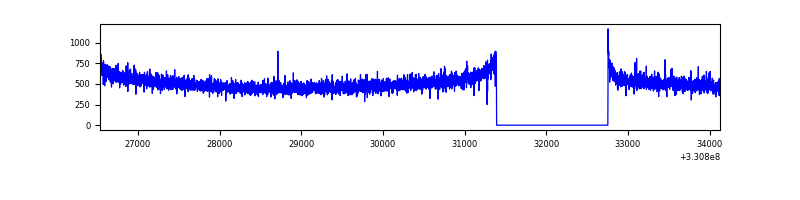 |
| D | 7591 | 6227 | 2 | 2 | 0.03% | 0.03% | 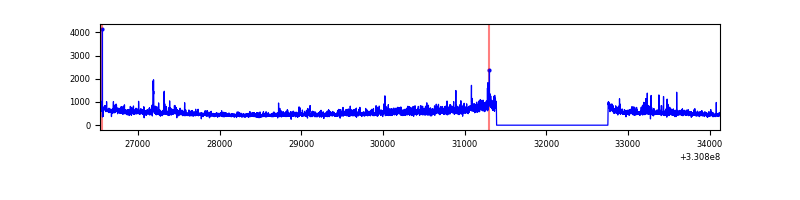 |
Top three noisy pixels from each quadrant. If the there are fewer than three noisy pixels in the level2.evt file, extra rows are filled as -1
| Pixel properties | Quadrant properties | ||||||
|---|---|---|---|---|---|---|---|
| Quadrant | DetID | PixID | Counts | Sigma | Mean | Median | Sigma |
| A | 8 | 192 | 136850 | 862.64 | 793 | 779 | 157.7 |
| A | 13 | 254 | 9047 | 52.42 | 793 | 779 | 157.7 |
| A | 3 | 137 | 6855 | 38.52 | 793 | 779 | 157.7 |
| B | 12 | 111 | 17590 | 114.67 | 798 | 780 | 146.6 |
| B | 11 | 111 | 15545 | 100.72 | 798 | 780 | 146.6 |
| B | 14 | 111 | 14350 | 92.57 | 798 | 780 | 146.6 |
| C | 14 | 238 | 125413 | 705.73 | 764 | 772 | 176.6 |
| C | 3 | 233 | 30385 | 167.67 | 764 | 772 | 176.6 |
| C | 2 | 16 | 5876 | 28.9 | 764 | 772 | 176.6 |
| D | 8 | 195 | 415879 | 2147.62 | 754 | 734 | 193.3 |
| D | 1 | 52 | 114953 | 590.88 | 754 | 734 | 193.3 |
| D | 2 | 234 | 24968 | 125.37 | 754 | 734 | 193.3 |
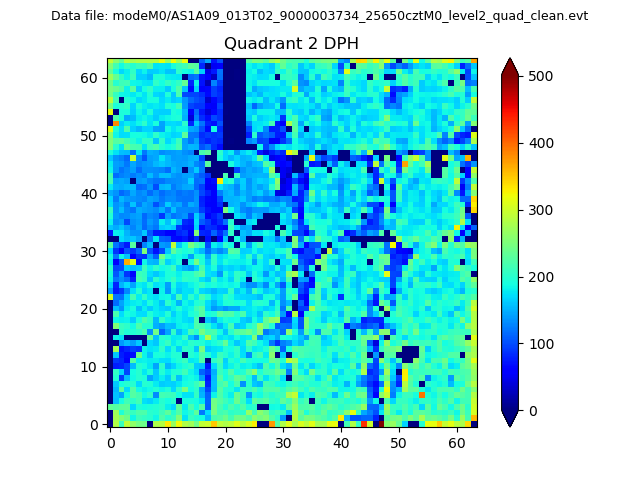
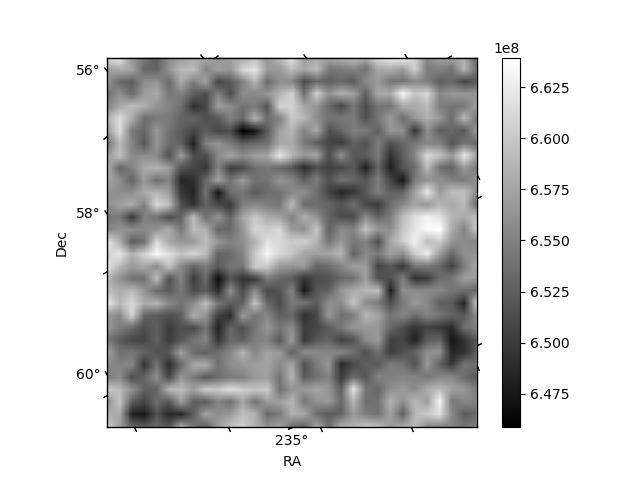
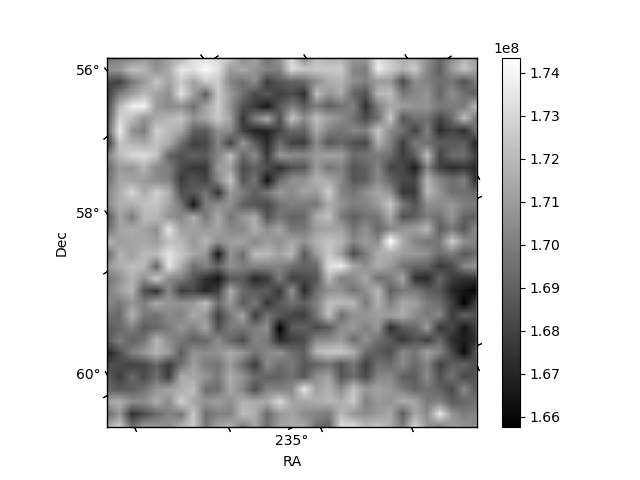
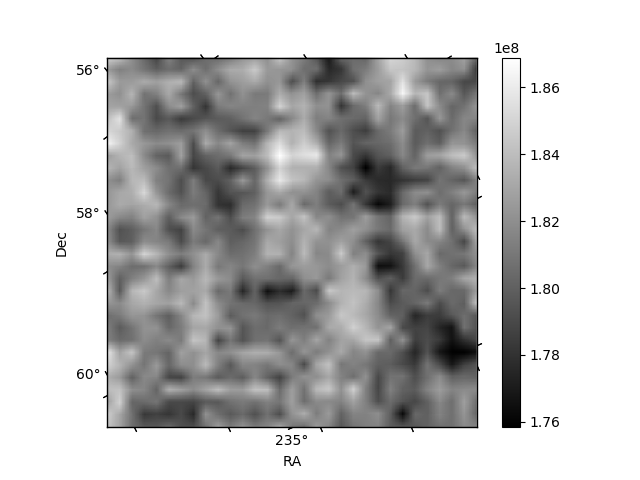
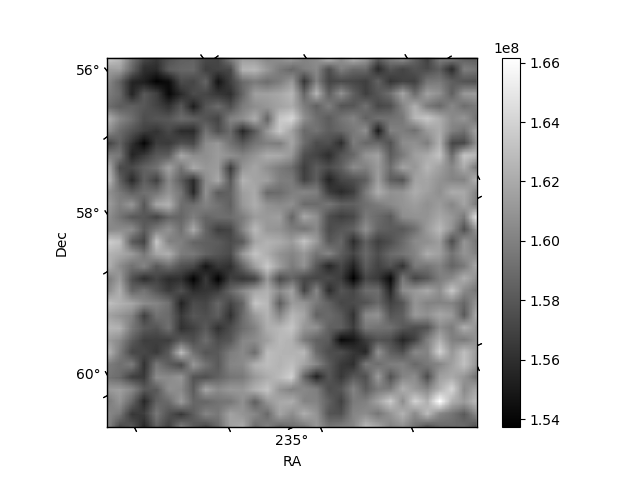
Histogram calculated using DETX and DETY for each event in the final _common_clean file
| Quadrant A | 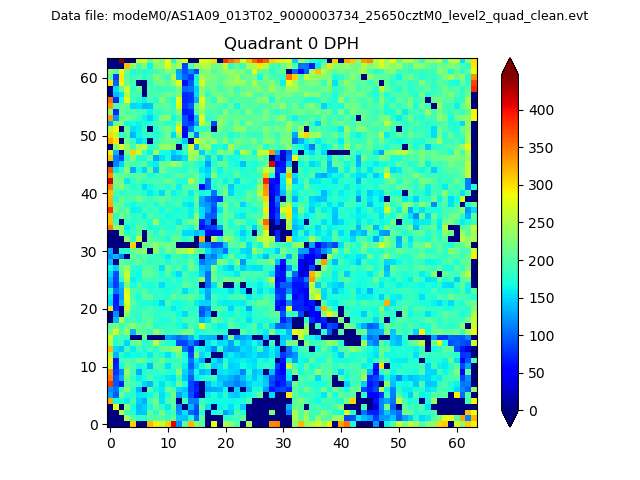 |
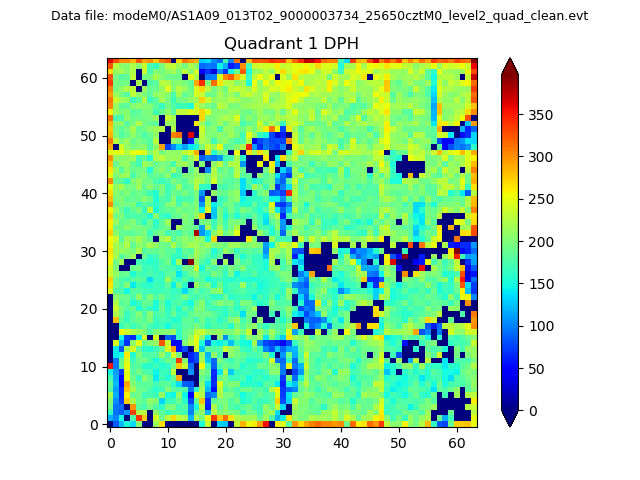 |
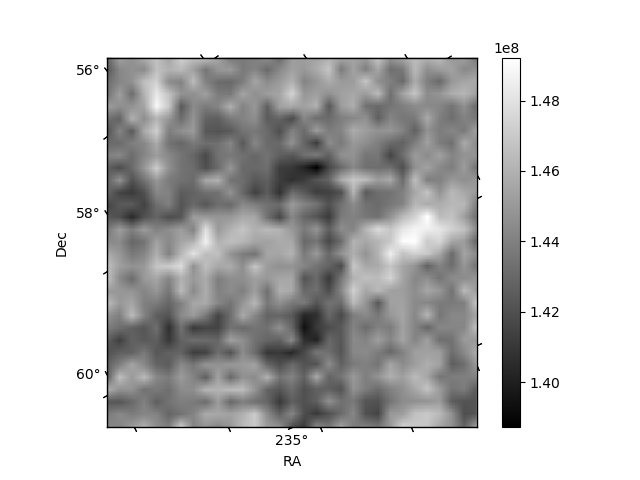
Quadrant B |
|---|---|---|---|
| Quadrant D | 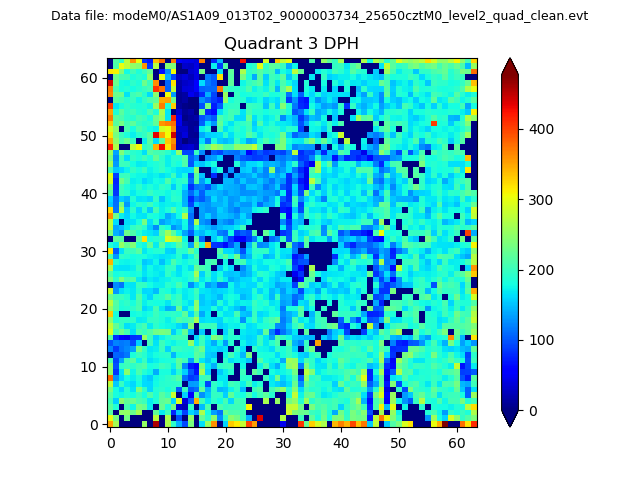 |
 |
Quadrant C |
| Plot type | Count rate plots | Images |
|---|---|---|
| Comparison with Poisson distribution Blue bars denote a histogram of data divided into 1 sec bins. Red curve is a Poisson curve with rate = median count rate of data. |
 |
 |
| Quadrant-wise count rates Data is divided into 100 sec bins |
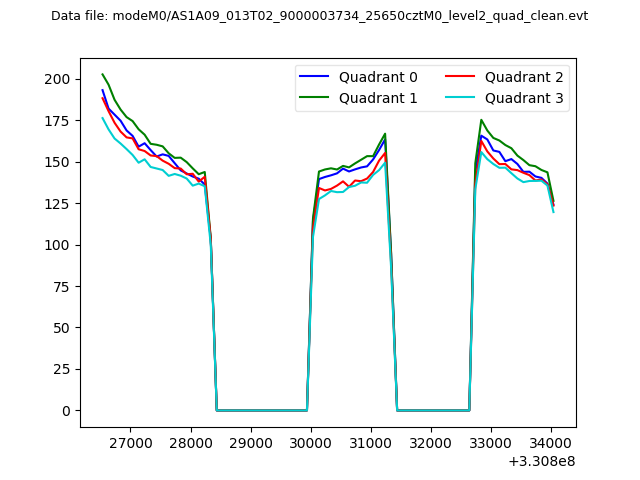 |
|
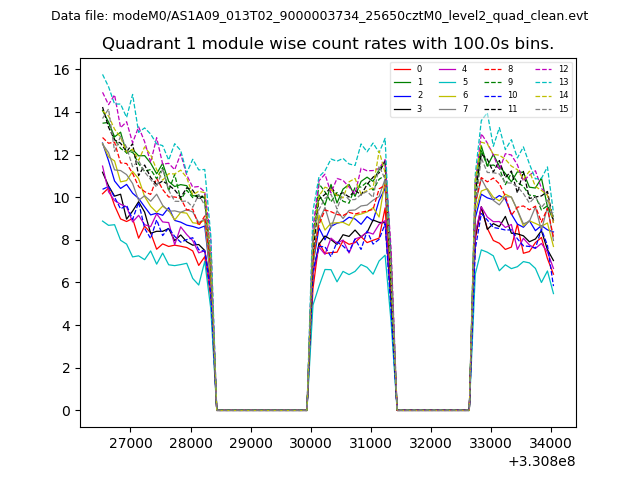
| Module-wise count rates for Quadrant A Data is divided into 100 sec bins |
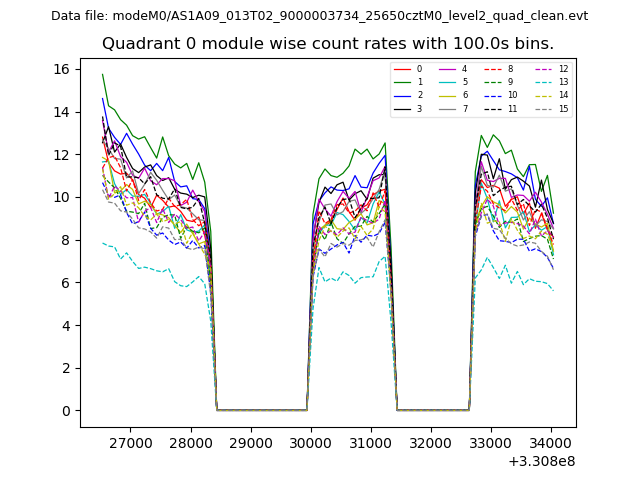 |
 |
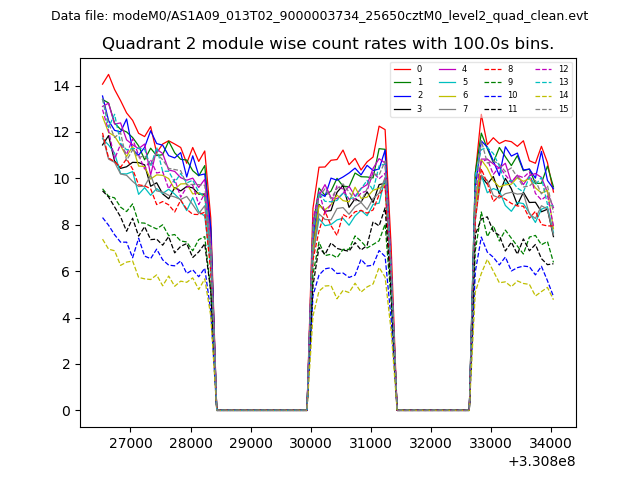
| Module-wise count rates for Quadrant B Data is divided into 100 sec bins |
 |
 |
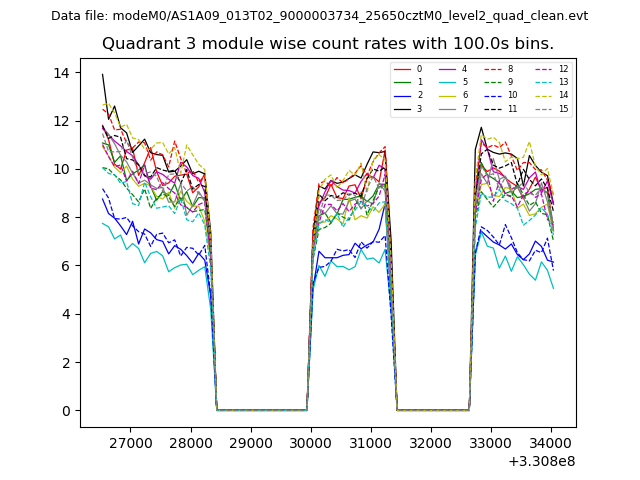
| Module-wise count rates for Quadrant C Data is divided into 100 sec bins |
 |
 |
| Module-wise count rates for Quadrant D Data is divided into 100 sec bins |
 |
 |
| Parameter | Plot |
|---|---|
| CZT HV Monitor | 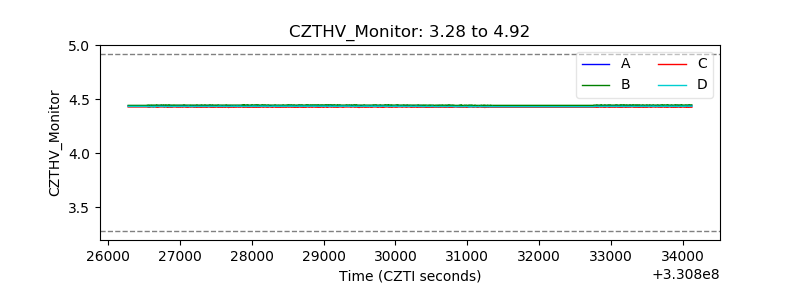 |
| D_VDD | 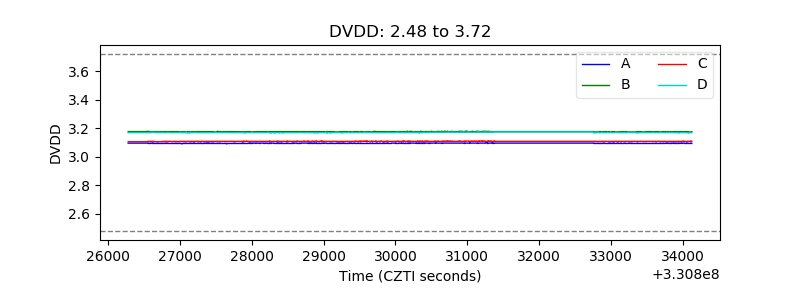 |
| Temperature 1 | 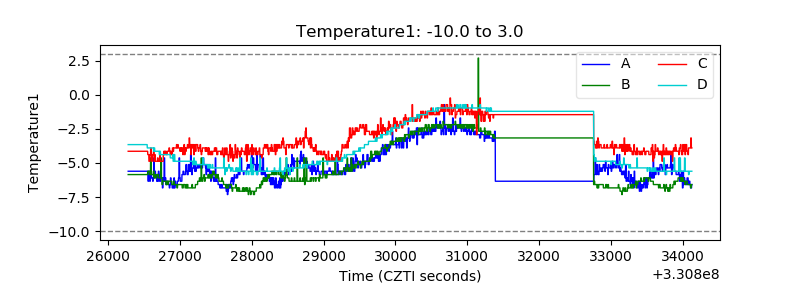 |
| Veto HV Monitor | 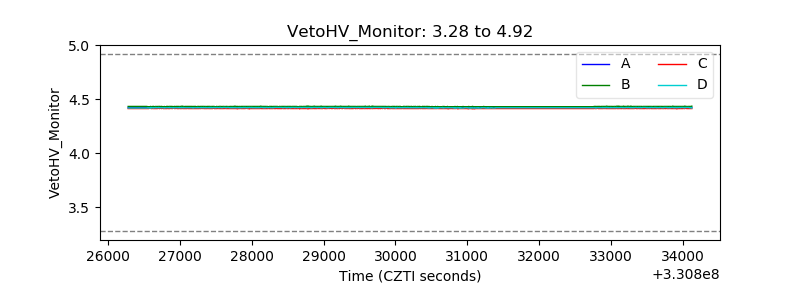 |
| Veto LLD | 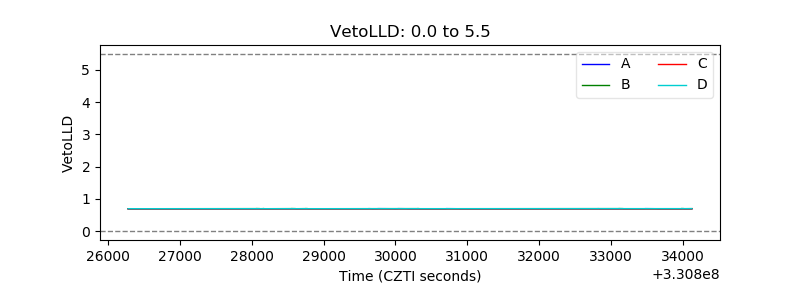 |
| Alpha Counter | 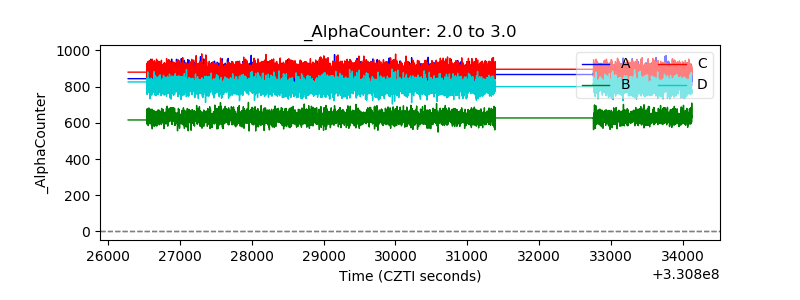 |
| _CPM_Rate | 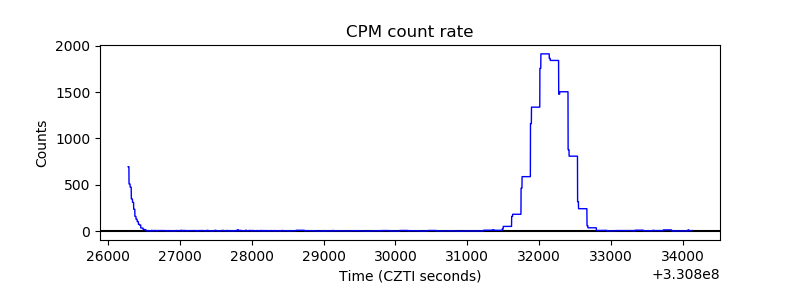 |
| CZT Counter | 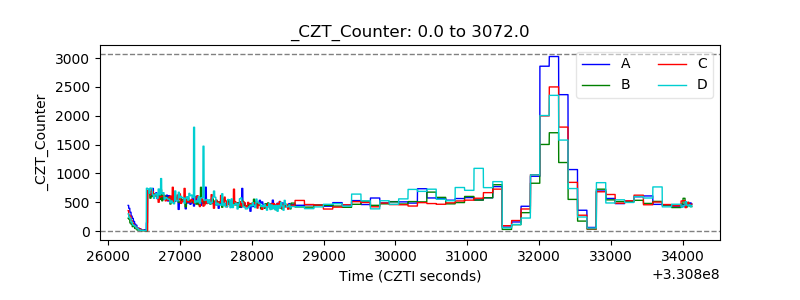 |
| +2.5 Volts monitor |  |
| +5 Volts monitor | 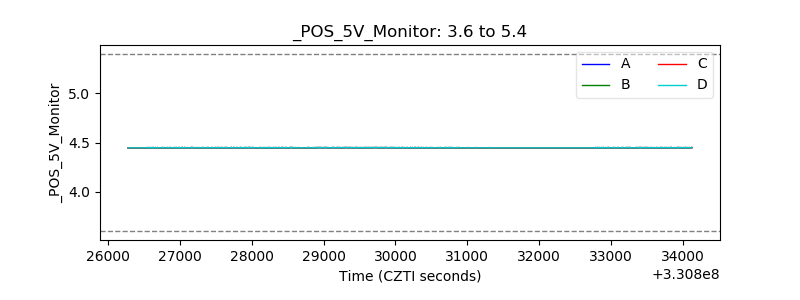 |
| _ROLL_ROT | 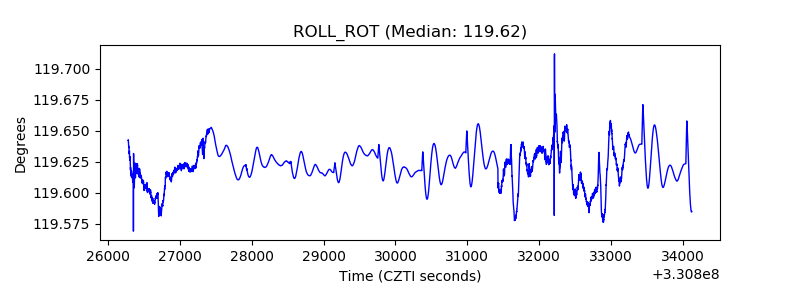 |
| _Roll_DEC | 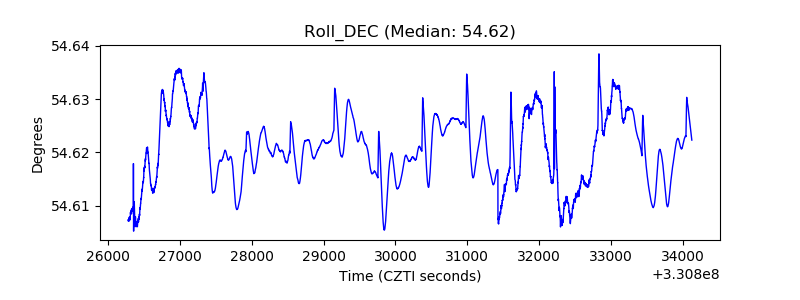 |
| _Roll_RA | 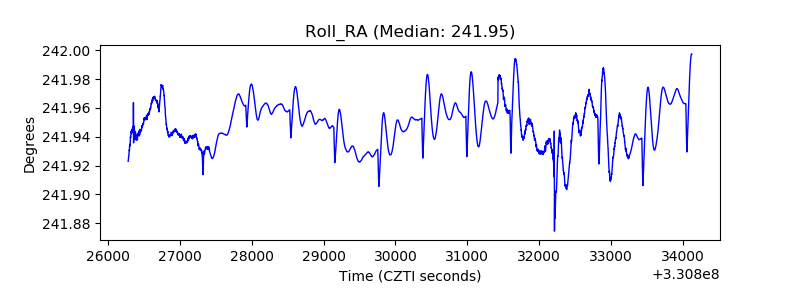 |
| Veto Counter | 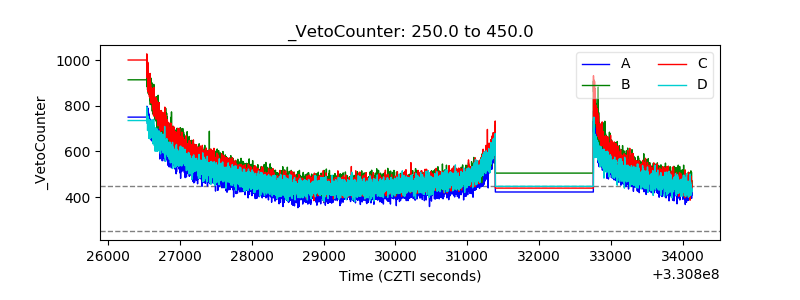 |