| Param | Original file | Final file |
|---|---|---|
| Filename | modeM0/AS1A09_013T02_9000003734_25651cztM0_level2.evt | modeM0/AS1A09_013T02_9000003734_25651cztM0_level2_quad_clean.evt |
| Size (bytes) | 461,131,200 | 100,215,360 |
| Size | 439.8 MB | 95.6 MB |
| Events in quadrant A | 3,335,291 | 651,554 |
| Events in quadrant B | 3,286,299 | 669,312 |
| Events in quadrant C | 3,339,857 | 629,991 |
| Events in quadrant D | 3,548,683 | 616,971 |
| Mode M9 | |||
|---|---|---|---|
| Quadrant | BADHDUFLAG | Total packets | Discarded packets |
| A | 0 | 18 | 0 |
| B | 0 | 19 | 0 |
| C | 0 | 19 | 0 |
| D | 0 | 19 | 0 |
| Mode M0 | |||
|---|---|---|---|
| Quadrant | BADHDUFLAG | Total packets | Discarded packets |
| A | 0 | 13880 | 0 |
| B | 0 | 13829 | 0 |
| C | 0 | 14075 | 0 |
| D | 0 | 14940 | 0 |
| Quadrant | Total seconds | Saturated seconds | Saturation percentage |
|---|---|---|---|
| A | 6703 | 21 | 0.313293% |
| B | 6703 | 33 | 0.492317% |
| C | 6703 | 71 | 1.059227% |
| D | 6703 | 18 | 0.268536% |
Noise dominated data is calculated using 1-second bins in cleaned event files. If a bin has >2000 counts, and if more than 50% of those come from <1% of pixels, then it is considered to be noise-dominated and hence unusable.
| Quadrant | # 1 sec bins | Bins with >0 counts | Bins with >2000 counts | High rate bins dominated by noise | Noise dominated (total time) | Noise dominated (detector-on time) | Marked lightcurve |
|---|---|---|---|---|---|---|---|
| A | 7883 | 6704 | 0 | 0 | 0.00% | 0.00% | 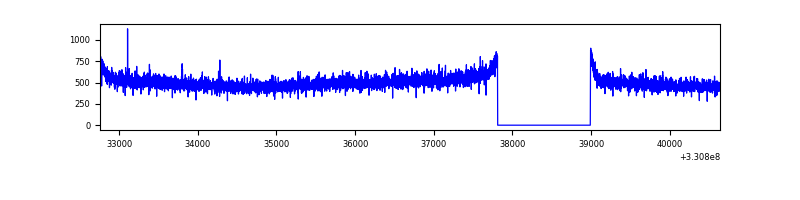 |
| B | 7883 | 6704 | 0 | 0 | 0.00% | 0.00% | 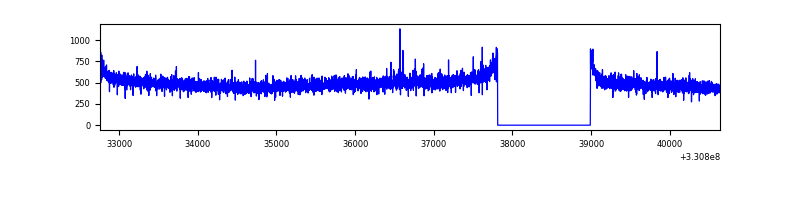 |
| C | 7883 | 6704 | 0 | 0 | 0.00% | 0.00% | 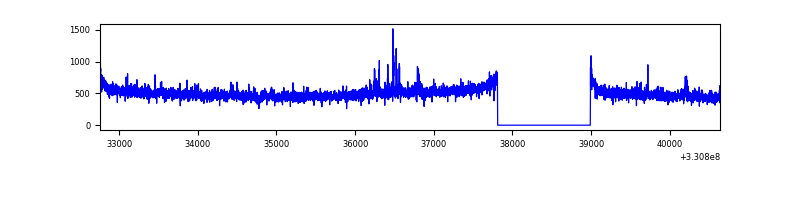 |
| D | 7883 | 6704 | 3 | 3 | 0.04% | 0.04% | 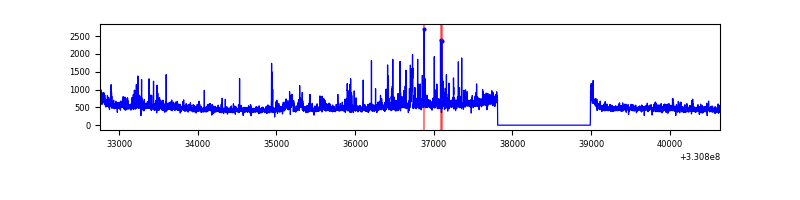 |
Top three noisy pixels from each quadrant. If the there are fewer than three noisy pixels in the level2.evt file, extra rows are filled as -1
| Pixel properties | Quadrant properties | ||||||
|---|---|---|---|---|---|---|---|
| Quadrant | DetID | PixID | Counts | Sigma | Mean | Median | Sigma |
| A | 8 | 192 | 144288 | 872.12 | 827 | 810 | 164.5 |
| A | 13 | 254 | 9657 | 53.77 | 827 | 810 | 164.5 |
| A | 3 | 137 | 7414 | 40.14 | 827 | 810 | 164.5 |
| B | 12 | 111 | 18794 | 116.53 | 830 | 810 | 154.3 |
| B | 11 | 111 | 16672 | 102.78 | 830 | 810 | 154.3 |
| B | 0 | 219 | 15992 | 98.37 | 830 | 810 | 154.3 |
| C | 14 | 238 | 131169 | 712.68 | 793 | 799 | 182.9 |
| C | 3 | 233 | 115379 | 626.36 | 793 | 799 | 182.9 |
| C | 13 | 61 | 5529 | 25.86 | 793 | 799 | 182.9 |
| D | 8 | 195 | 288626 | 1413.24 | 788 | 770 | 203.7 |
| D | 1 | 52 | 254117 | 1243.82 | 788 | 770 | 203.7 |
| D | 2 | 234 | 25981 | 123.77 | 788 | 770 | 203.7 |
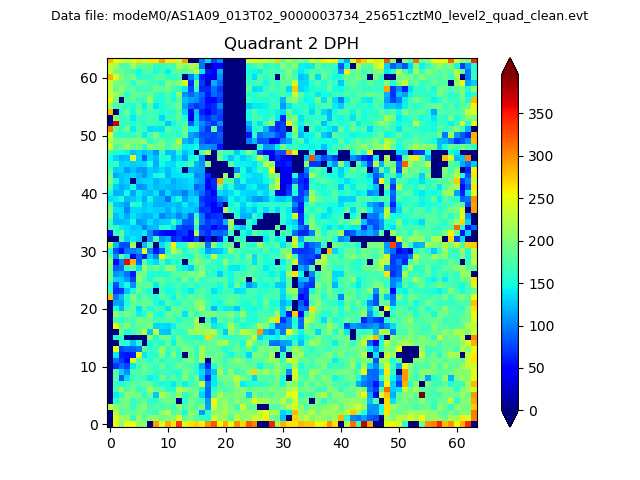
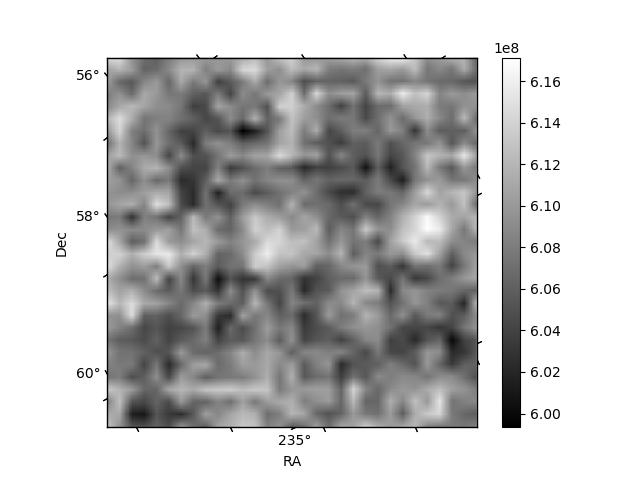
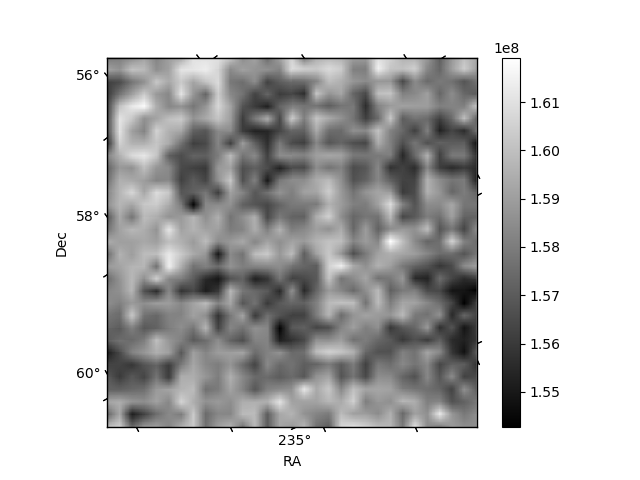
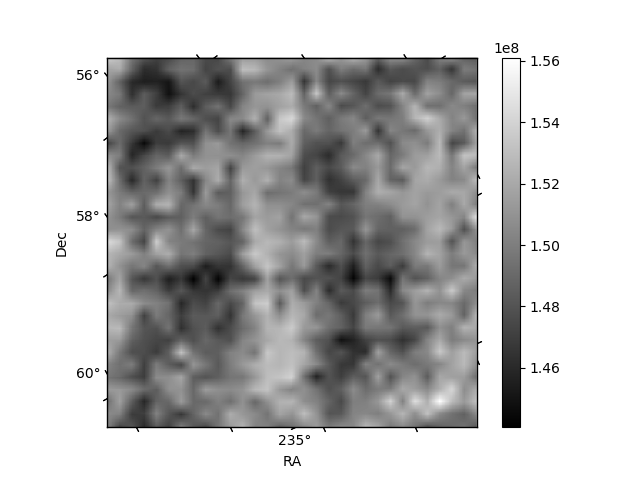
Histogram calculated using DETX and DETY for each event in the final _common_clean file
| Quadrant A | 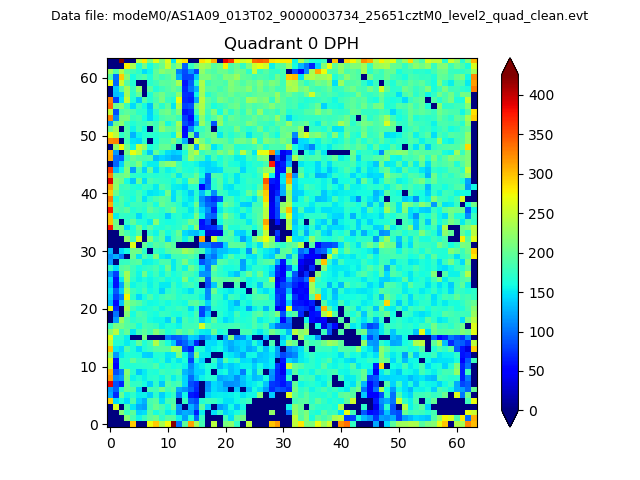 |
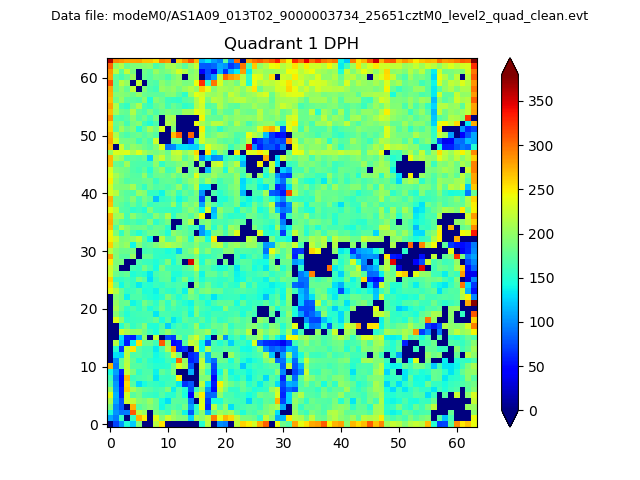 |
Quadrant B |
|---|---|---|---|
| Quadrant D | 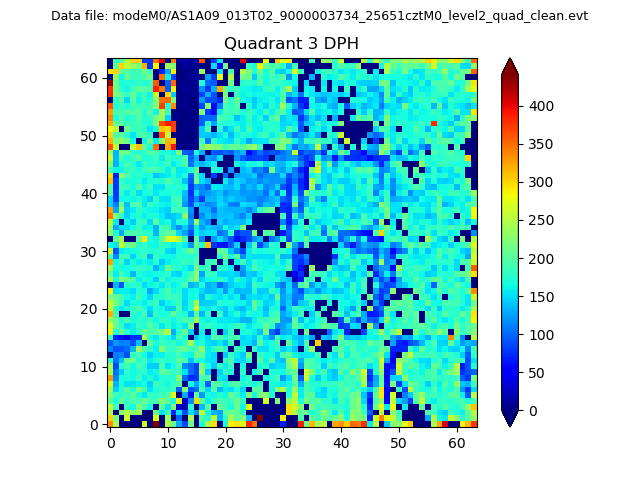 |
 |
Quadrant C |
| Plot type | Count rate plots | Images |
|---|---|---|
| Comparison with Poisson distribution Blue bars denote a histogram of data divided into 1 sec bins. Red curve is a Poisson curve with rate = median count rate of data. |
 |
 |
| Quadrant-wise count rates Data is divided into 100 sec bins |
 |
|
| Module-wise count rates for Quadrant A Data is divided into 100 sec bins |
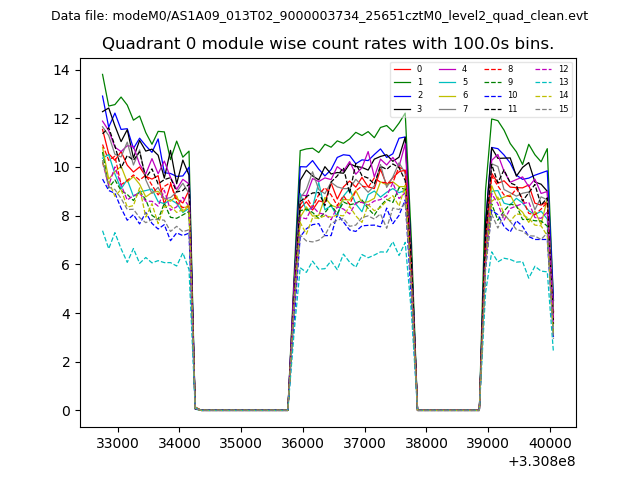 |
 |
| Module-wise count rates for Quadrant B Data is divided into 100 sec bins |
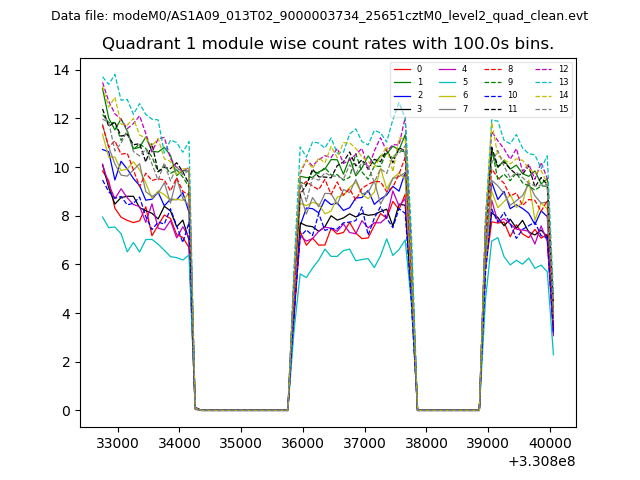 |
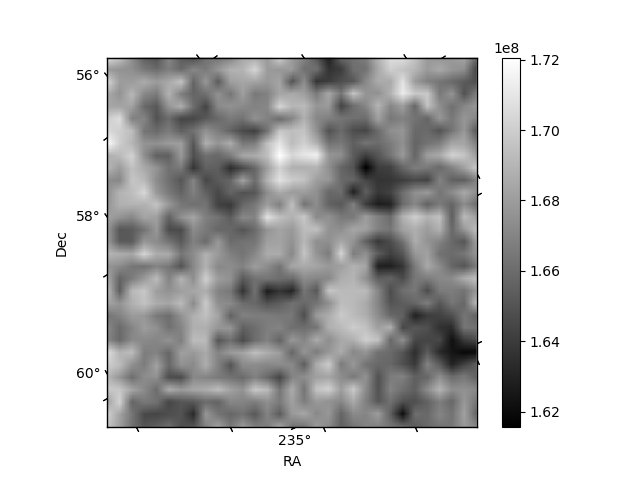 |
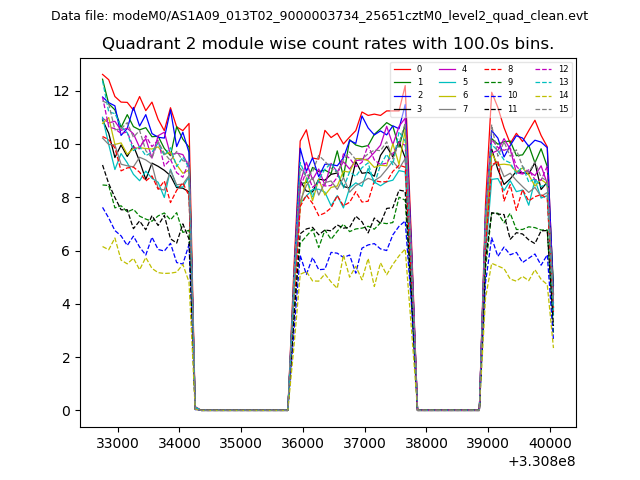
| Module-wise count rates for Quadrant C Data is divided into 100 sec bins |
 |
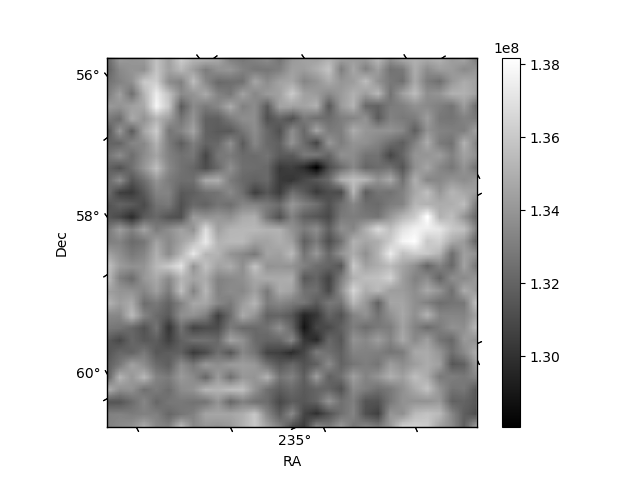 |
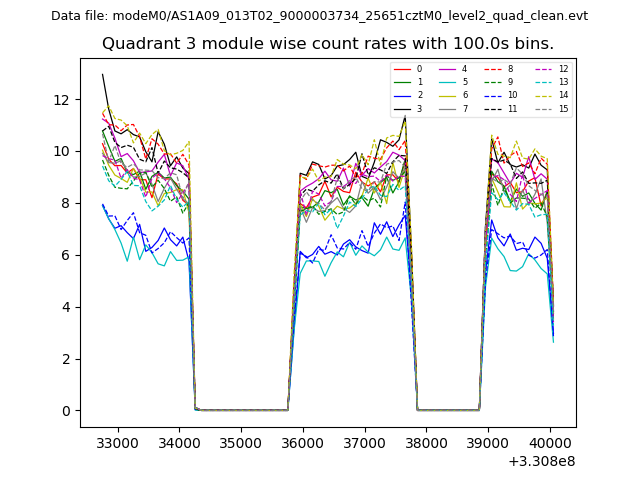
| Module-wise count rates for Quadrant D Data is divided into 100 sec bins |
 |
 |
| Parameter | Plot |
|---|---|
| CZT HV Monitor | 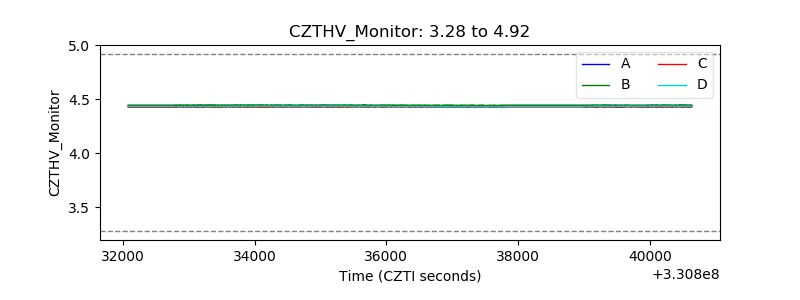 |
| D_VDD | 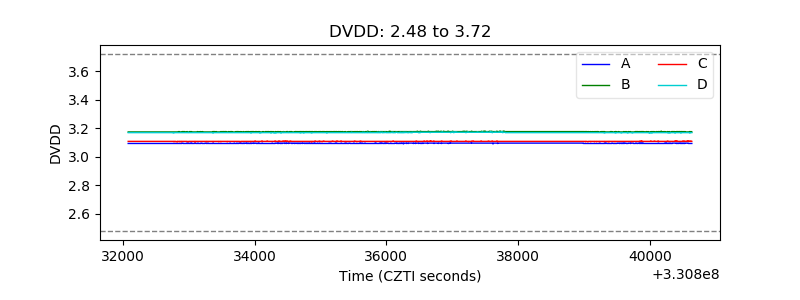 |
| Temperature 1 | 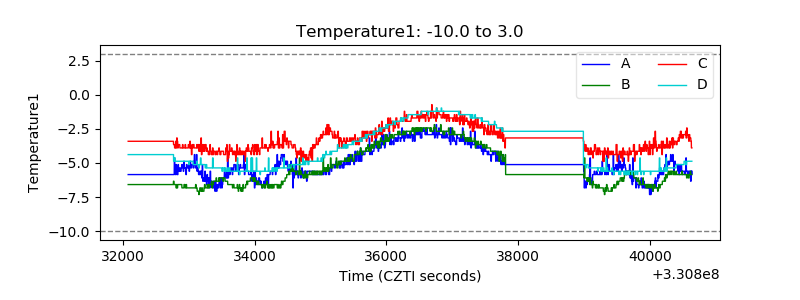 |
| Veto HV Monitor | 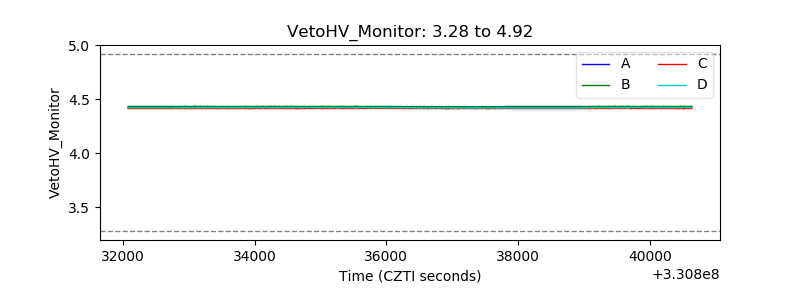 |
| Veto LLD | 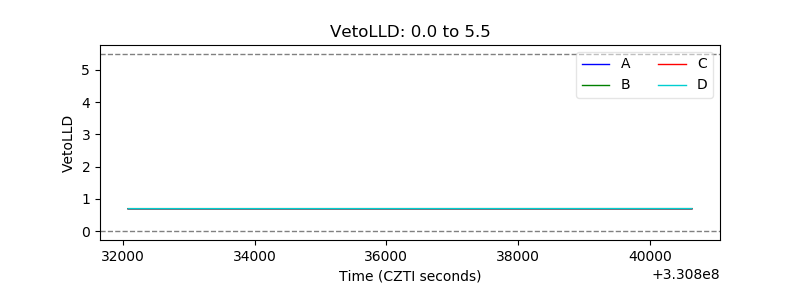 |
| Alpha Counter |  |
| _CPM_Rate | 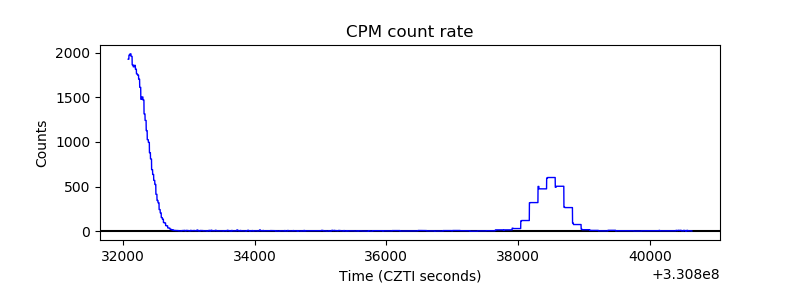 |
| CZT Counter | 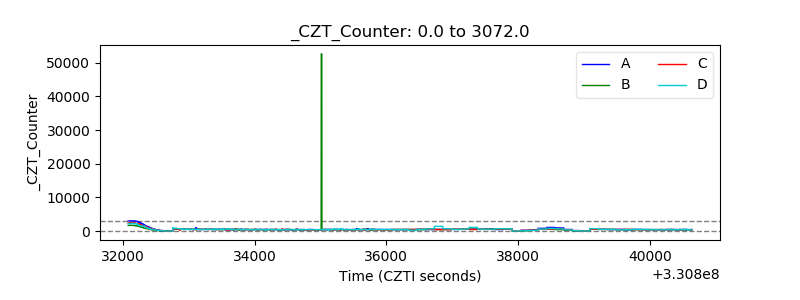 |
| +2.5 Volts monitor |  |
| +5 Volts monitor |  |
| _ROLL_ROT | 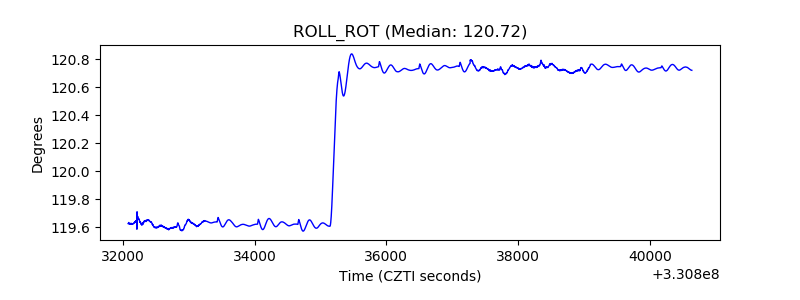 |
| _Roll_DEC |  |
| _Roll_RA | 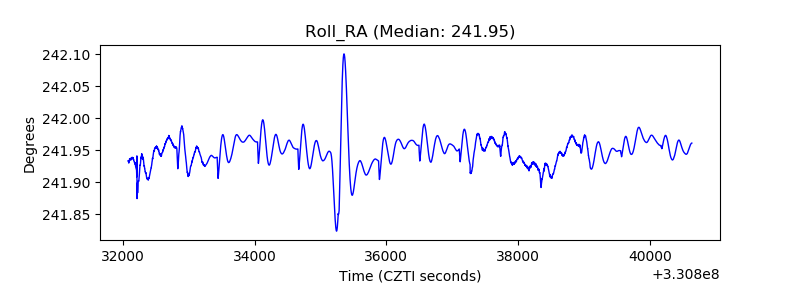 |
| Veto Counter | 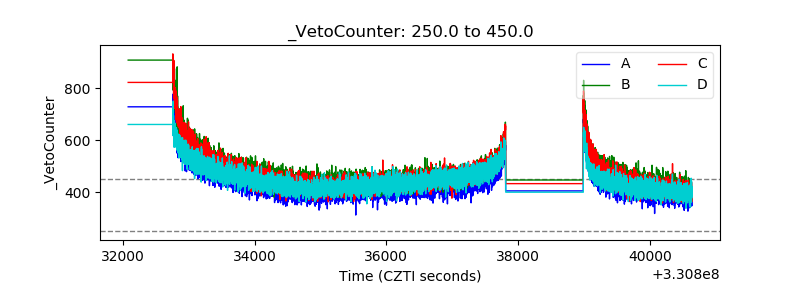 |