| Param | Original file | Final file |
|---|---|---|
| Filename | modeM0/AS1A09_013T02_9000003734_25652cztM0_level2.evt | modeM0/AS1A09_013T02_9000003734_25652cztM0_level2_quad_clean.evt |
| Size (bytes) | 453,798,720 | 89,867,520 |
| Size | 432.8 MB | 85.7 MB |
| Events in quadrant A | 3,286,372 | 571,795 |
| Events in quadrant B | 3,208,011 | 582,816 |
| Events in quadrant C | 3,212,204 | 552,894 |
| Events in quadrant D | 3,579,515 | 545,253 |
| Mode M9 | |||
|---|---|---|---|
| Quadrant | BADHDUFLAG | Total packets | Discarded packets |
| A | 0 | 8 | 0 |
| B | 0 | 8 | 0 |
| C | 0 | 8 | 0 |
| D | 0 | 8 | 0 |
| Mode M0 | |||
|---|---|---|---|
| Quadrant | BADHDUFLAG | Total packets | Discarded packets |
| A | 0 | 13794 | 0 |
| B | 0 | 13817 | 0 |
| C | 0 | 13799 | 0 |
| D | 0 | 14937 | 0 |
| Quadrant | Total seconds | Saturated seconds | Saturation percentage |
|---|---|---|---|
| A | 6725 | 99 | 1.472119% |
| B | 6726 | 116 | 1.724651% |
| C | 6725 | 123 | 1.828996% |
| D | 6725 | 97 | 1.442379% |
Noise dominated data is calculated using 1-second bins in cleaned event files. If a bin has >2000 counts, and if more than 50% of those come from <1% of pixels, then it is considered to be noise-dominated and hence unusable.
| Quadrant | # 1 sec bins | Bins with >0 counts | Bins with >2000 counts | High rate bins dominated by noise | Noise dominated (total time) | Noise dominated (detector-on time) | Marked lightcurve |
|---|---|---|---|---|---|---|---|
| A | 7475 | 6725 | 0 | 0 | 0.00% | 0.00% | 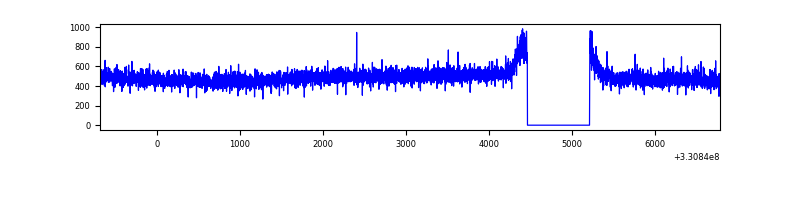 |
| B | 7476 | 6726 | 0 | 0 | 0.00% | 0.00% | 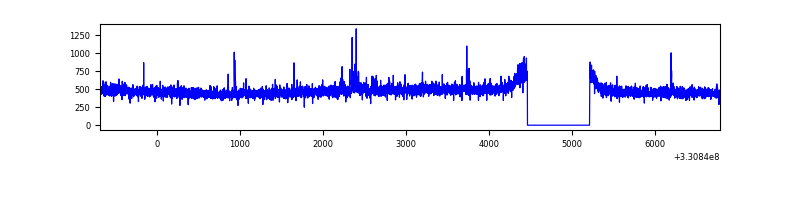 |
| C | 7475 | 6726 | 0 | 0 | 0.00% | 0.00% | 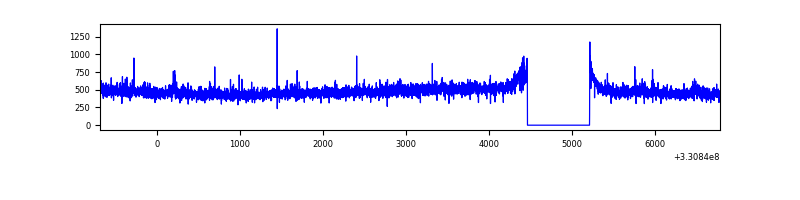 |
| D | 7475 | 6726 | 20 | 20 | 0.27% | 0.30% | 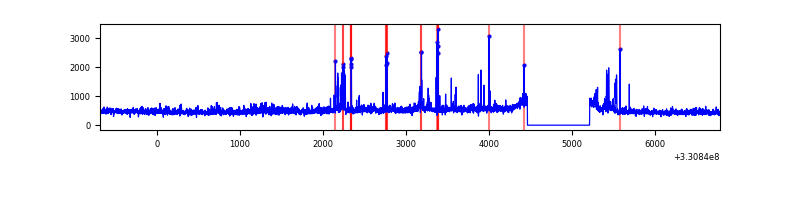 |
Top three noisy pixels from each quadrant. If the there are fewer than three noisy pixels in the level2.evt file, extra rows are filled as -1
| Pixel properties | Quadrant properties | ||||||
|---|---|---|---|---|---|---|---|
| Quadrant | DetID | PixID | Counts | Sigma | Mean | Median | Sigma |
| A | 8 | 192 | 165313 | 1013.46 | 810 | 794 | 162.3 |
| A | 13 | 254 | 10090 | 57.26 | 810 | 794 | 162.3 |
| A | 3 | 137 | 7633 | 42.13 | 810 | 794 | 162.3 |
| B | 0 | 245 | 29436 | 186.19 | 809 | 786 | 153.9 |
| B | 12 | 111 | 18979 | 118.23 | 809 | 786 | 153.9 |
| B | 11 | 111 | 16866 | 104.5 | 809 | 786 | 153.9 |
| C | 14 | 238 | 125844 | 694.4 | 776 | 780 | 180.1 |
| C | 3 | 233 | 59407 | 325.52 | 776 | 780 | 180.1 |
| C | 13 | 61 | 5468 | 26.03 | 776 | 780 | 180.1 |
| D | 8 | 195 | 301892 | 1480.61 | 777 | 757 | 203.4 |
| D | 1 | 52 | 300482 | 1473.67 | 777 | 757 | 203.4 |
| D | 2 | 234 | 24922 | 118.81 | 777 | 757 | 203.4 |
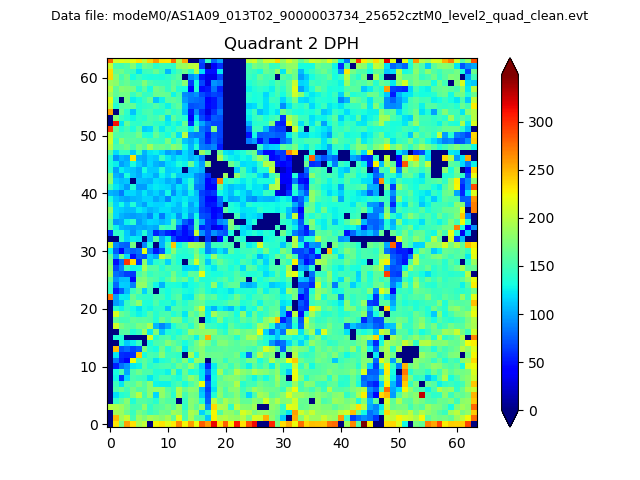
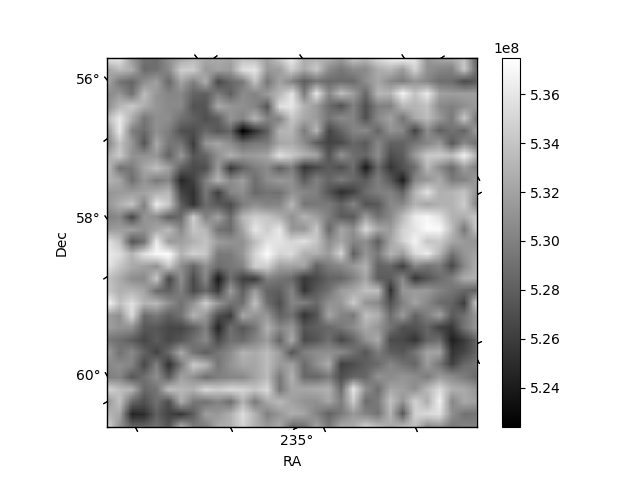
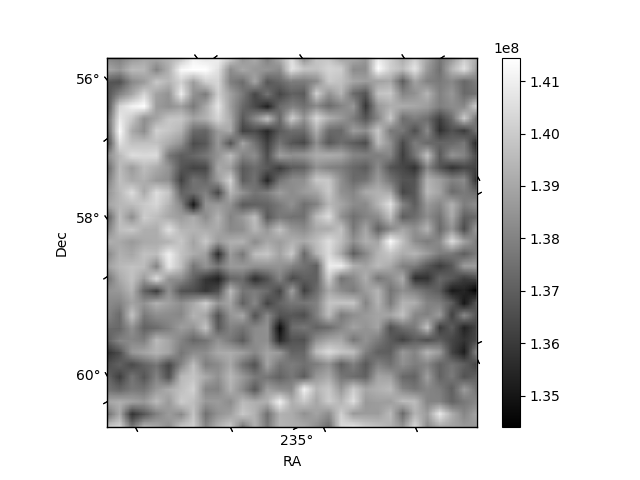
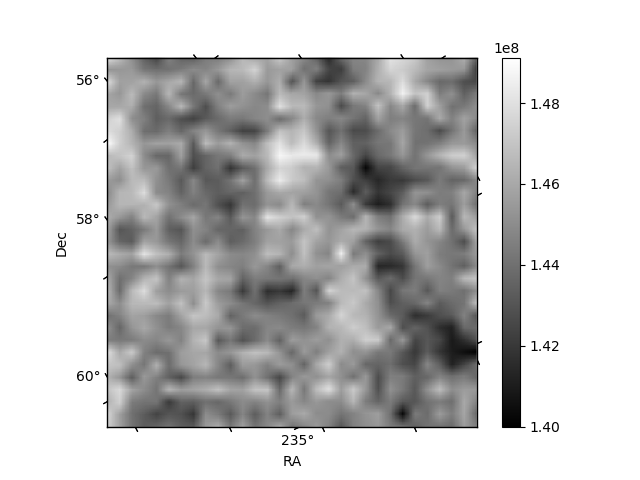
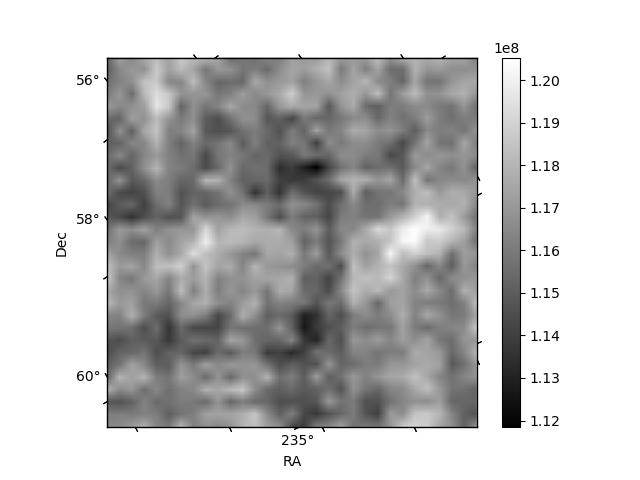
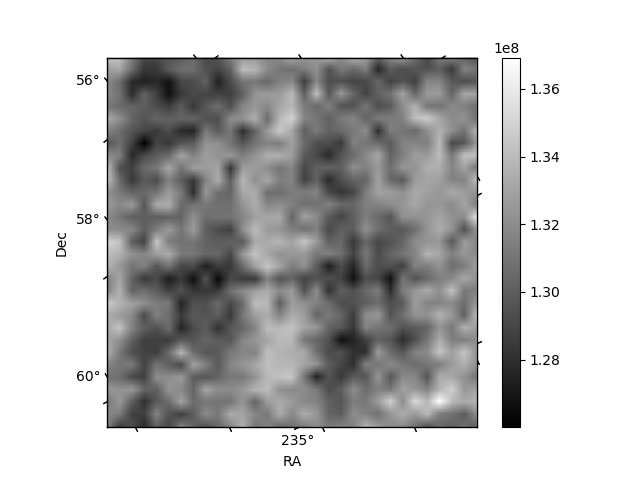
Histogram calculated using DETX and DETY for each event in the final _common_clean file
| Quadrant A | 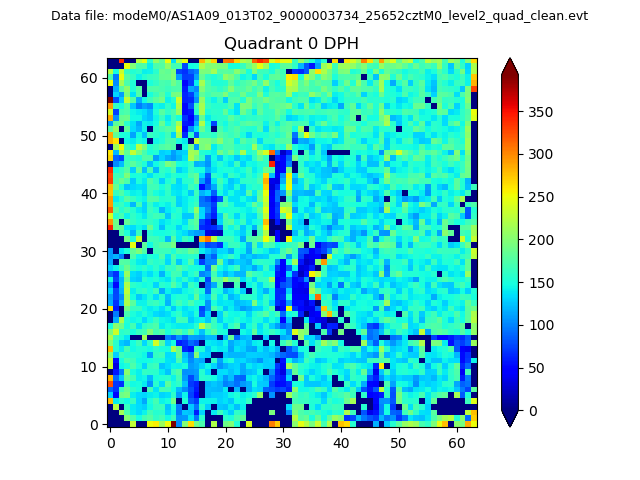 |
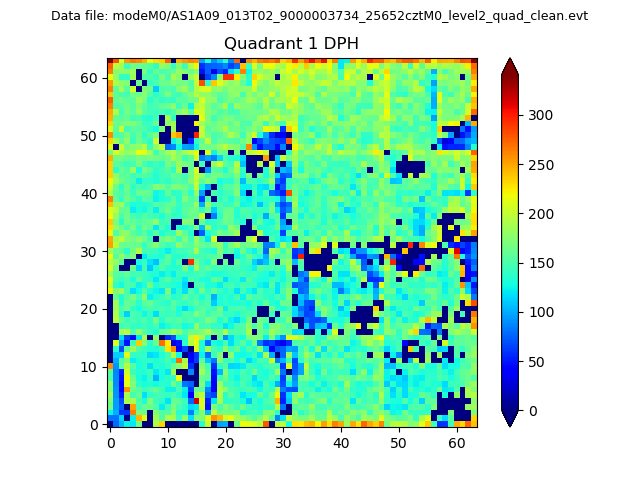 |
Quadrant B |
|---|---|---|---|
| Quadrant D | 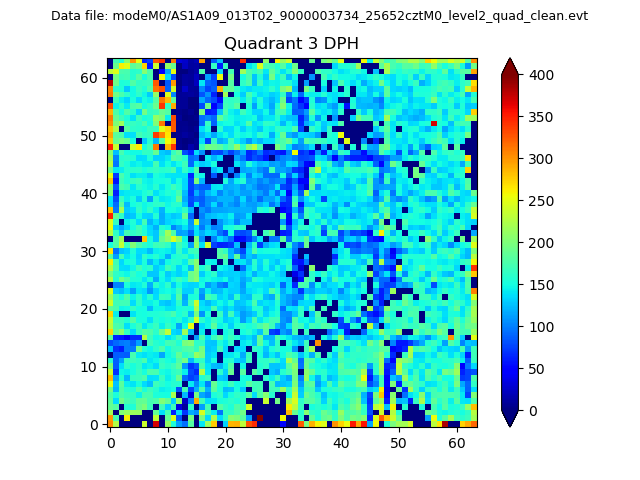 |
 |
Quadrant C |
| Plot type | Count rate plots | Images |
|---|---|---|
| Comparison with Poisson distribution Blue bars denote a histogram of data divided into 1 sec bins. Red curve is a Poisson curve with rate = median count rate of data. |
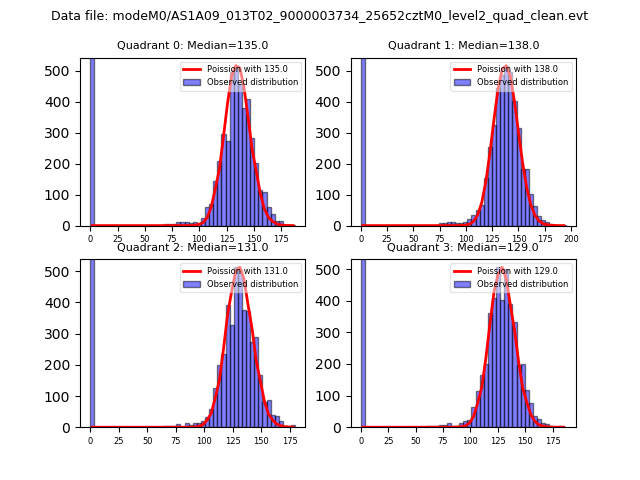 |
 |
| Quadrant-wise count rates Data is divided into 100 sec bins |
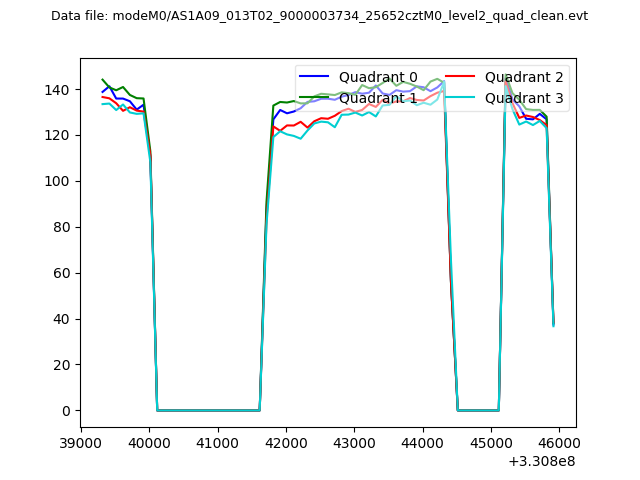 |
|
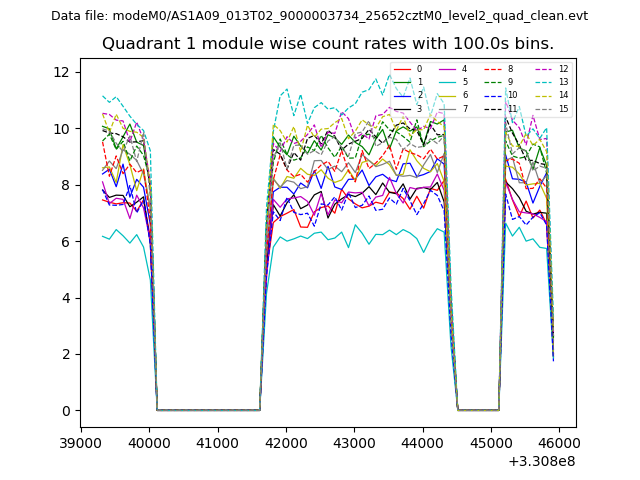
| Module-wise count rates for Quadrant A Data is divided into 100 sec bins |
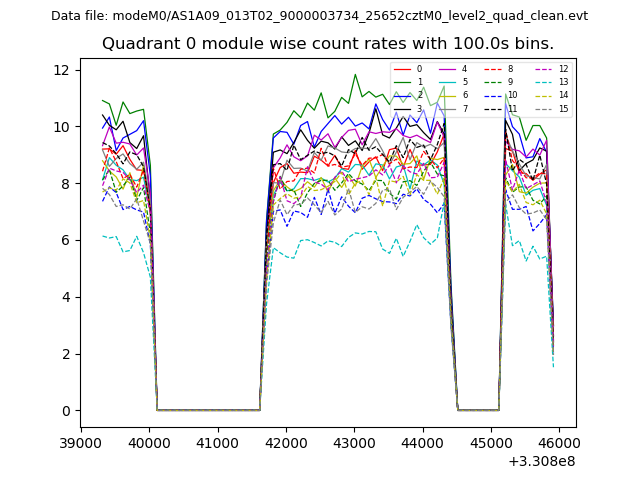 |
 |
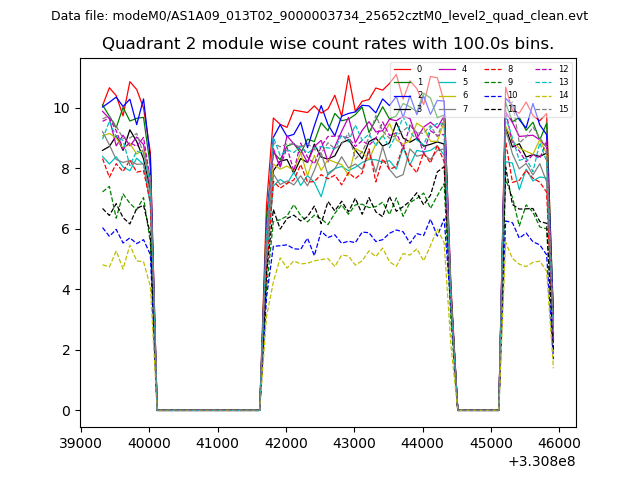
| Module-wise count rates for Quadrant B Data is divided into 100 sec bins |
 |
 |
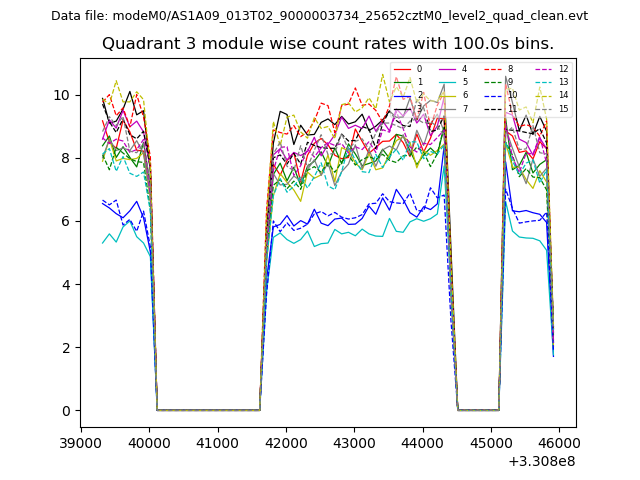
| Module-wise count rates for Quadrant C Data is divided into 100 sec bins |
 |
 |
| Module-wise count rates for Quadrant D Data is divided into 100 sec bins |
 |
 |
| Parameter | Plot |
|---|---|
| CZT HV Monitor | 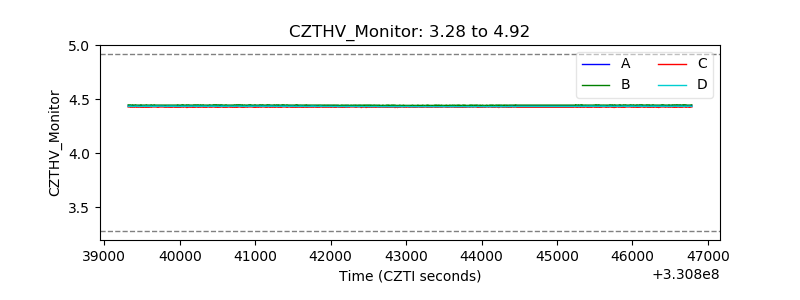 |
| D_VDD | 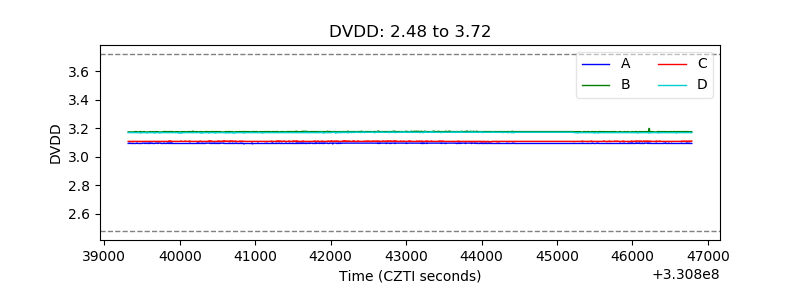 |
| Temperature 1 | 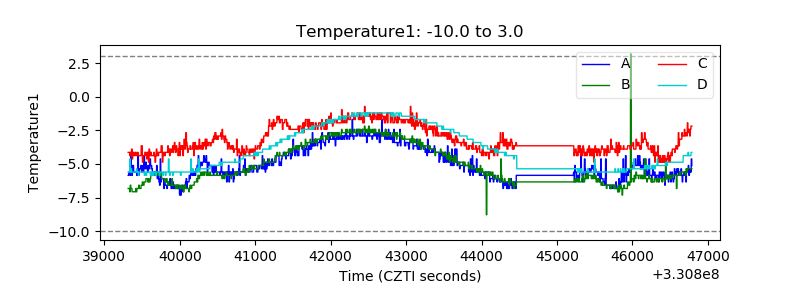 |
| Veto HV Monitor | 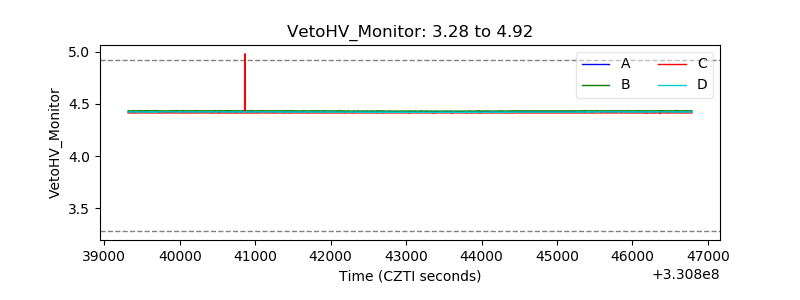 |
| Veto LLD | 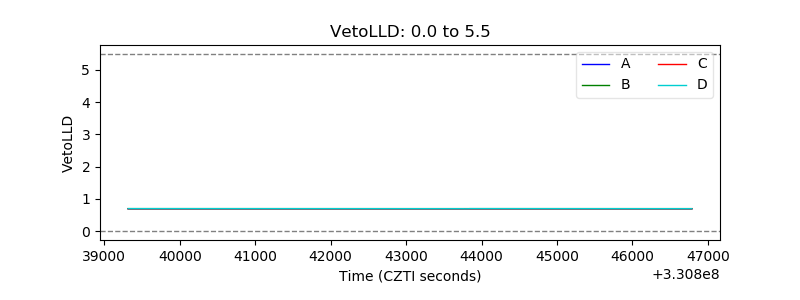 |
| Alpha Counter | 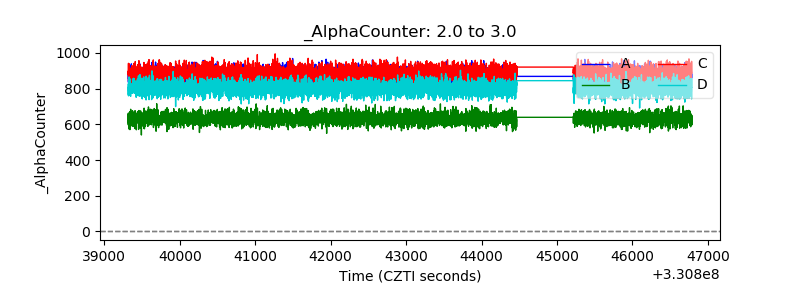 |
| _CPM_Rate | 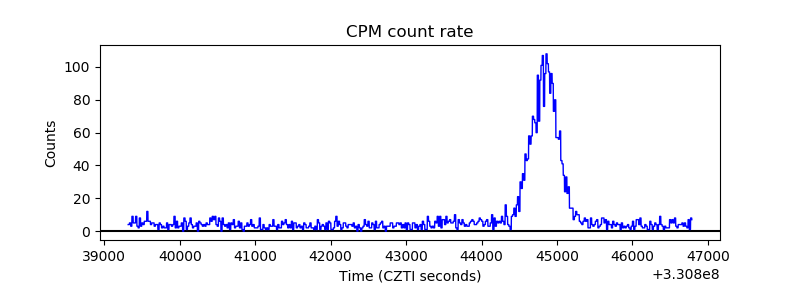 |
| CZT Counter | 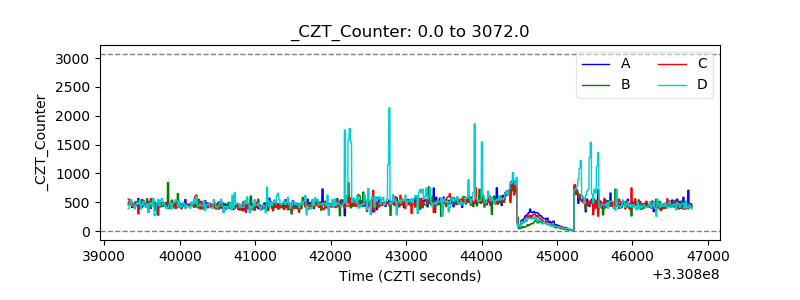 |
| +2.5 Volts monitor |  |
| +5 Volts monitor | 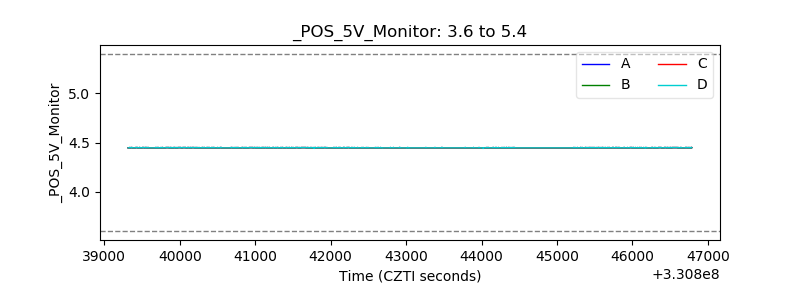 |
| _ROLL_ROT | 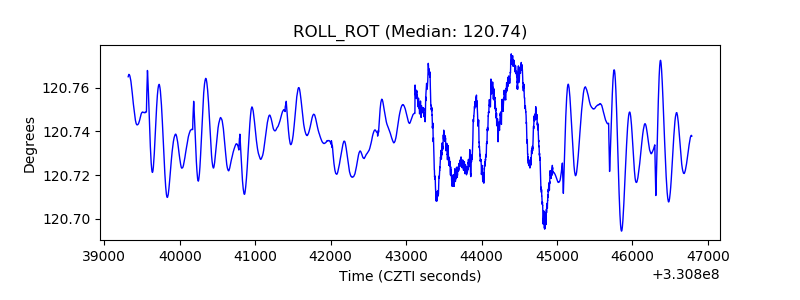 |
| _Roll_DEC | 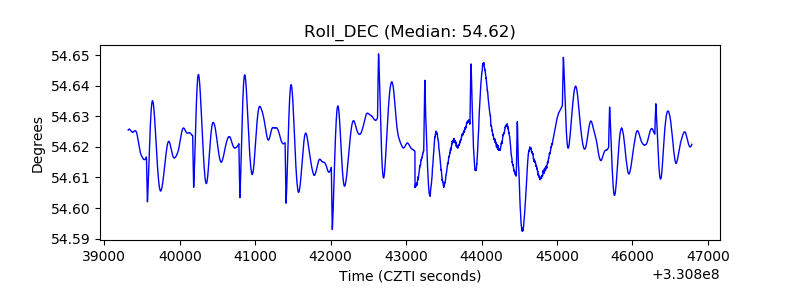 |
| _Roll_RA | 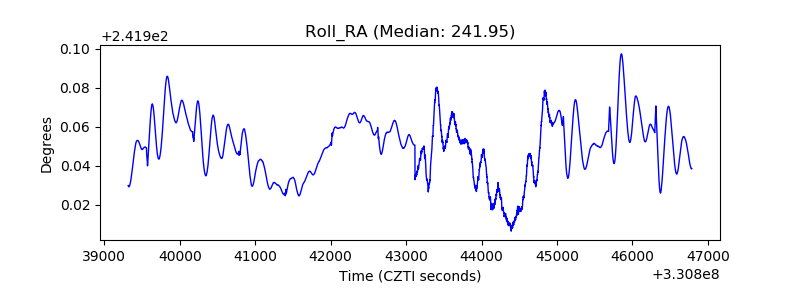 |
| Veto Counter | 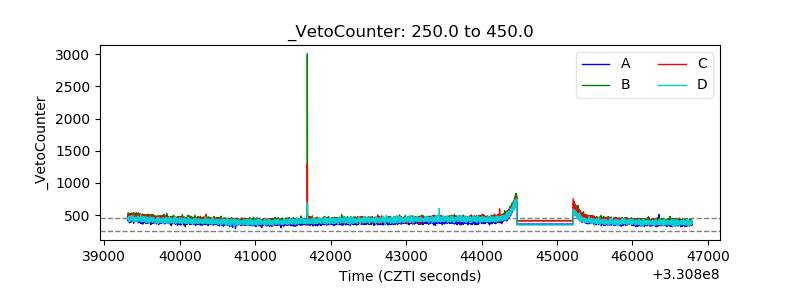 |