| Param | Original file | Final file |
|---|---|---|
| Filename | modeM0/AS1A09_013T02_9000003734_25653cztM0_level2.evt | modeM0/AS1A09_013T02_9000003734_25653cztM0_level2_quad_clean.evt |
| Size (bytes) | 551,960,640 | 95,474,880 |
| Size | 526.4 MB | 91.1 MB |
| Events in quadrant A | 3,667,958 | 603,850 |
| Events in quadrant B | 3,569,237 | 613,947 |
| Events in quadrant C | 3,620,811 | 584,153 |
| Events in quadrant D | 5,349,394 | 567,455 |
| Mode M9 | |||
|---|---|---|---|
| Quadrant | BADHDUFLAG | Total packets | Discarded packets |
| A | 0 | 5 | 0 |
| B | 0 | 6 | 0 |
| C | 0 | 6 | 0 |
| D | 0 | 6 | 0 |
| Mode M0 | |||
|---|---|---|---|
| Quadrant | BADHDUFLAG | Total packets | Discarded packets |
| A | 0 | 15494 | 0 |
| B | 0 | 15475 | 0 |
| C | 0 | 15579 | 0 |
| D | 0 | 20847 | 0 |
| Quadrant | Total seconds | Saturated seconds | Saturation percentage |
|---|---|---|---|
| A | 7502 | 157 | 2.092775% |
| B | 7502 | 166 | 2.212743% |
| C | 7502 | 175 | 2.332711% |
| D | 7502 | 342 | 4.558784% |
Noise dominated data is calculated using 1-second bins in cleaned event files. If a bin has >2000 counts, and if more than 50% of those come from <1% of pixels, then it is considered to be noise-dominated and hence unusable.
| Quadrant | # 1 sec bins | Bins with >0 counts | Bins with >2000 counts | High rate bins dominated by noise | Noise dominated (total time) | Noise dominated (detector-on time) | Marked lightcurve |
|---|---|---|---|---|---|---|---|
| A | 7827 | 7503 | 0 | 0 | 0.00% | 0.00% | 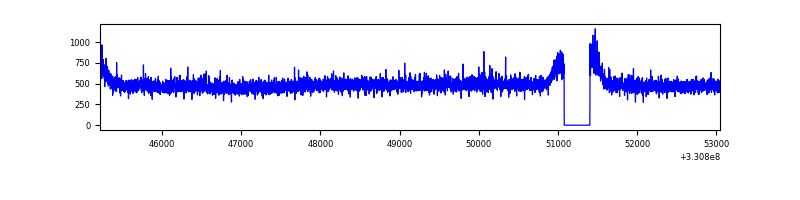 |
| B | 7827 | 7503 | 2 | 2 | 0.03% | 0.03% | 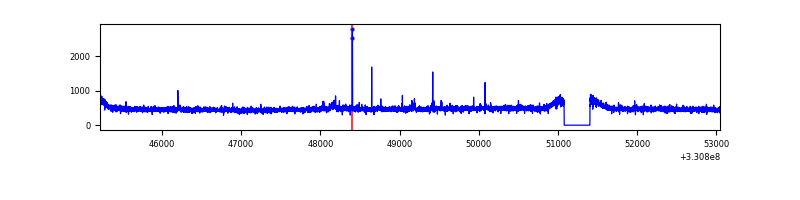 |
| C | 7827 | 7503 | 0 | 0 | 0.00% | 0.00% | 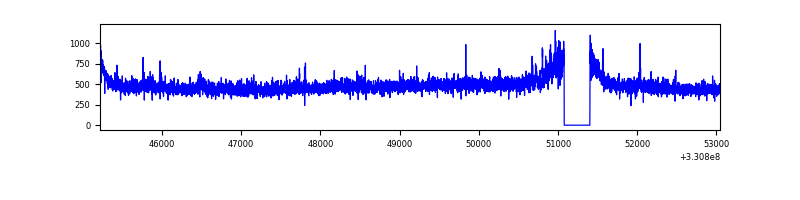 |
| D | 7827 | 7503 | 216 | 216 | 2.76% | 2.88% | 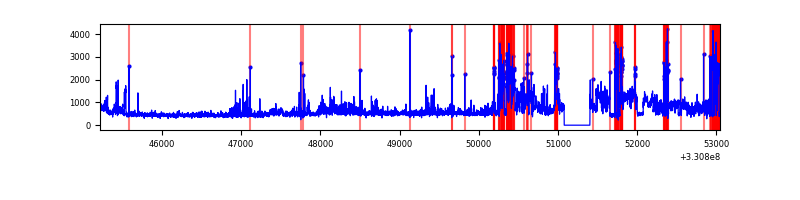 |
Top three noisy pixels from each quadrant. If the there are fewer than three noisy pixels in the level2.evt file, extra rows are filled as -1
| Pixel properties | Quadrant properties | ||||||
|---|---|---|---|---|---|---|---|
| Quadrant | DetID | PixID | Counts | Sigma | Mean | Median | Sigma |
| A | 8 | 192 | 197842 | 1088.34 | 900 | 881 | 181.0 |
| A | 13 | 254 | 10999 | 55.91 | 900 | 881 | 181.0 |
| A | 3 | 137 | 8616 | 42.74 | 900 | 881 | 181.0 |
| B | 0 | 245 | 28462 | 159.41 | 899 | 875 | 173.1 |
| B | 12 | 111 | 21608 | 119.8 | 899 | 875 | 173.1 |
| B | 11 | 111 | 19457 | 107.37 | 899 | 875 | 173.1 |
| C | 14 | 238 | 138762 | 681.78 | 864 | 867 | 202.3 |
| C | 3 | 233 | 116942 | 573.9 | 864 | 867 | 202.3 |
| C | 13 | 61 | 6018 | 25.47 | 864 | 867 | 202.3 |
| D | 1 | 52 | 1753149 | 7793.59 | 853 | 834 | 224.8 |
| D | 8 | 195 | 319804 | 1418.65 | 853 | 834 | 224.8 |
| D | 2 | 234 | 28750 | 124.16 | 853 | 834 | 224.8 |
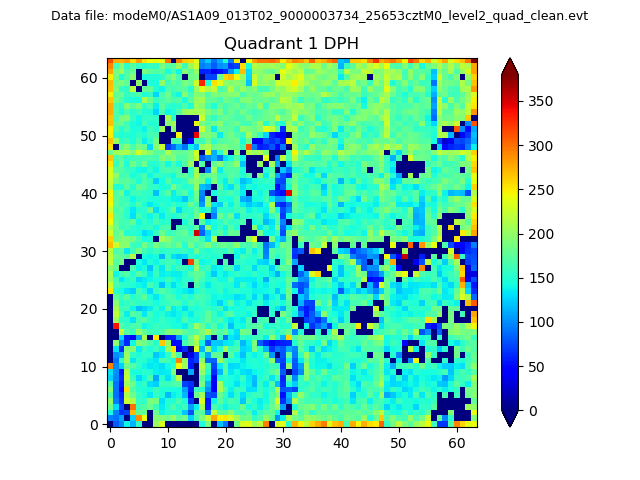
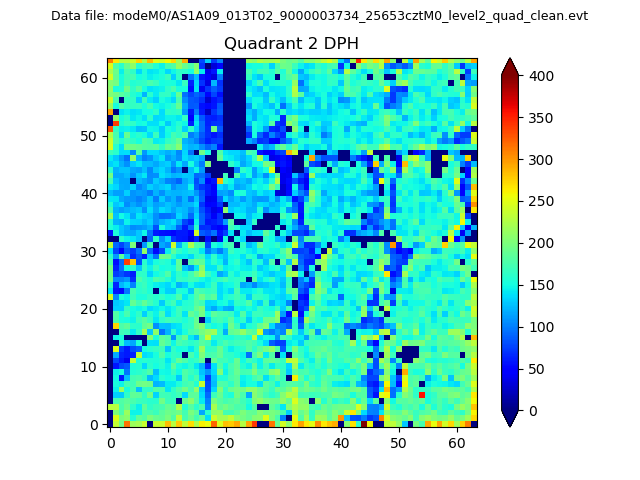
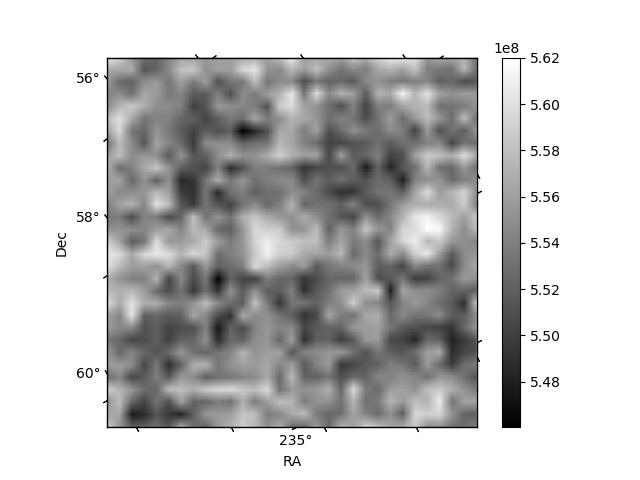
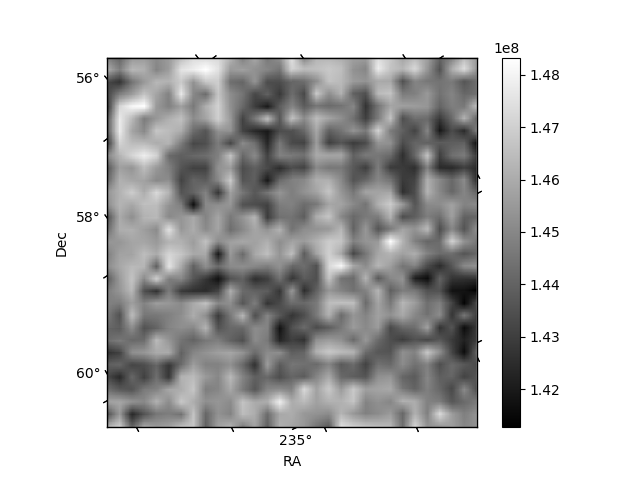
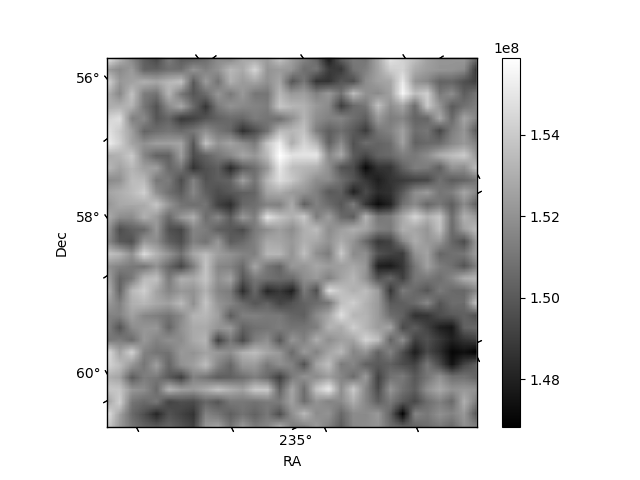
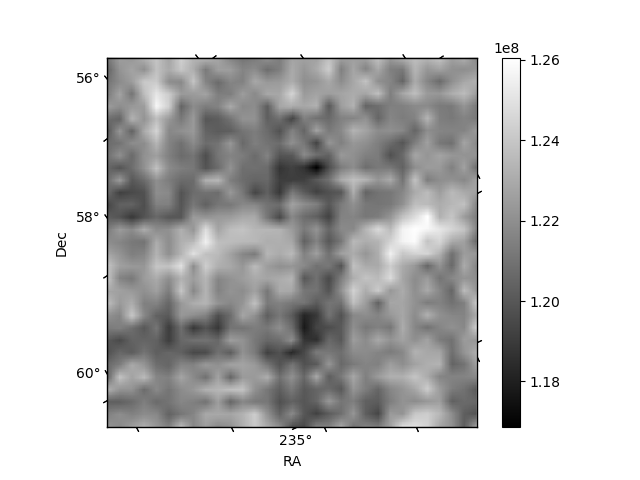
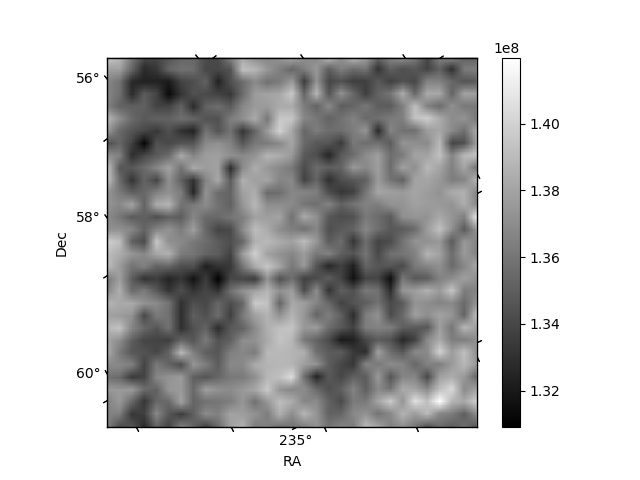
Histogram calculated using DETX and DETY for each event in the final _common_clean file
| Quadrant A |  |
 |
Quadrant B |
|---|---|---|---|
| Quadrant D | 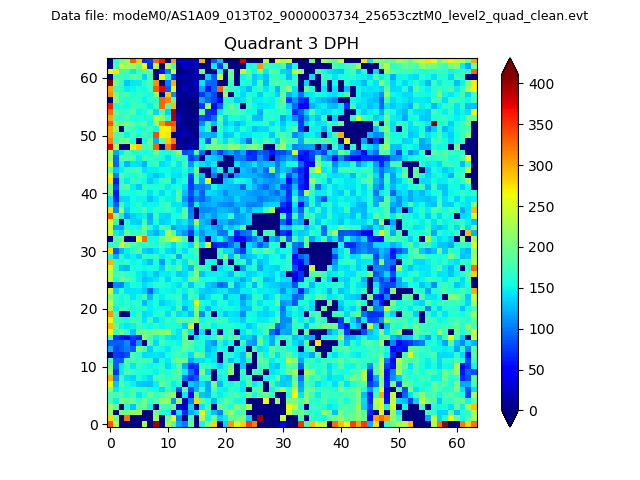 |
 |
Quadrant C |
| Plot type | Count rate plots | Images |
|---|---|---|
| Comparison with Poisson distribution Blue bars denote a histogram of data divided into 1 sec bins. Red curve is a Poisson curve with rate = median count rate of data. |
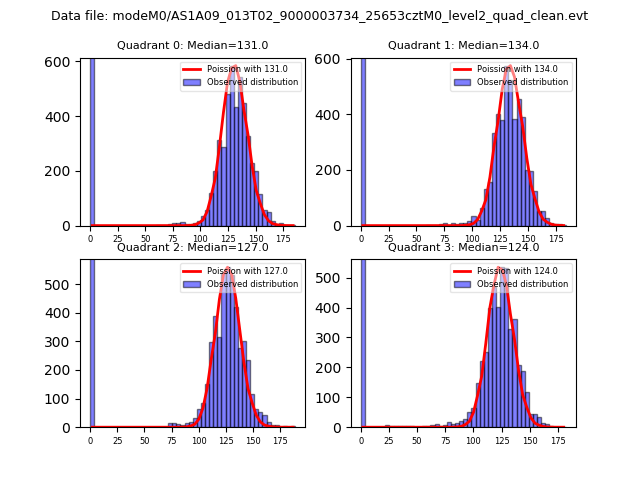 |
 |
| Quadrant-wise count rates Data is divided into 100 sec bins |
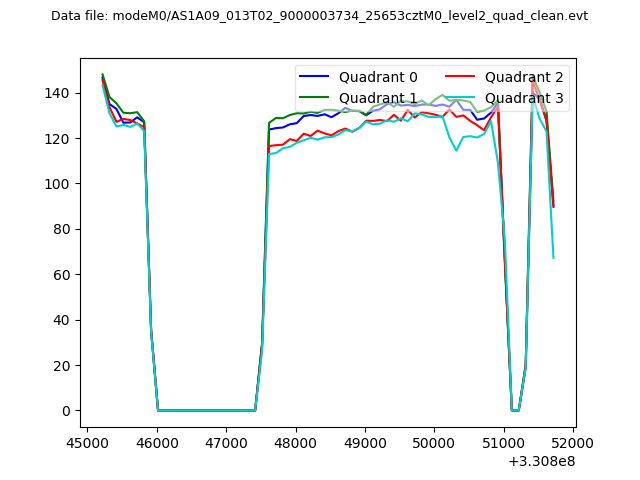 |
|
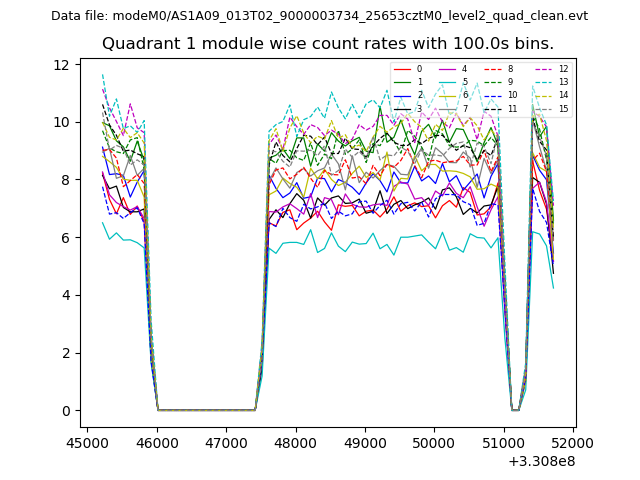
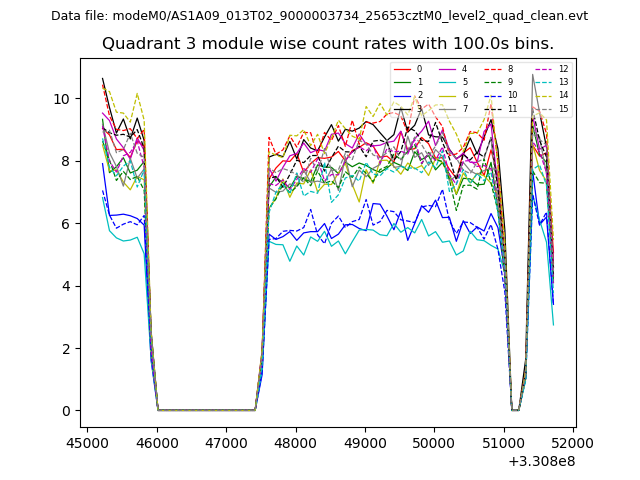
| Module-wise count rates for Quadrant A Data is divided into 100 sec bins |
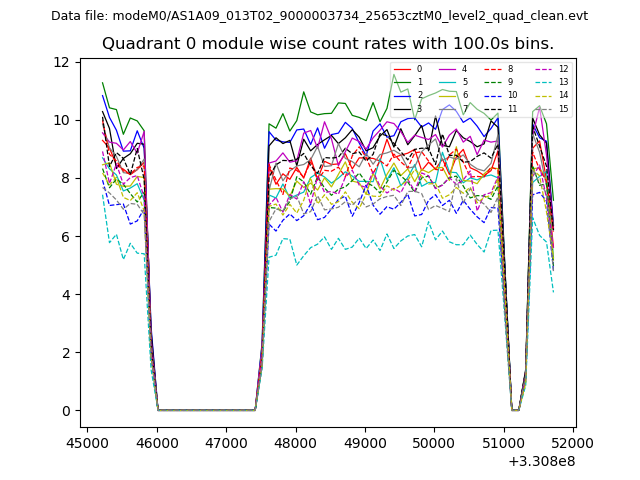 |
 |
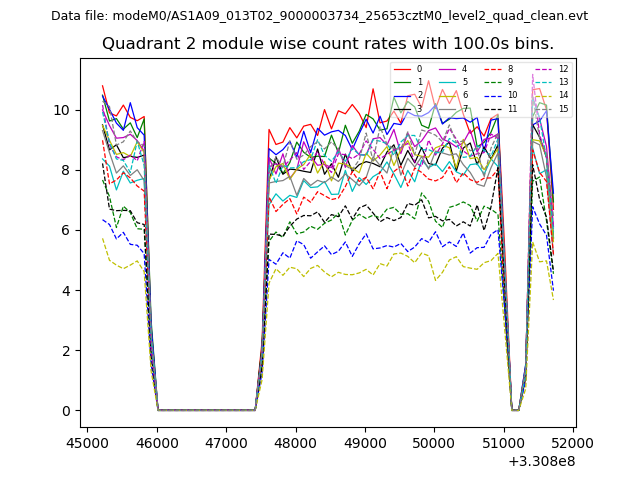
| Module-wise count rates for Quadrant B Data is divided into 100 sec bins |
 |
 |
| Module-wise count rates for Quadrant C Data is divided into 100 sec bins |
 |
 |
| Module-wise count rates for Quadrant D Data is divided into 100 sec bins |
 |
 |
| Parameter | Plot |
|---|---|
| CZT HV Monitor | 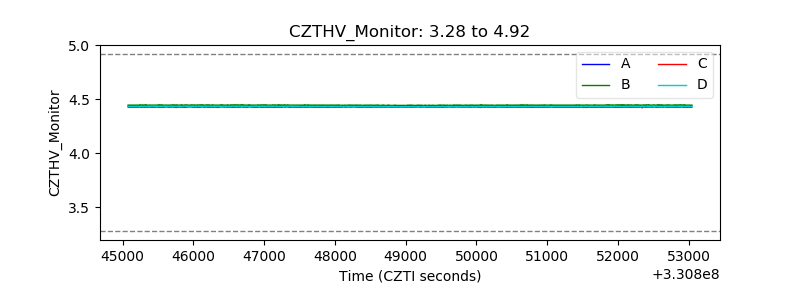 |
| D_VDD | 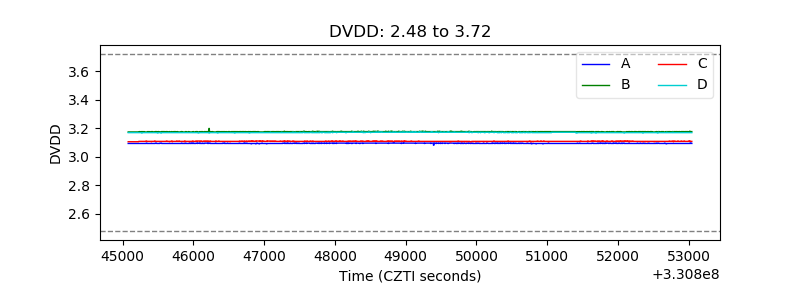 |
| Temperature 1 | 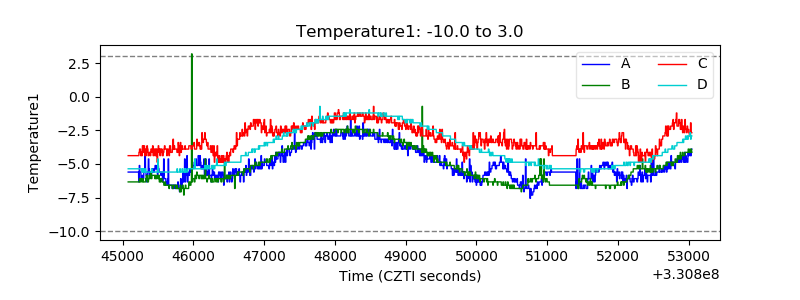 |
| Veto HV Monitor | 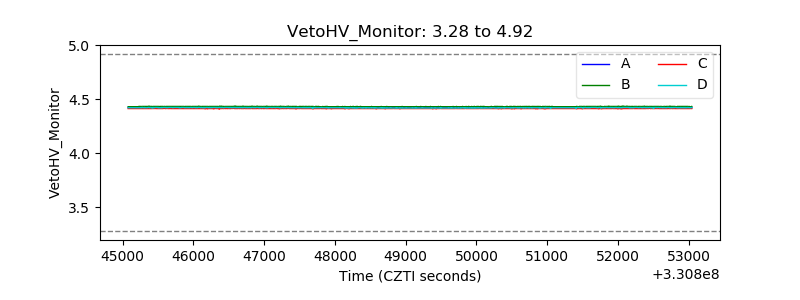 |
| Veto LLD | 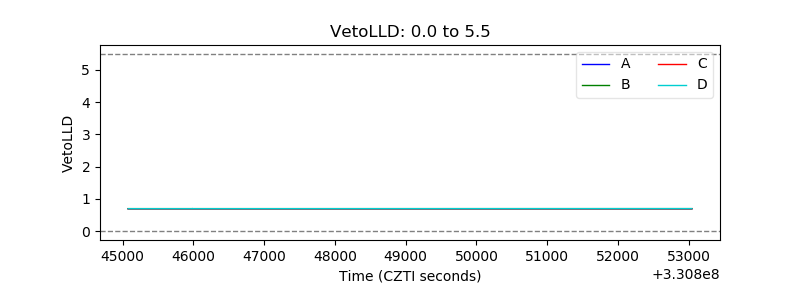 |
| Alpha Counter |  |
| _CPM_Rate |  |
| CZT Counter | 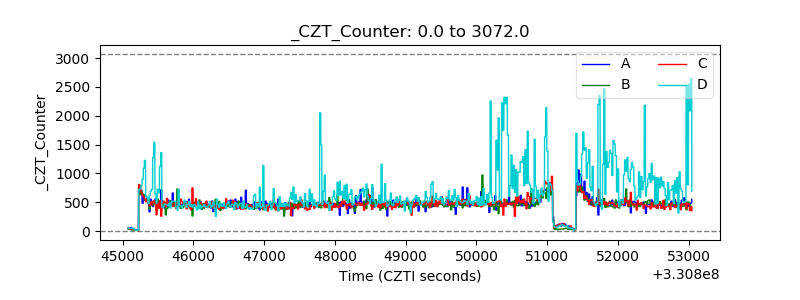 |
| +2.5 Volts monitor |  |
| +5 Volts monitor |  |
| _ROLL_ROT |  |
| _Roll_DEC | 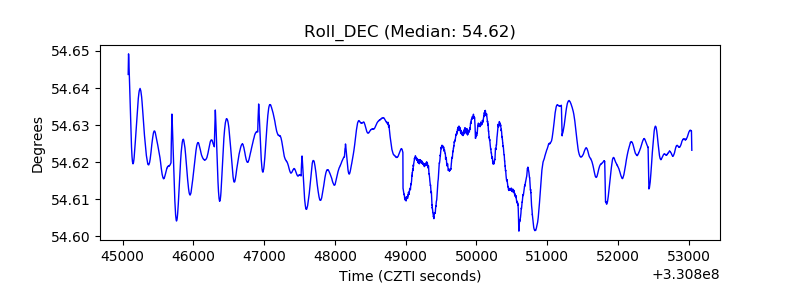 |
| _Roll_RA | 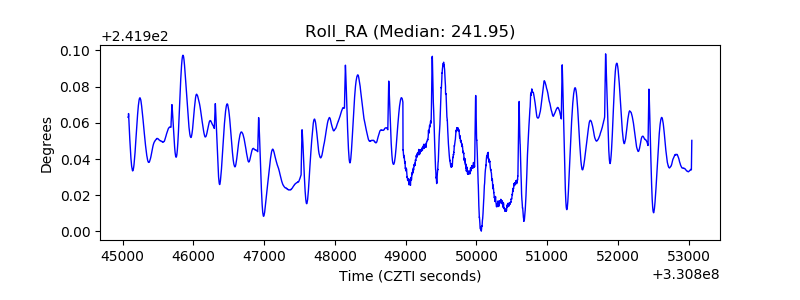 |
| Veto Counter | 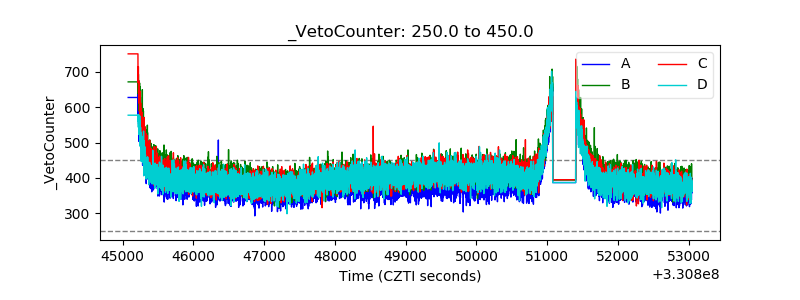 |