| Param | Original file | Final file |
|---|---|---|
| Filename | modeM0/AS1A09_013T02_9000003734_25655cztM0_level2.evt | modeM0/AS1A09_013T02_9000003734_25655cztM0_level2_quad_clean.evt |
| Size (bytes) | 566,412,480 | 98,340,480 |
| Size | 540.2 MB | 93.8 MB |
| Events in quadrant A | 3,979,328 | 617,006 |
| Events in quadrant B | 3,862,776 | 626,039 |
| Events in quadrant C | 4,139,898 | 595,484 |
| Events in quadrant D | 4,633,560 | 588,363 |
| Mode M9 | |||
|---|---|---|---|
| Quadrant | BADHDUFLAG | Total packets | Discarded packets |
| A | 0 | 3 | 0 |
| B | 0 | 3 | 0 |
| C | 0 | 3 | 0 |
| D | 0 | 3 | 0 |
| Mode M0 | |||
|---|---|---|---|
| Quadrant | BADHDUFLAG | Total packets | Discarded packets |
| A | 0 | 16707 | 0 |
| B | 0 | 16560 | 0 |
| C | 0 | 17454 | 0 |
| D | 0 | 18882 | 0 |
| Quadrant | Total seconds | Saturated seconds | Saturation percentage |
|---|---|---|---|
| A | 7926 | 393 | 4.958365% |
| B | 7926 | 435 | 5.488266% |
| C | 7927 | 513 | 6.471553% |
| D | 7927 | 361 | 4.554056% |
Noise dominated data is calculated using 1-second bins in cleaned event files. If a bin has >2000 counts, and if more than 50% of those come from <1% of pixels, then it is considered to be noise-dominated and hence unusable.
| Quadrant | # 1 sec bins | Bins with >0 counts | Bins with >2000 counts | High rate bins dominated by noise | Noise dominated (total time) | Noise dominated (detector-on time) | Marked lightcurve |
|---|---|---|---|---|---|---|---|
| A | 8281 | 7927 | 2 | 2 | 0.02% | 0.03% | 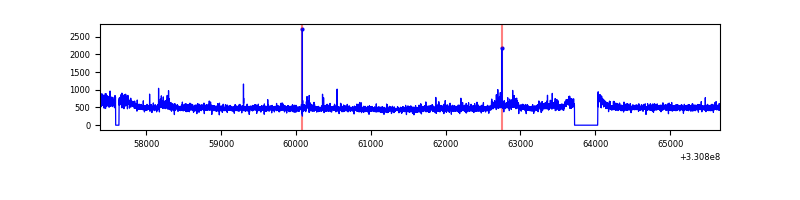 |
| B | 8281 | 7926 | 1 | 1 | 0.01% | 0.01% | 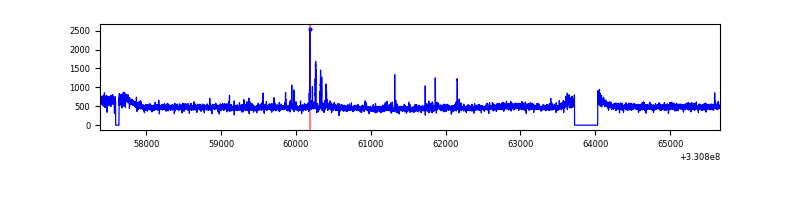 |
| C | 8282 | 7928 | 41 | 41 | 0.50% | 0.52% | 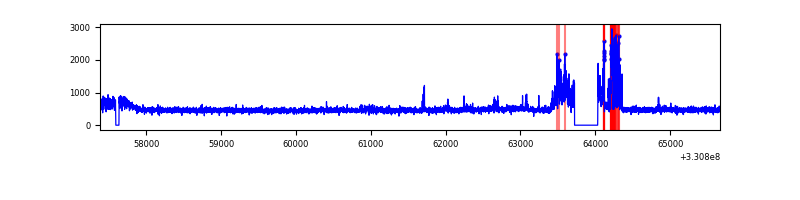 |
| D | 8282 | 7928 | 35 | 35 | 0.42% | 0.44% | 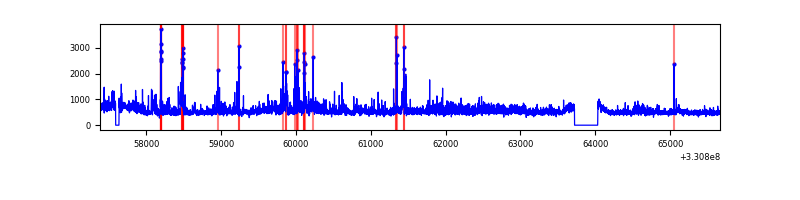 |
Top three noisy pixels from each quadrant. If the there are fewer than three noisy pixels in the level2.evt file, extra rows are filled as -1
| Pixel properties | Quadrant properties | ||||||
|---|---|---|---|---|---|---|---|
| Quadrant | DetID | PixID | Counts | Sigma | Mean | Median | Sigma |
| A | 8 | 192 | 244890 | 1248.4 | 966 | 941 | 195.4 |
| A | 13 | 254 | 11263 | 52.82 | 966 | 941 | 195.4 |
| A | 3 | 137 | 9437 | 43.48 | 966 | 941 | 195.4 |
| B | 0 | 245 | 70957 | 375.79 | 962 | 934 | 186.3 |
| B | 12 | 111 | 23299 | 120.02 | 962 | 934 | 186.3 |
| B | 11 | 111 | 21439 | 110.04 | 962 | 934 | 186.3 |
| C | 3 | 233 | 394059 | 1824.67 | 919 | 921 | 215.5 |
| C | 14 | 238 | 145371 | 670.43 | 919 | 921 | 215.5 |
| C | 8 | 128 | 13153 | 56.77 | 919 | 921 | 215.5 |
| D | 8 | 195 | 558970 | 2288.39 | 929 | 906 | 243.9 |
| D | 1 | 52 | 353538 | 1446.0 | 929 | 906 | 243.9 |
| D | 2 | 244 | 98804 | 401.44 | 929 | 906 | 243.9 |
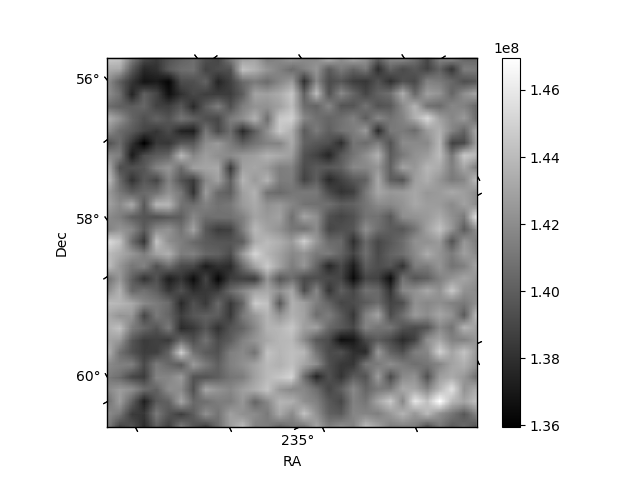
Histogram calculated using DETX and DETY for each event in the final _common_clean file
| Quadrant A | 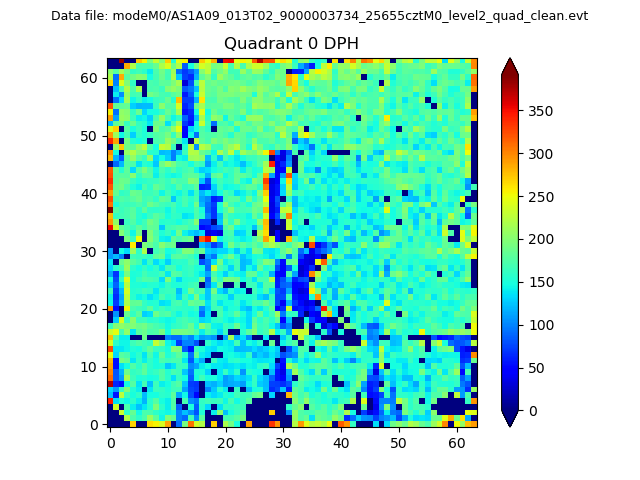 |
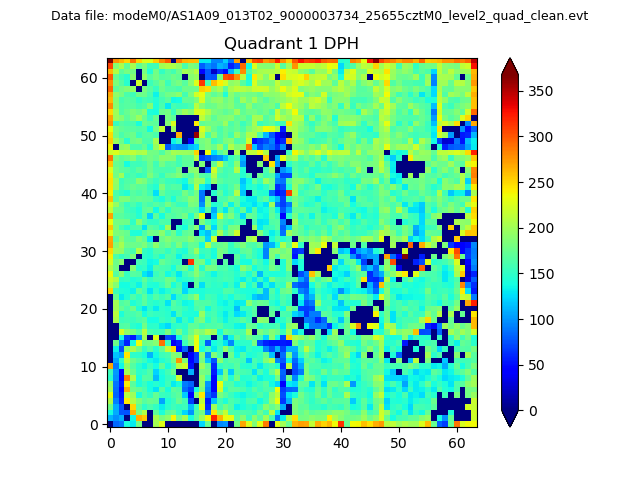 |
Quadrant B |
|---|---|---|---|
| Quadrant D | 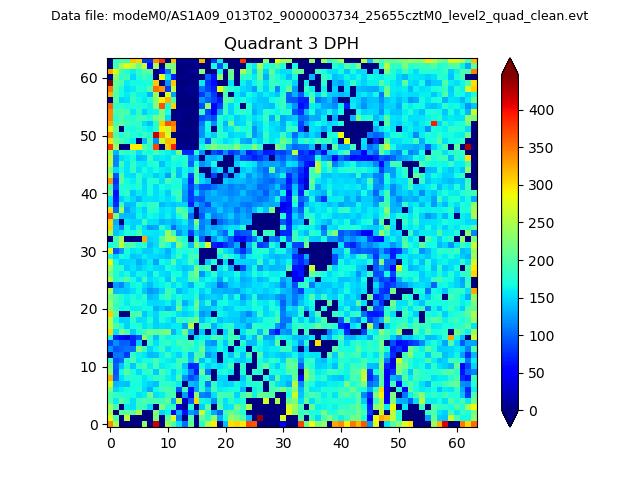 |
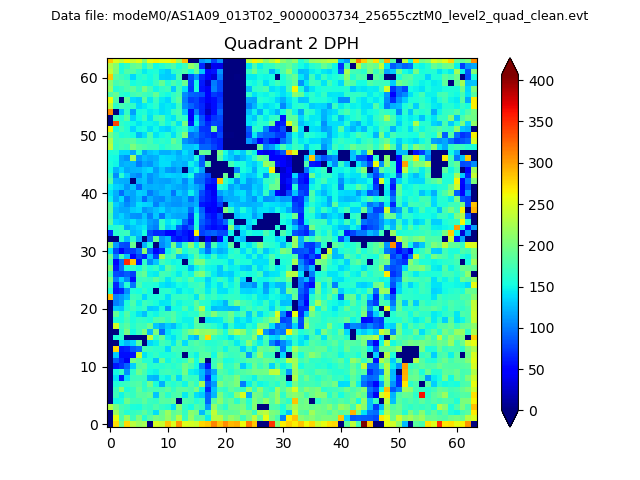 |
Quadrant C |
| Plot type | Count rate plots | Images |
|---|---|---|
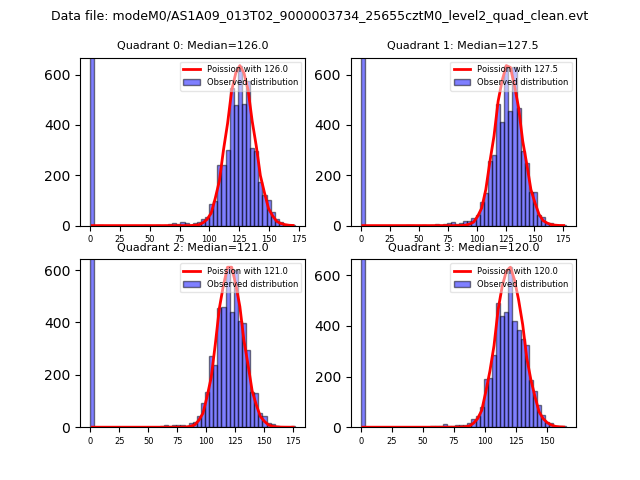
| Comparison with Poisson distribution Blue bars denote a histogram of data divided into 1 sec bins. Red curve is a Poisson curve with rate = median count rate of data. |
 |
 |
| Quadrant-wise count rates Data is divided into 100 sec bins |
 |
|
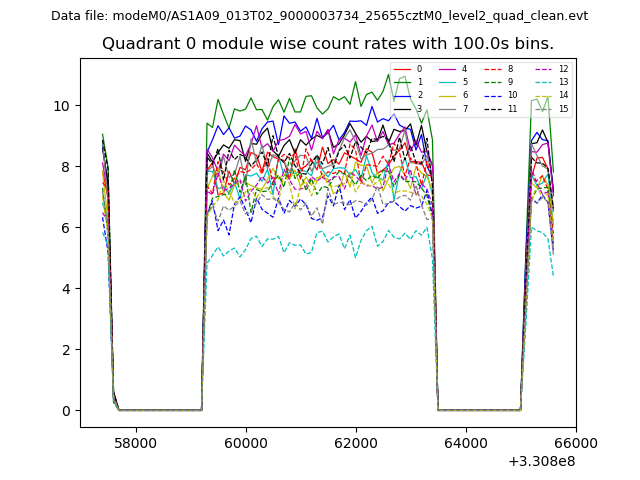
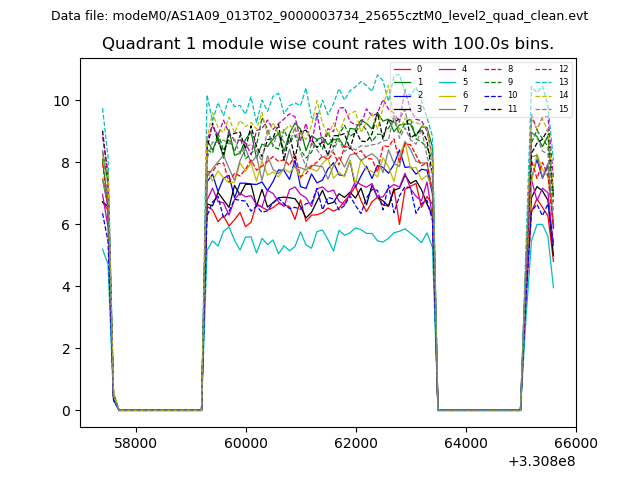
| Module-wise count rates for Quadrant A Data is divided into 100 sec bins |
 |
 |
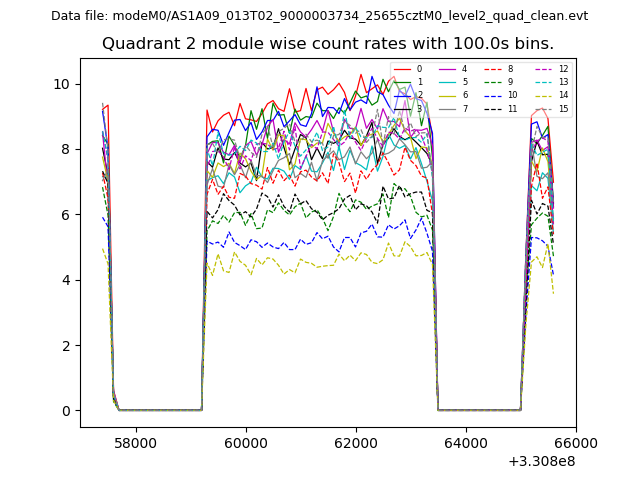
| Module-wise count rates for Quadrant B Data is divided into 100 sec bins |
 |
 |
| Module-wise count rates for Quadrant C Data is divided into 100 sec bins |
 |
 |
| Module-wise count rates for Quadrant D Data is divided into 100 sec bins |
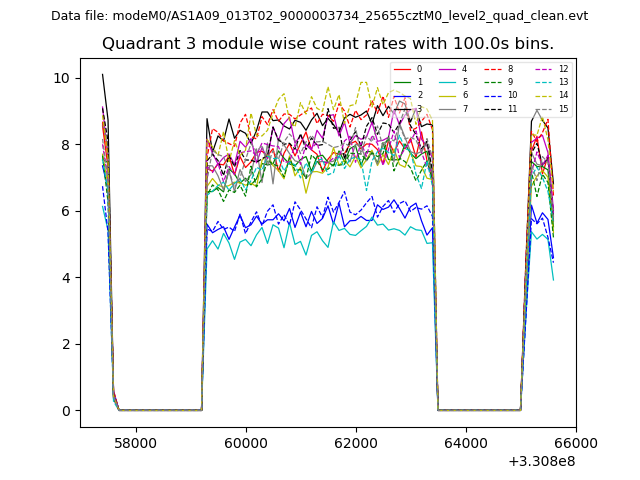 |
 |
| Parameter | Plot |
|---|---|
| CZT HV Monitor | 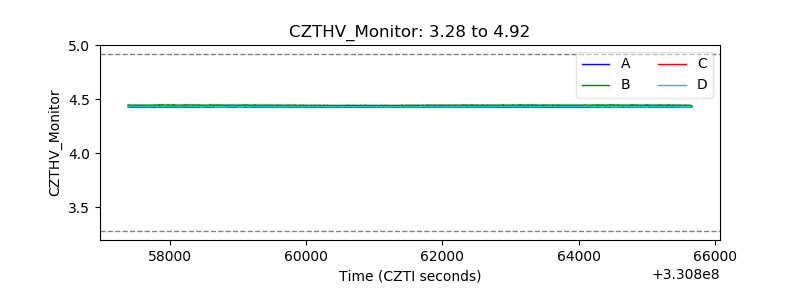 |
| D_VDD | 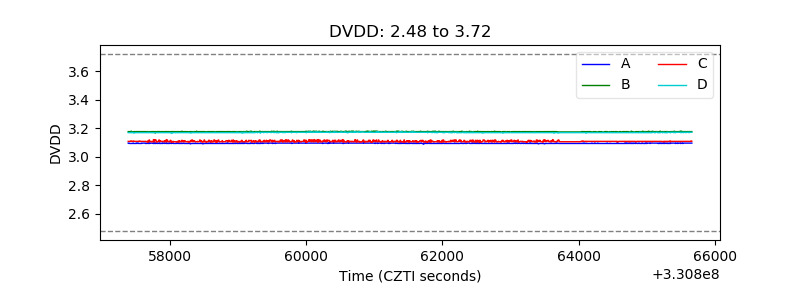 |
| Temperature 1 | 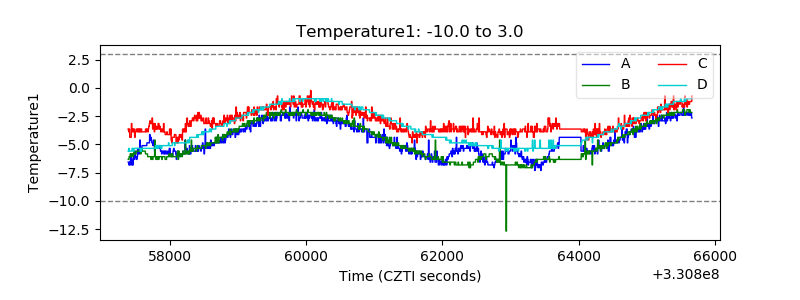 |
| Veto HV Monitor | 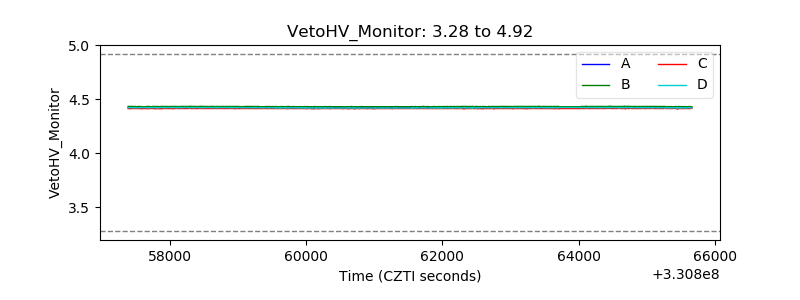 |
| Veto LLD | 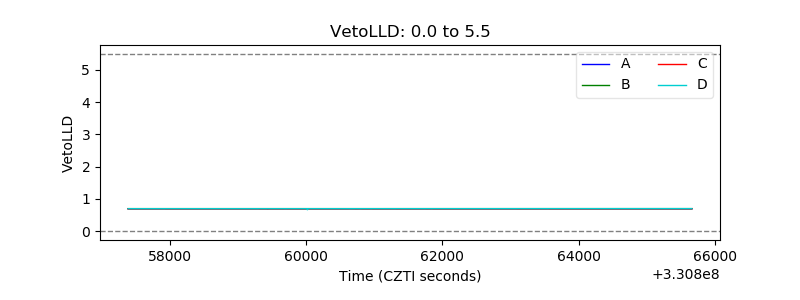 |
| Alpha Counter | 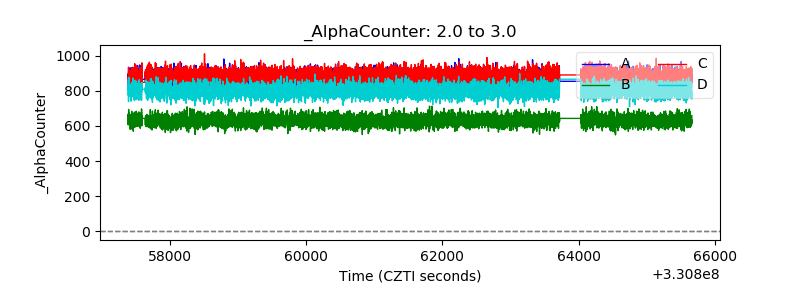 |
| _CPM_Rate | 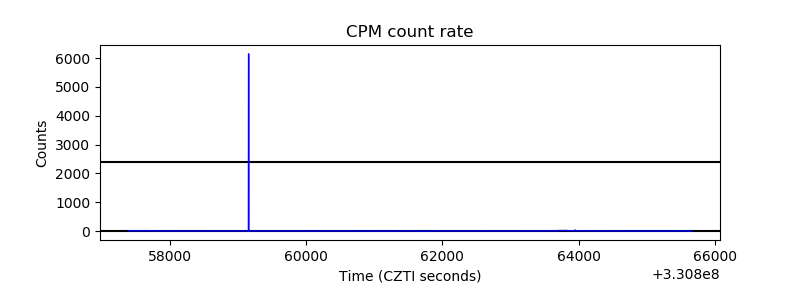 |
| CZT Counter | 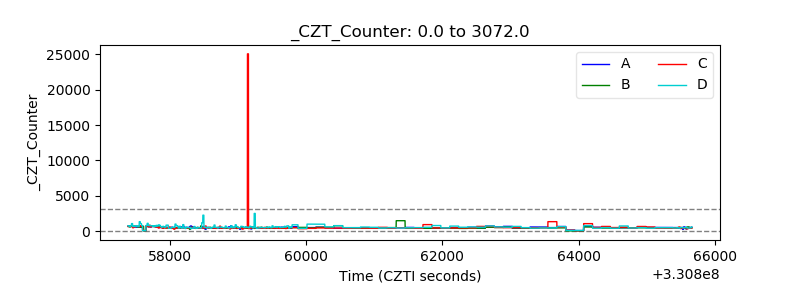 |
| +2.5 Volts monitor |  |
| +5 Volts monitor |  |
| _ROLL_ROT | 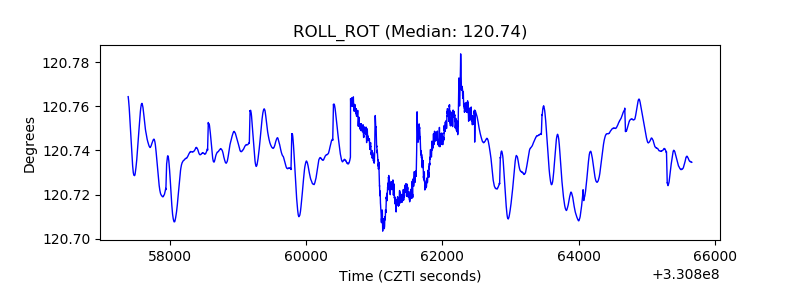 |
| _Roll_DEC | 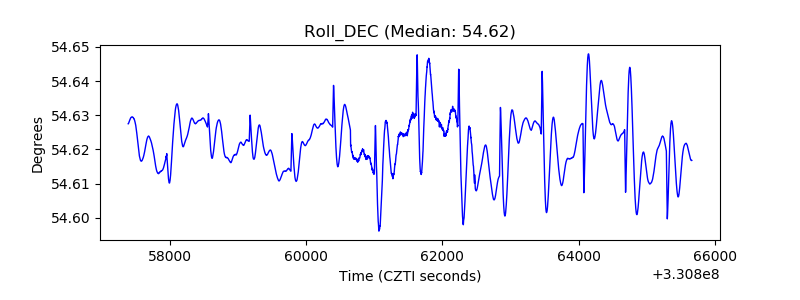 |
| _Roll_RA | 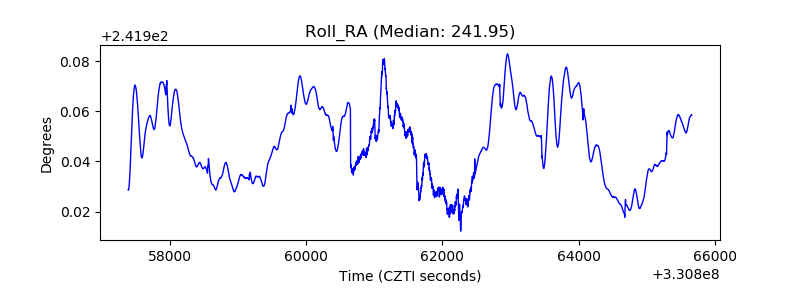 |
| Veto Counter | 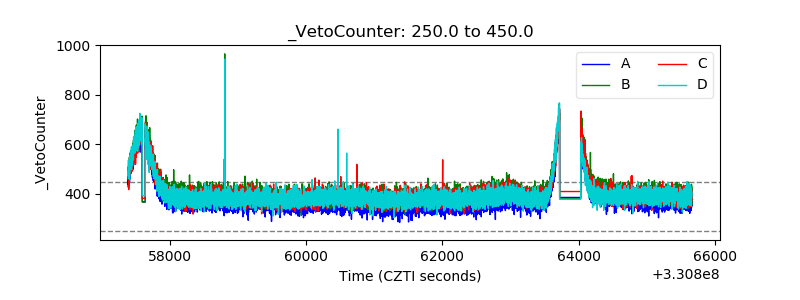 |