| Param | Original file | Final file |
|---|---|---|
| Filename | modeM0/AS1A09_013T02_9000003734_25657cztM0_level2.evt | modeM0/AS1A09_013T02_9000003734_25657cztM0_level2_quad_clean.evt |
| Size (bytes) | 243,126,720 | 60,094,080 |
| Size | 231.9 MB | 57.3 MB |
| Events in quadrant A | 1,817,875 | 398,408 |
| Events in quadrant B | 1,716,484 | 399,474 |
| Events in quadrant C | 1,706,037 | 379,096 |
| Events in quadrant D | 1,863,678 | 375,265 |
| Mode M0 | |||
|---|---|---|---|
| Quadrant | BADHDUFLAG | Total packets | Discarded packets |
| A | 0 | 7722 | 0 |
| B | 0 | 7628 | 0 |
| C | 0 | 7589 | 0 |
| D | 0 | 7927 | 0 |
| Quadrant | Total seconds | Saturated seconds | Saturation percentage |
|---|---|---|---|
| A | 3781 | 6 | 0.158688% |
| B | 3782 | 3 | 0.079323% |
| C | 3782 | 11 | 0.290851% |
| D | 3782 | 2 | 0.052882% |
Noise dominated data is calculated using 1-second bins in cleaned event files. If a bin has >2000 counts, and if more than 50% of those come from <1% of pixels, then it is considered to be noise-dominated and hence unusable.
| Quadrant | # 1 sec bins | Bins with >0 counts | Bins with >2000 counts | High rate bins dominated by noise | Noise dominated (total time) | Noise dominated (detector-on time) | Marked lightcurve |
|---|---|---|---|---|---|---|---|
| A | 3781 | 3781 | 0 | 0 | 0.00% | 0.00% | 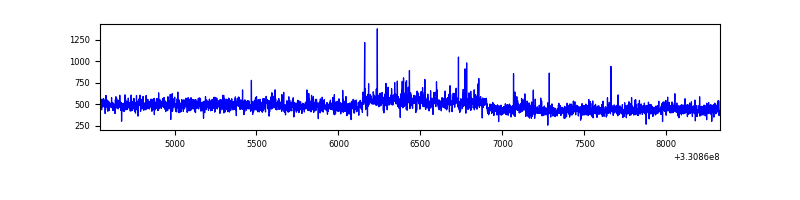 |
| B | 3782 | 3782 | 0 | 0 | 0.00% | 0.00% | 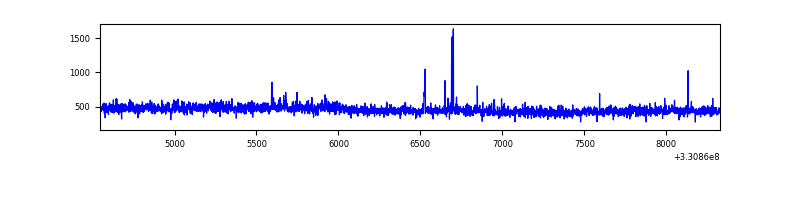 |
| C | 3782 | 3782 | 0 | 0 | 0.00% | 0.00% | 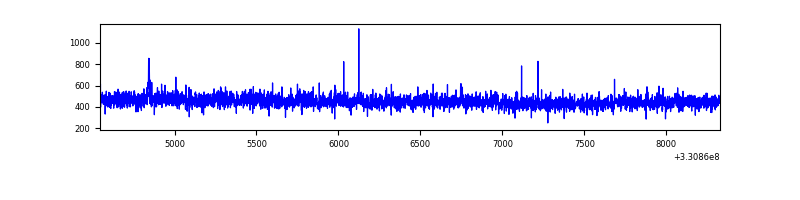 |
| D | 3782 | 3782 | 1 | 1 | 0.03% | 0.03% | 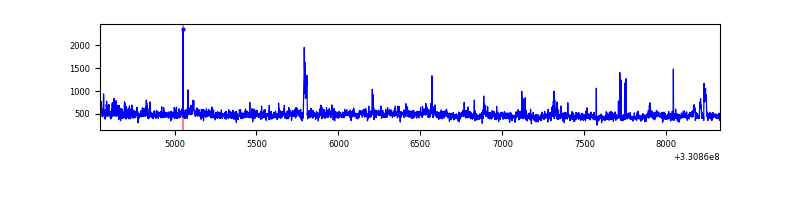 |
Top three noisy pixels from each quadrant. If the there are fewer than three noisy pixels in the level2.evt file, extra rows are filled as -1
| Pixel properties | Quadrant properties | ||||||
|---|---|---|---|---|---|---|---|
| Quadrant | DetID | PixID | Counts | Sigma | Mean | Median | Sigma |
| A | 8 | 192 | 148209 | 1677.54 | 432 | 422 | 88.1 |
| A | 13 | 254 | 5489 | 57.52 | 432 | 422 | 88.1 |
| A | 3 | 137 | 3848 | 38.89 | 432 | 422 | 88.1 |
| B | 0 | 245 | 21869 | 256.46 | 429 | 417 | 83.6 |
| B | 12 | 111 | 10075 | 115.46 | 429 | 417 | 83.6 |
| B | 11 | 111 | 8945 | 101.95 | 429 | 417 | 83.6 |
| C | 14 | 238 | 67264 | 676.71 | 415 | 416 | 98.8 |
| C | 3 | 233 | 19509 | 193.28 | 415 | 416 | 98.8 |
| C | 13 | 61 | 2793 | 24.06 | 415 | 416 | 98.8 |
| D | 8 | 195 | 164935 | 1581.84 | 422 | 408 | 104.0 |
| D | 1 | 52 | 79753 | 762.86 | 422 | 408 | 104.0 |
| D | 2 | 234 | 18006 | 169.2 | 422 | 408 | 104.0 |
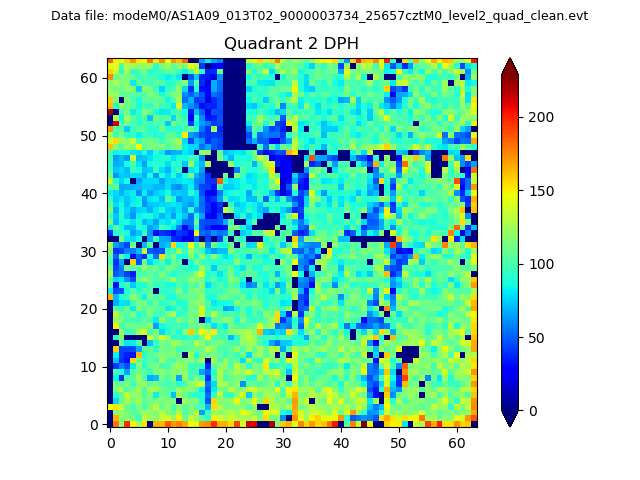
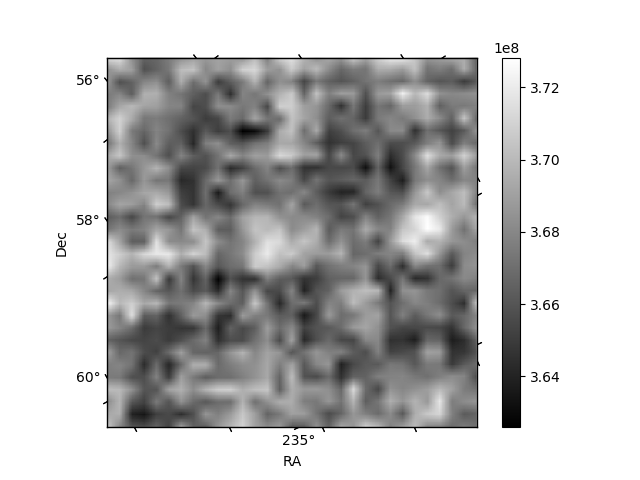
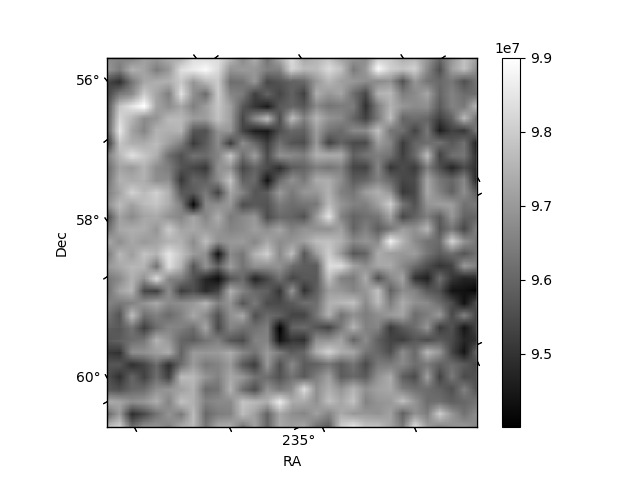
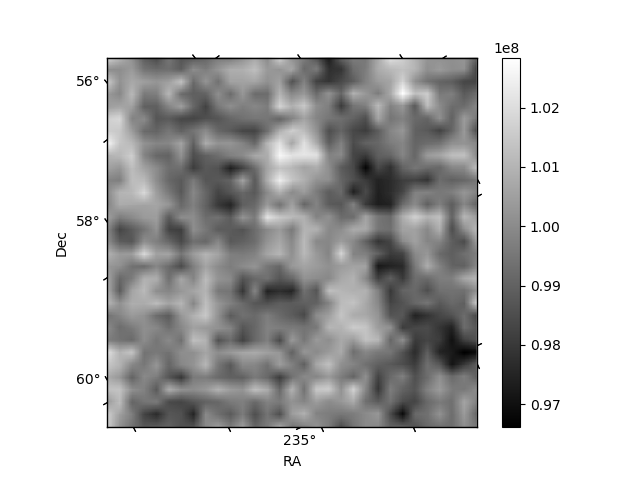
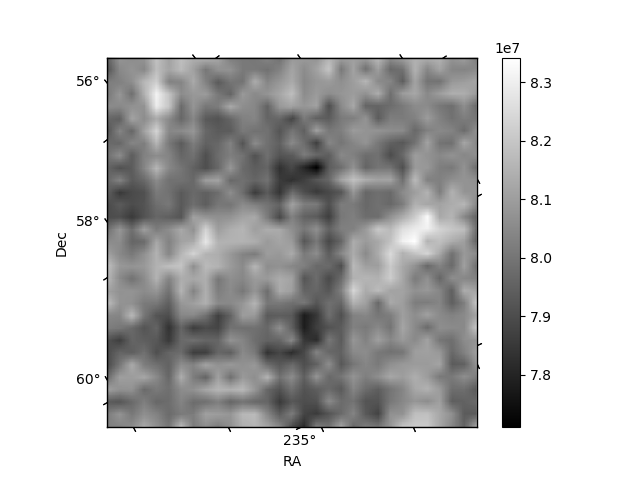
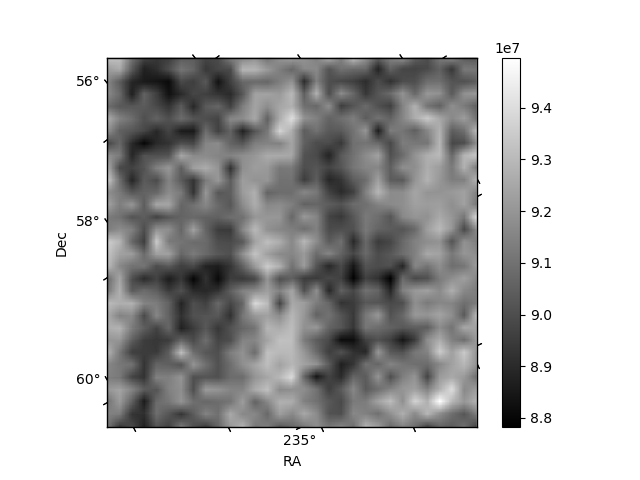
Histogram calculated using DETX and DETY for each event in the final _common_clean file
| Quadrant A | 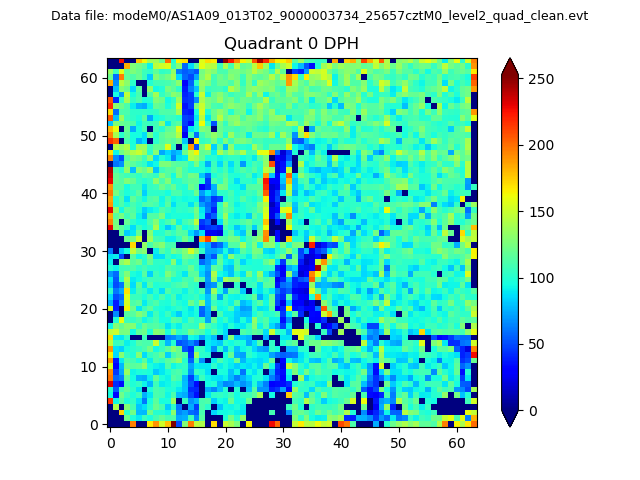 |
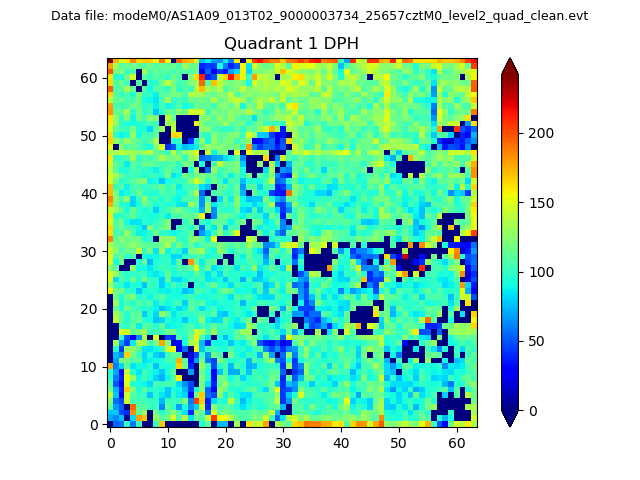 |
Quadrant B |
|---|---|---|---|
| Quadrant D | 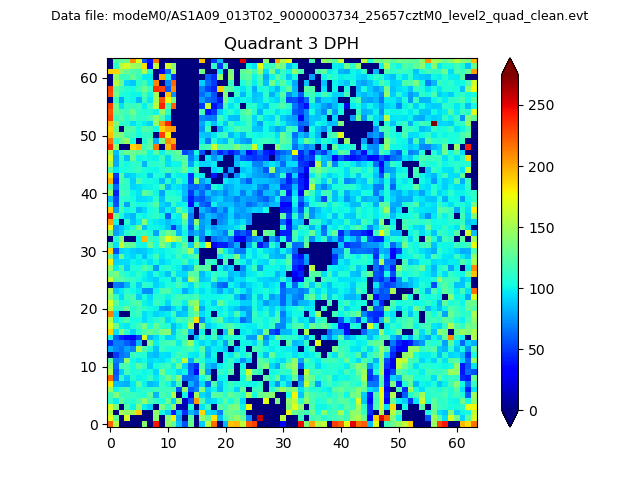 |
 |
Quadrant C |
| Plot type | Count rate plots | Images |
|---|---|---|
| Comparison with Poisson distribution Blue bars denote a histogram of data divided into 1 sec bins. Red curve is a Poisson curve with rate = median count rate of data. |
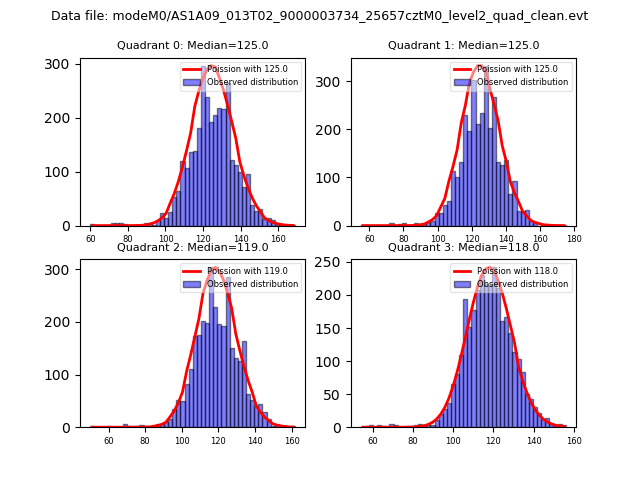 |
 |
| Quadrant-wise count rates Data is divided into 100 sec bins |
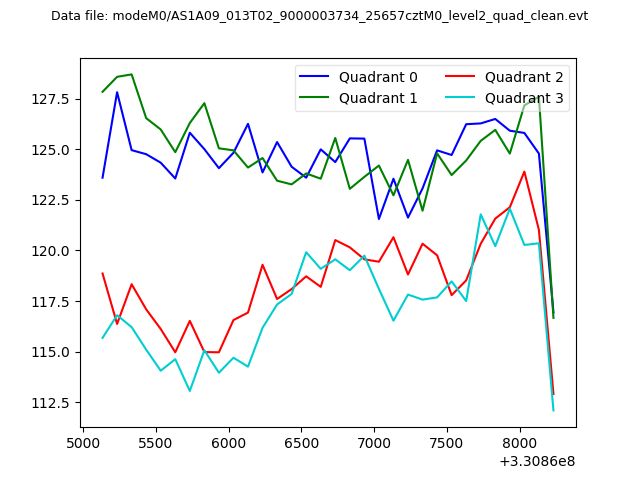 |
|
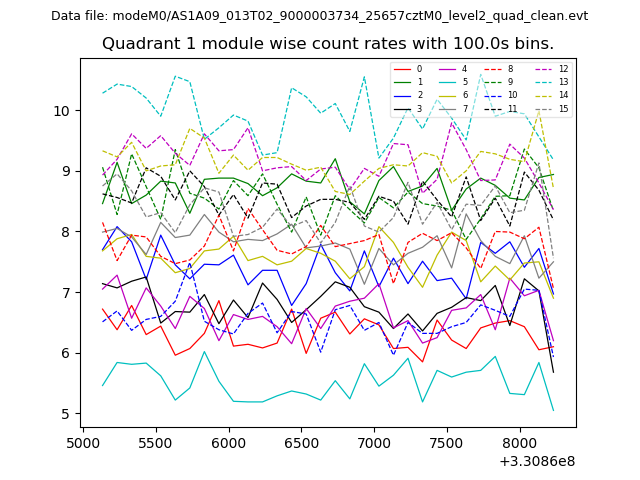
| Module-wise count rates for Quadrant A Data is divided into 100 sec bins |
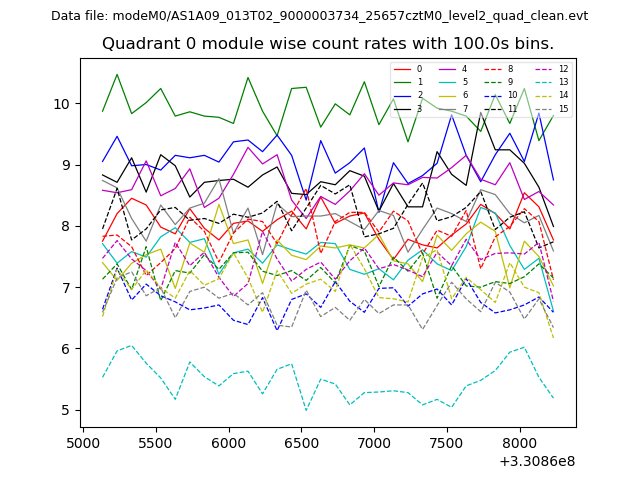 |
 |
| Module-wise count rates for Quadrant B Data is divided into 100 sec bins |
 |
 |
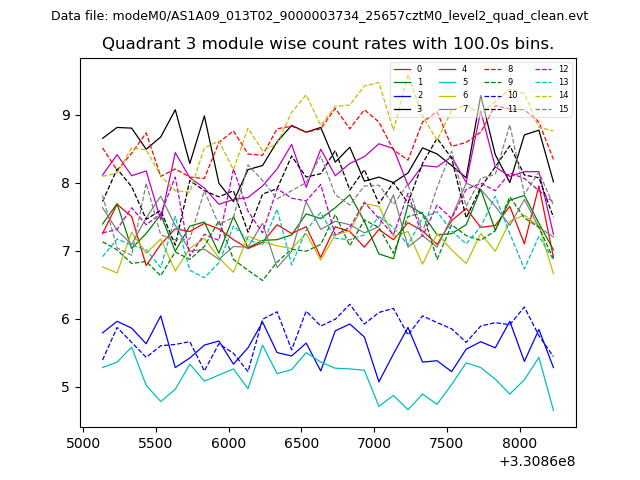
| Module-wise count rates for Quadrant C Data is divided into 100 sec bins |
 |
 |
| Module-wise count rates for Quadrant D Data is divided into 100 sec bins |
 |
 |
| Parameter | Plot |
|---|---|
| CZT HV Monitor |  |
| D_VDD | 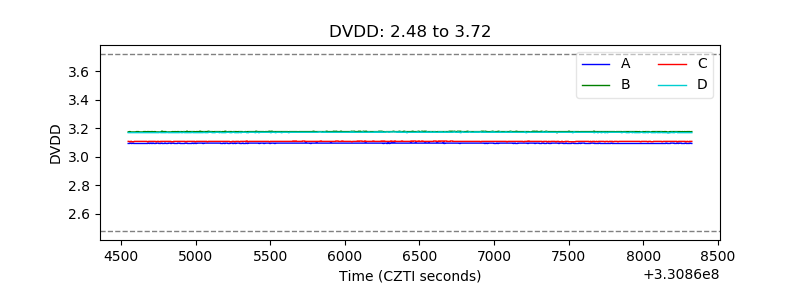 |
| Temperature 1 | 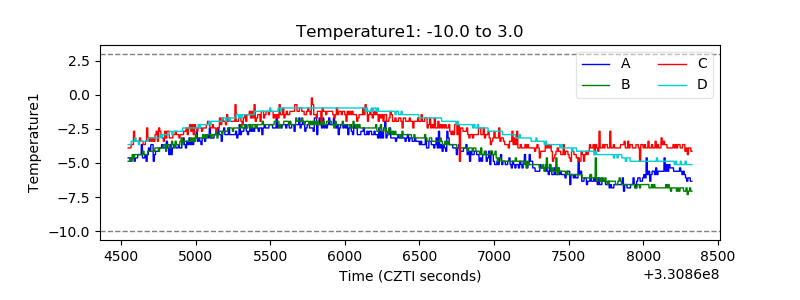 |
| Veto HV Monitor | 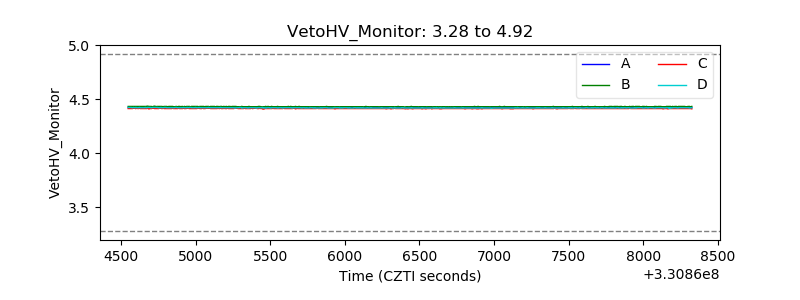 |
| Veto LLD | 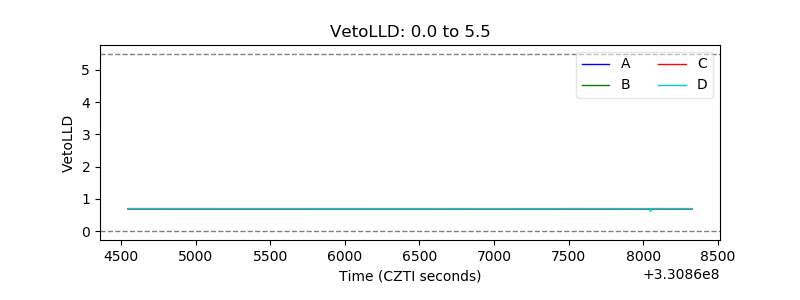 |
| Alpha Counter | 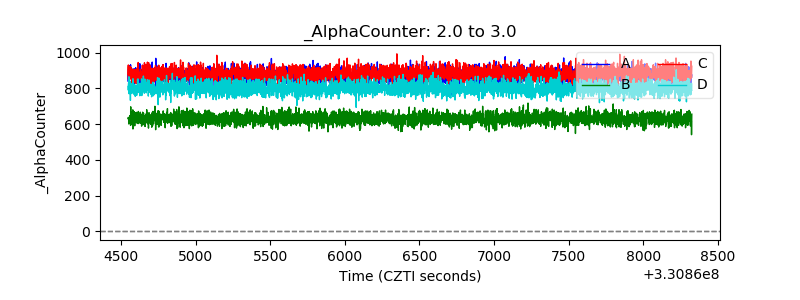 |
| _CPM_Rate | 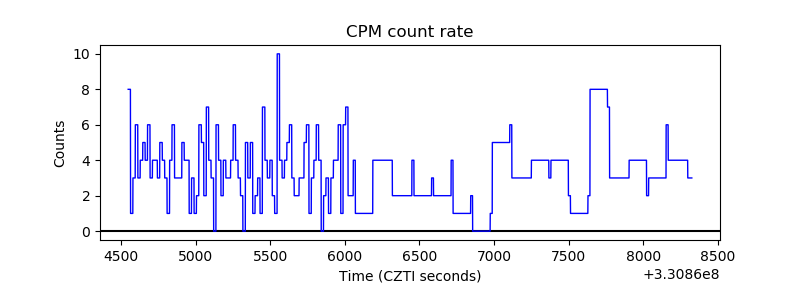 |
| CZT Counter | 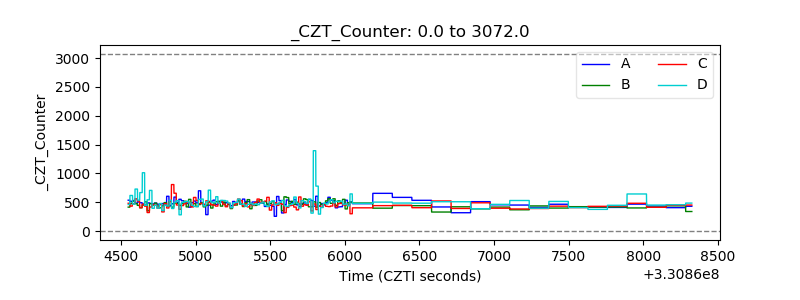 |
| +2.5 Volts monitor |  |
| +5 Volts monitor |  |
| _ROLL_ROT | 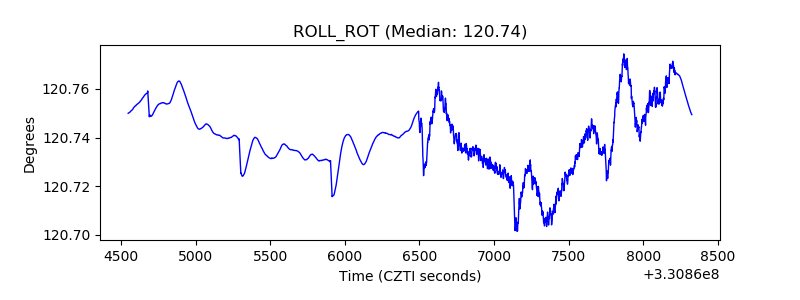 |
| _Roll_DEC | 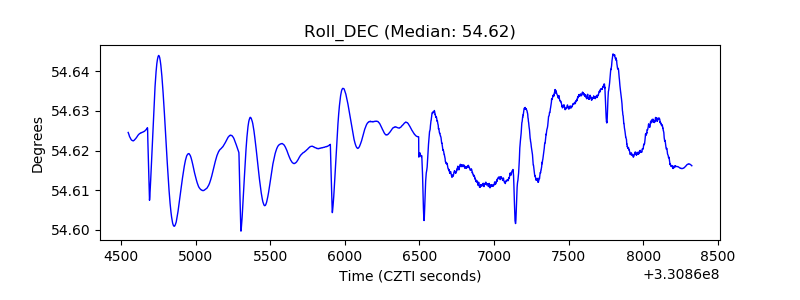 |
| _Roll_RA | 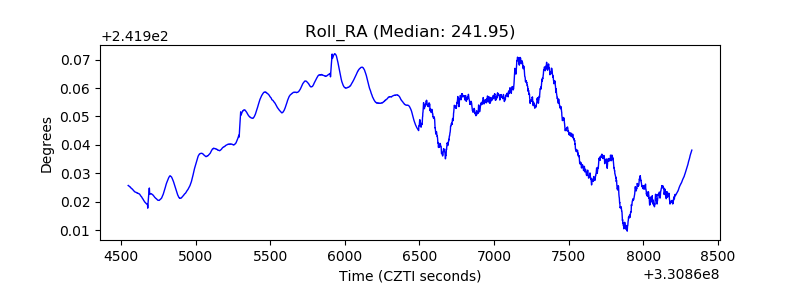 |
| Veto Counter | 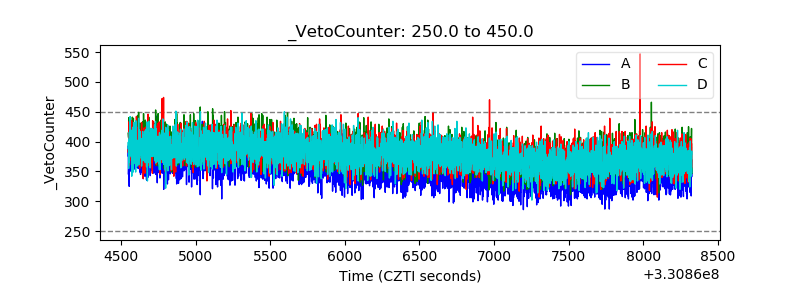 |