| Param | Original file | Final file |
|---|---|---|
| Filename | modeM0/AS1A09_006T04_9000003738cztM0_level2.fits | modeM0/AS1A09_006T04_9000003738cztM0_level2_quad_clean.evt |
| Size (bytes) | 197,331,840 | 60,641,280 |
| Size | 188.2 MB | 57.8 MB |
| Events in quadrant A | 1,263,682 | 156,995 |
| Events in quadrant B | 1,221,902 | 159,911 |
| Events in quadrant C | 1,205,750 | 148,450 |
| Events in quadrant D | 1,049,958 | 132,697 |
| Mode M0 | |||
|---|---|---|---|
| Quadrant | BADHDUFLAG | Total packets | Discarded packets |
| A | 0 | 42653 | 0 |
| B | 0 | 38548 | 0 |
| C | 0 | 38277 | 0 |
| D | 0 | 44844 | 0 |
| Mode SS | |||
|---|---|---|---|
| Quadrant | BADHDUFLAG | Total packets | Discarded packets |
| A | 0 | 366 | 0 |
| B | 0 | 366 | 0 |
| C | 0 | 366 | 0 |
| D | 0 | 366 | 0 |
| Mode M9 | |||
|---|---|---|---|
| Quadrant | BADHDUFLAG | Total packets | Discarded packets |
| A | 0 | 46 | 0 |
| B | 0 | 46 | 0 |
| C | 0 | 46 | 0 |
| D | 0 | 46 | 0 |
| Quadrant | Total seconds | Saturated seconds | Saturation percentage |
|---|---|---|---|
| A | 17932 | 55 | 0.306714% |
| B | 17932 | 70 | 0.390364% |
| C | 17932 | 163 | 0.908990% |
| D | 17932 | 225 | 1.254740% |
Noise dominated data is calculated using 1-second bins in cleaned event files. If a bin has >2000 counts, and if more than 50% of those come from <1% of pixels, then it is considered to be noise-dominated and hence unusable.
| Quadrant | # 1 sec bins | Bins with >0 counts | Bins with >2000 counts | High rate bins dominated by noise | Noise dominated (total time) | Noise dominated (detector-on time) | Marked lightcurve |
|---|---|---|---|---|---|---|---|
| A | 21842 | 17932 | 0 | 0 | 0.00% | 0.00% |  |
| B | 21842 | 17932 | 0 | 0 | 0.00% | 0.00% | 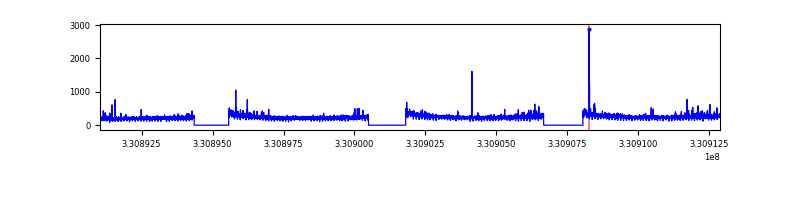 |
| C | 21842 | 17932 | 0 | 0 | 0.00% | 0.00% |  |
| D | 21842 | 17931 | 0 | 0 | 0.00% | 0.00% | 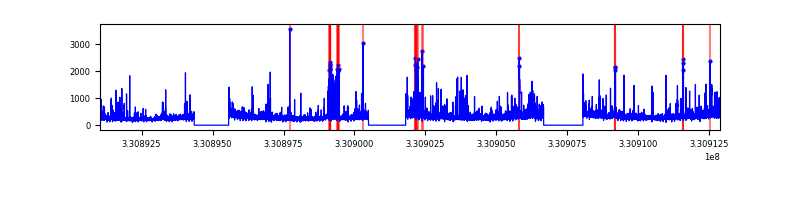 |
Top three noisy pixels from each quadrant. If the there are fewer than three noisy pixels in the level2.evt file, extra rows are filled as -1
| Pixel properties | Quadrant properties | ||||||
|---|---|---|---|---|---|---|---|
| Quadrant | DetID | PixID | Counts | Sigma | Mean | Median | Sigma |
| A | 0 | 29 | 1268 | 12.02 | 329 | 312 | 79.5 |
| A | 0 | 30 | 1015 | 8.84 | 329 | 312 | 79.5 |
| A | 7 | 110 | 965 | 8.21 | 329 | 312 | 79.5 |
| B | 2 | 9 | 960 | 9.94 | 323 | 311 | 65.3 |
| B | 5 | 255 | 816 | 7.73 | 323 | 311 | 65.3 |
| B | 2 | 8 | 787 | 7.29 | 323 | 311 | 65.3 |
| C | 12 | 241 | 853 | 6.75 | 318 | 300 | 81.9 |
| C | 1 | 80 | 846 | 6.67 | 318 | 300 | 81.9 |
| C | 1 | 81 | 831 | 6.48 | 318 | 300 | 81.9 |
| D | 15 | 46 | 803 | 6.56 | 299 | 275 | 80.5 |
| D | 10 | 189 | 750 | 5.9 | 299 | 275 | 80.5 |
| D | 6 | 67 | 742 | 5.8 | 299 | 275 | 80.5 |
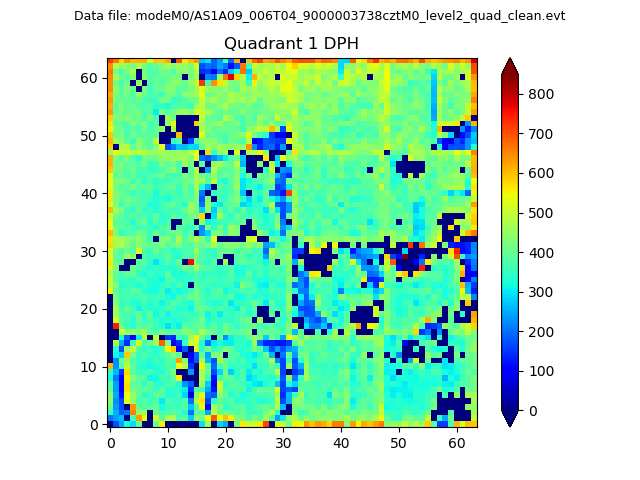
Histogram calculated using DETX and DETY for each event in the final _common_clean file
| Quadrant A |  |
 |
Quadrant B |
|---|---|---|---|
| Quadrant D | 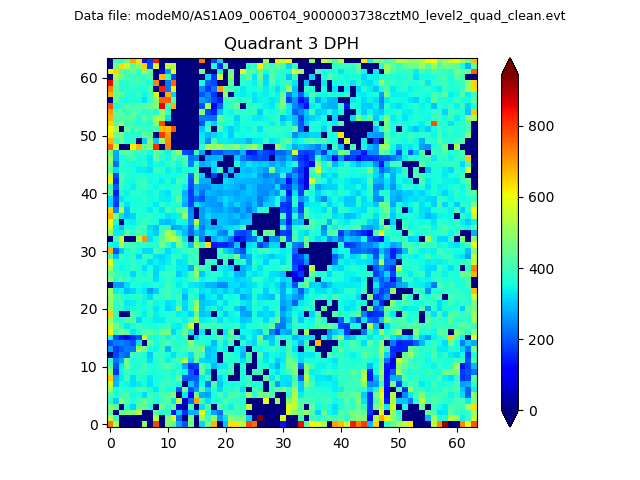 |
 |
Quadrant C |
| Plot type | Count rate plots | Images |
|---|---|---|
| Comparison with Poisson distribution Blue bars denote a histogram of data divided into 1 sec bins. Red curve is a Poisson curve with rate = median count rate of data. |
 |
 |
| Quadrant-wise count rates Data is divided into 100 sec bins |
 |
|
| Module-wise count rates for Quadrant A Data is divided into 100 sec bins |
 |
 |
| Module-wise count rates for Quadrant B Data is divided into 100 sec bins |
 |
 |
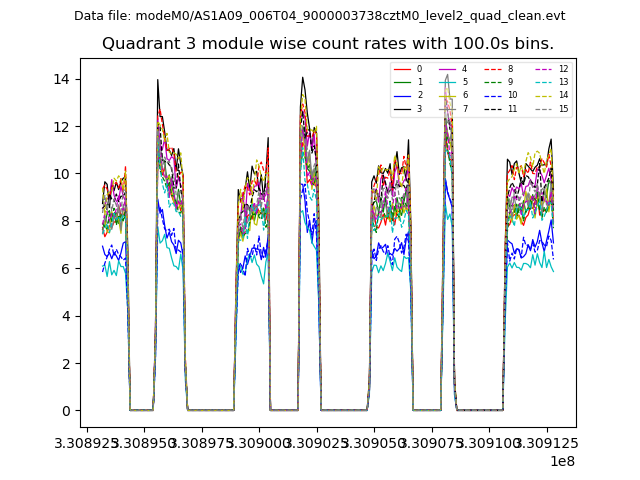
| Module-wise count rates for Quadrant C Data is divided into 100 sec bins |
 |
 |
| Module-wise count rates for Quadrant D Data is divided into 100 sec bins |
 |
 |
| Parameter | Plot |
|---|---|
| CZT HV Monitor |  |
| D_VDD | 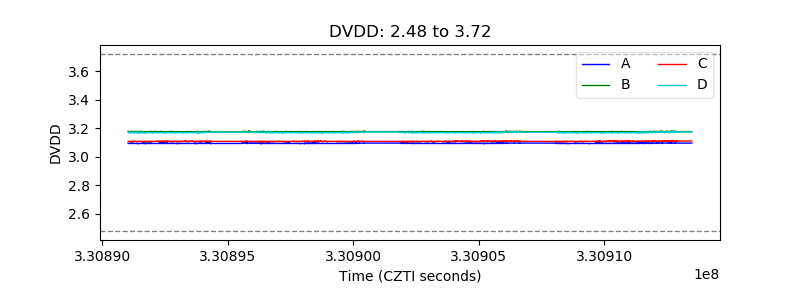 |
| Temperature 1 | 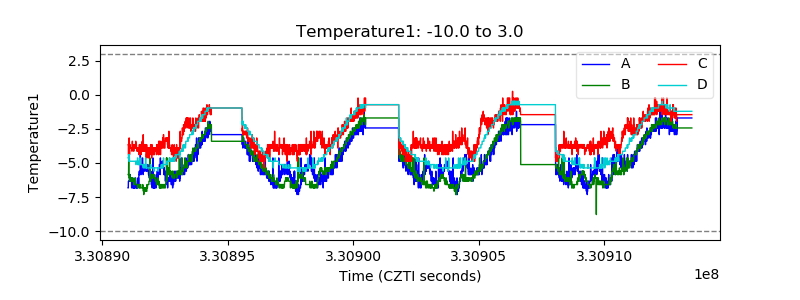 |
| Veto HV Monitor | 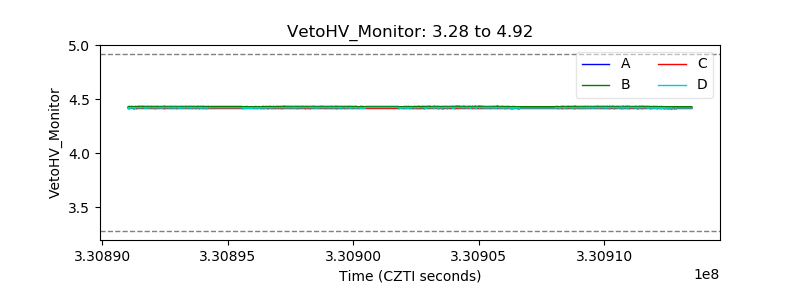 |
| Veto LLD |  |
| Alpha Counter | 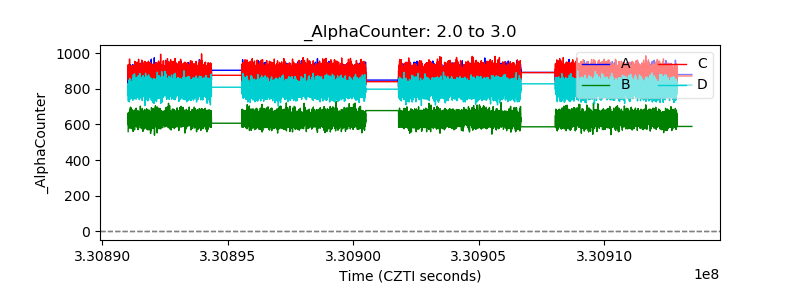 |
| _CPM_Rate |  |
| CZT Counter |  |
| +2.5 Volts monitor | 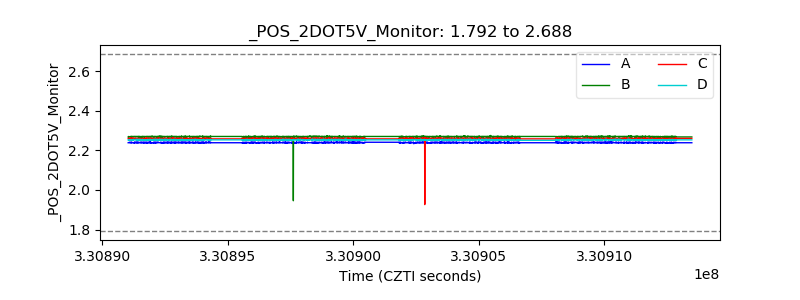 |
| +5 Volts monitor |  |
| _ROLL_ROT | 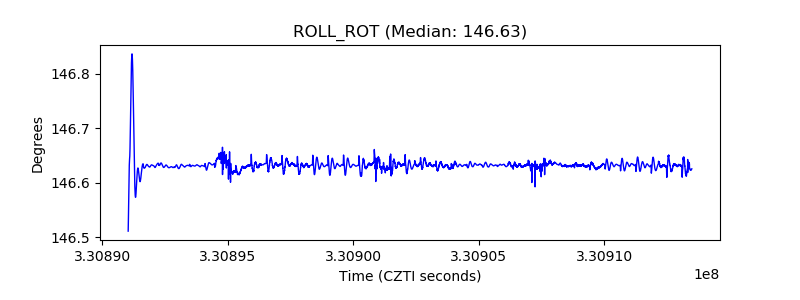 |
| _Roll_DEC | 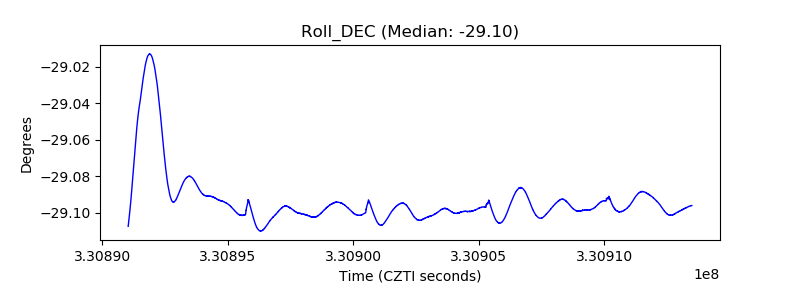 |
| _Roll_RA |  |
| Veto Counter |  |