| Param | Original file | Final file |
|---|---|---|
| Filename | modeM0/AS1A09_006T04_9000003738_25661cztM0_level2.evt | modeM0/AS1A09_006T04_9000003738_25661cztM0_level2_quad_clean.evt |
| Size (bytes) | 329,163,840 | 58,608,000 |
| Size | 313.9 MB | 55.9 MB |
| Events in quadrant A | 2,469,657 | 372,342 |
| Events in quadrant B | 2,343,026 | 383,665 |
| Events in quadrant C | 2,302,474 | 353,488 |
| Events in quadrant D | 2,540,988 | 342,587 |
| Mode M0 | |||
|---|---|---|---|
| Quadrant | BADHDUFLAG | Total packets | Discarded packets |
| A | 0 | 10009 | 0 |
| B | 0 | 9748 | 0 |
| C | 0 | 9648 | 0 |
| D | 0 | 10510 | 0 |
| Mode M9 | |||
|---|---|---|---|
| Quadrant | BADHDUFLAG | Total packets | Discarded packets |
| A | 0 | 12 | 0 |
| B | 0 | 12 | 0 |
| C | 0 | 12 | 0 |
| D | 0 | 12 | 0 |
| Quadrant | Total seconds | Saturated seconds | Saturation percentage |
|---|---|---|---|
| A | 4586 | 12 | 0.261666% |
| B | 4585 | 11 | 0.239913% |
| C | 4585 | 39 | 0.850600% |
| D | 4585 | 14 | 0.305344% |
Noise dominated data is calculated using 1-second bins in cleaned event files. If a bin has >2000 counts, and if more than 50% of those come from <1% of pixels, then it is considered to be noise-dominated and hence unusable.
| Quadrant | # 1 sec bins | Bins with >0 counts | Bins with >2000 counts | High rate bins dominated by noise | Noise dominated (total time) | Noise dominated (detector-on time) | Marked lightcurve |
|---|---|---|---|---|---|---|---|
| A | 5801 | 4587 | 0 | 0 | 0.00% | 0.00% | 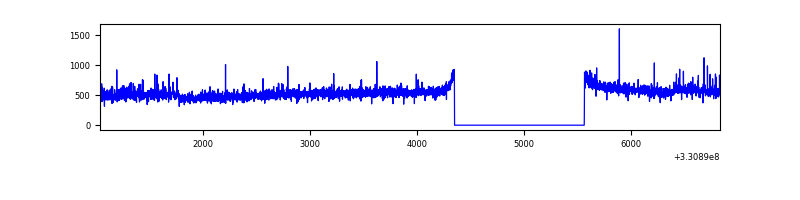 |
| B | 5800 | 4586 | 0 | 0 | 0.00% | 0.00% | 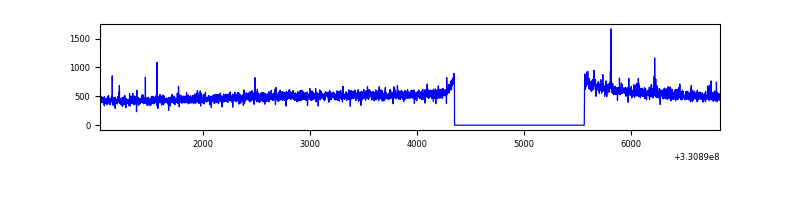 |
| C | 5800 | 4586 | 0 | 0 | 0.00% | 0.00% | 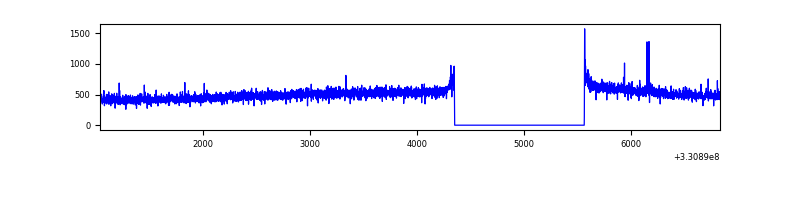 |
| D | 5800 | 4586 | 11 | 11 | 0.19% | 0.24% | 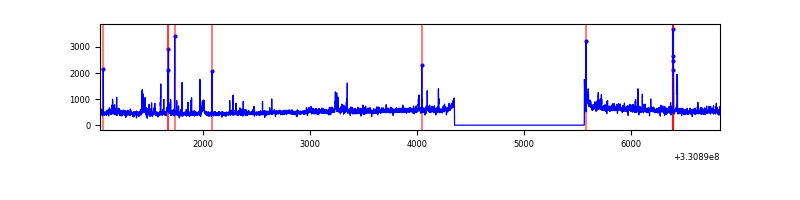 |
Top three noisy pixels from each quadrant. If the there are fewer than three noisy pixels in the level2.evt file, extra rows are filled as -1
| Pixel properties | Quadrant properties | ||||||
|---|---|---|---|---|---|---|---|
| Quadrant | DetID | PixID | Counts | Sigma | Mean | Median | Sigma |
| A | 8 | 192 | 179884 | 1507.12 | 592 | 582 | 119.0 |
| A | 6 | 16 | 8370 | 65.46 | 592 | 582 | 119.0 |
| A | 13 | 254 | 6643 | 50.95 | 592 | 582 | 119.0 |
| B | 0 | 245 | 13932 | 118.82 | 590 | 577 | 112.4 |
| B | 12 | 111 | 13788 | 117.53 | 590 | 577 | 112.4 |
| B | 11 | 111 | 12323 | 104.5 | 590 | 577 | 112.4 |
| C | 14 | 238 | 92685 | 706.28 | 559 | 564 | 130.4 |
| C | 3 | 233 | 26067 | 195.53 | 559 | 564 | 130.4 |
| C | 2 | 16 | 5404 | 37.11 | 559 | 564 | 130.4 |
| D | 1 | 52 | 230363 | 1676.59 | 563 | 548 | 137.1 |
| D | 8 | 195 | 152072 | 1105.42 | 563 | 548 | 137.1 |
| D | 13 | 104 | 18465 | 130.71 | 563 | 548 | 137.1 |
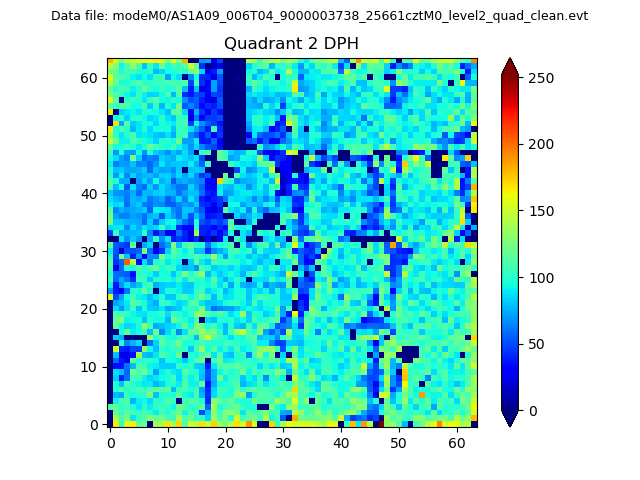
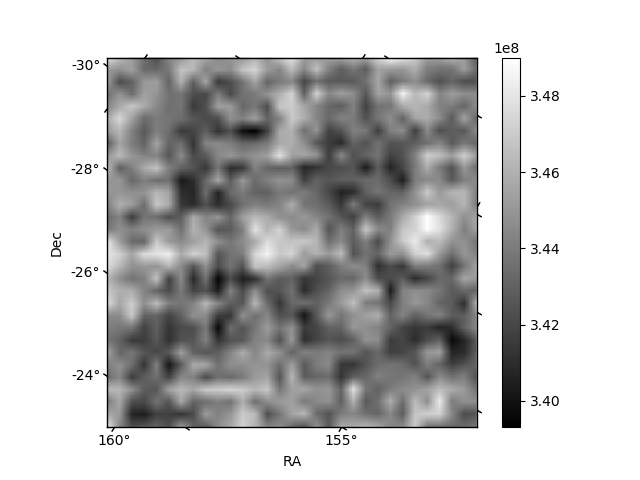
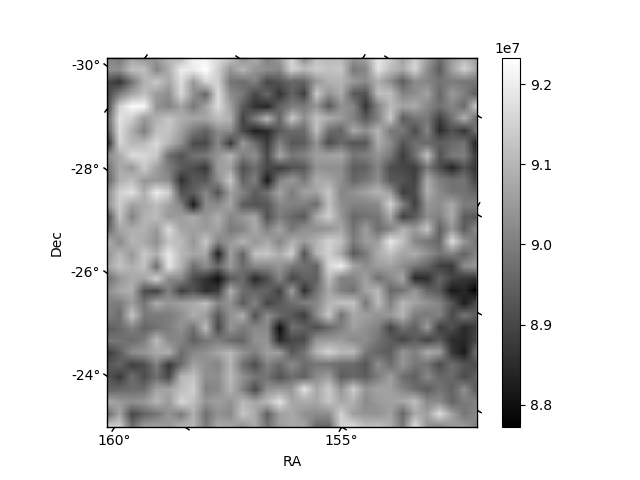
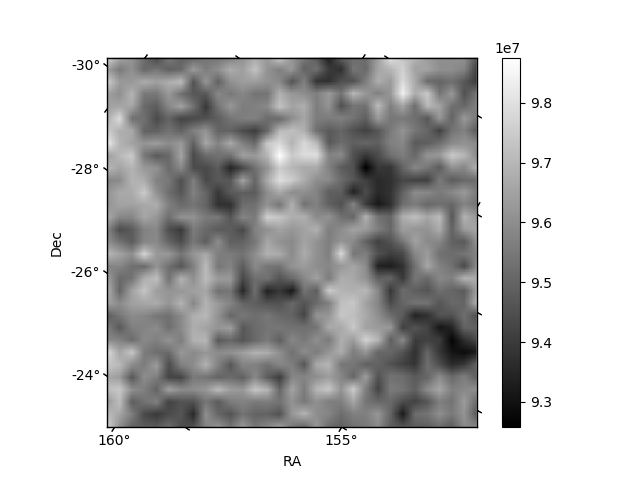
Histogram calculated using DETX and DETY for each event in the final _common_clean file
| Quadrant A | 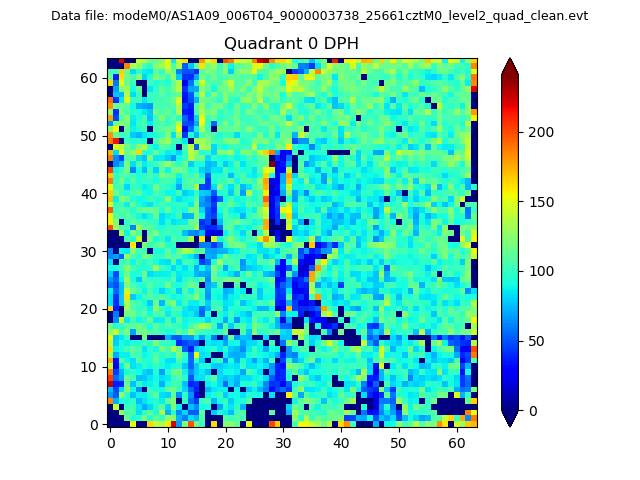 |
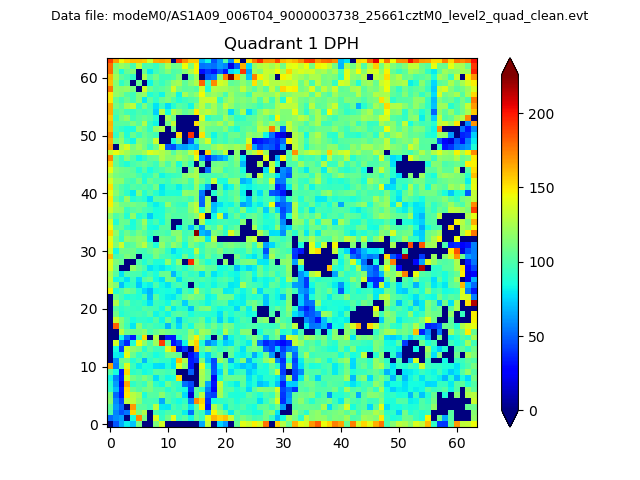 |
Quadrant B |
|---|---|---|---|
| Quadrant D | 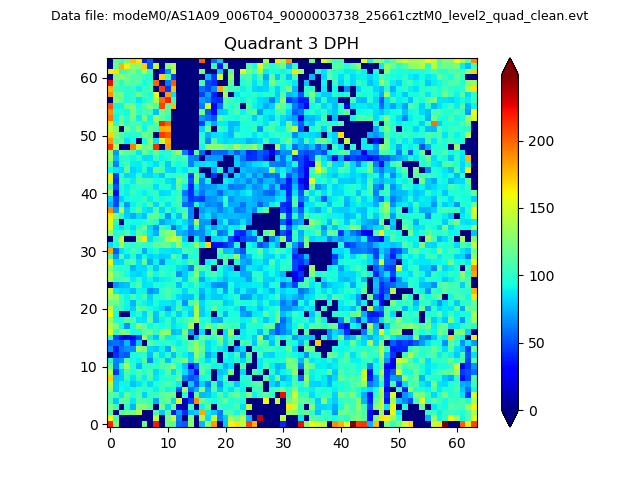 |
 |
Quadrant C |
| Plot type | Count rate plots | Images |
|---|---|---|
| Comparison with Poisson distribution Blue bars denote a histogram of data divided into 1 sec bins. Red curve is a Poisson curve with rate = median count rate of data. |
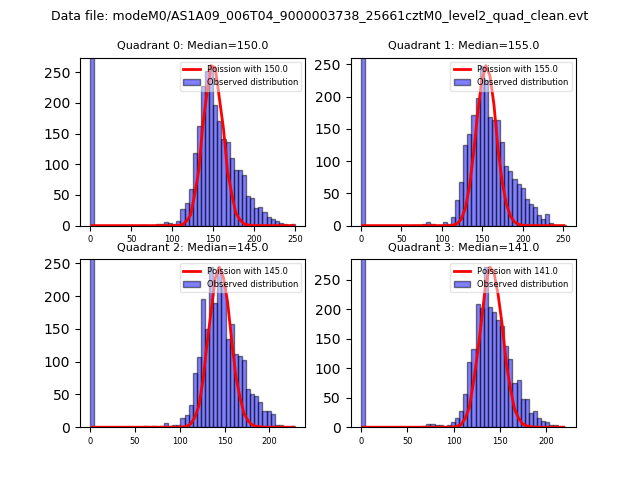 |
 |
| Quadrant-wise count rates Data is divided into 100 sec bins |
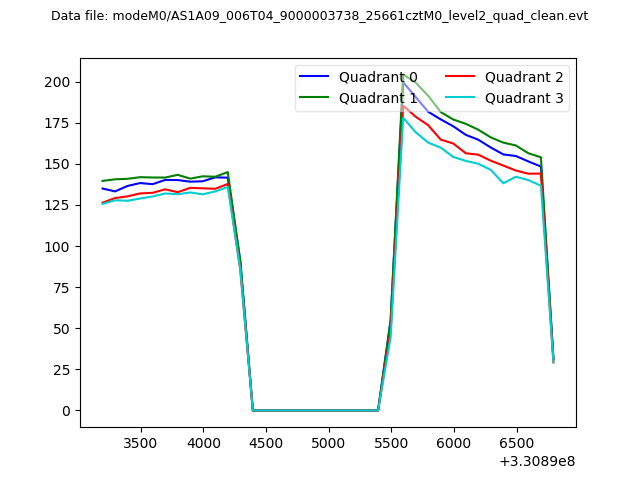 |
|
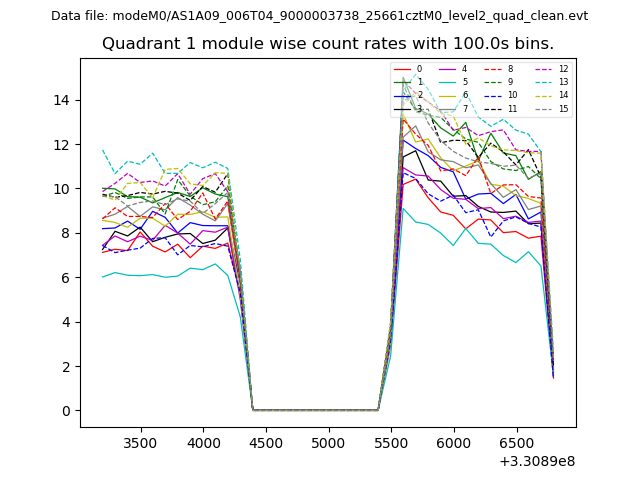
| Module-wise count rates for Quadrant A Data is divided into 100 sec bins |
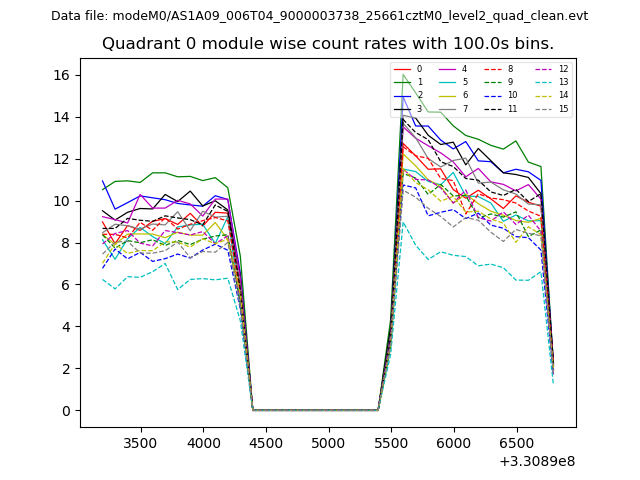 |
 |
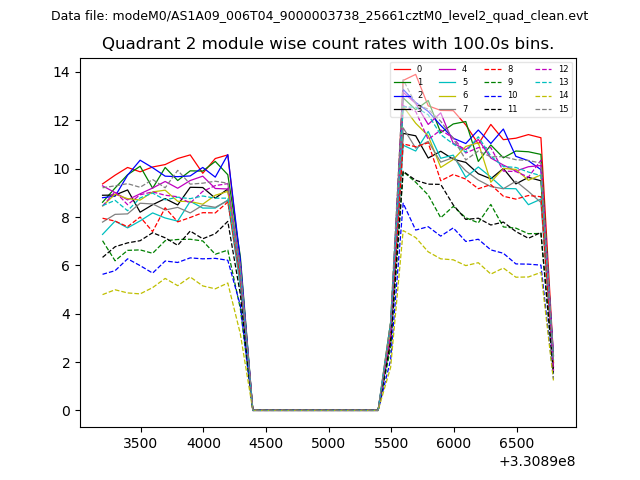
| Module-wise count rates for Quadrant B Data is divided into 100 sec bins |
 |
 |
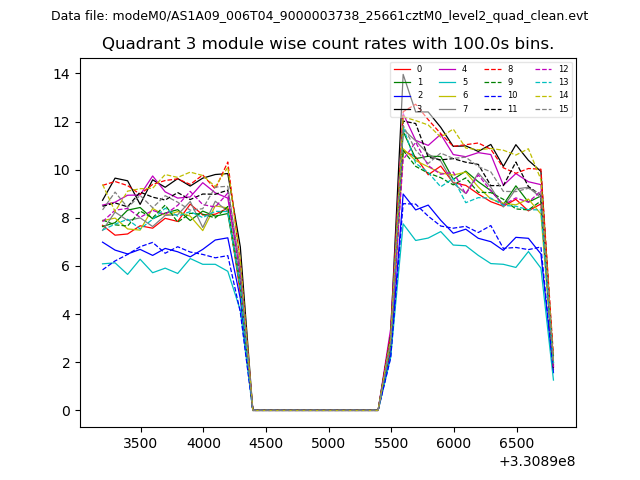
| Module-wise count rates for Quadrant C Data is divided into 100 sec bins |
 |
 |
| Module-wise count rates for Quadrant D Data is divided into 100 sec bins |
 |
 |
| Parameter | Plot |
|---|---|
| CZT HV Monitor | 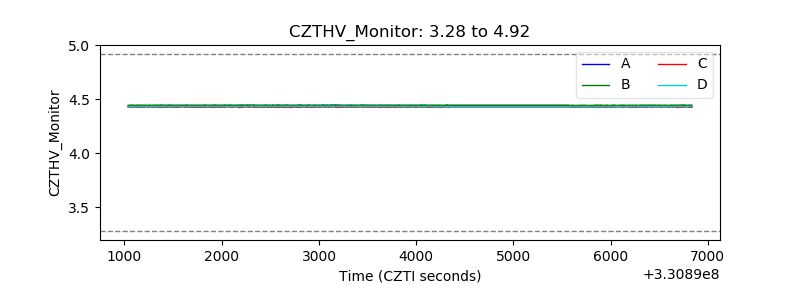 |
| D_VDD | 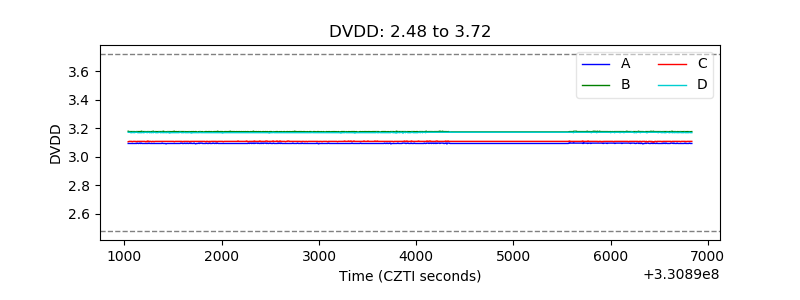 |
| Temperature 1 | 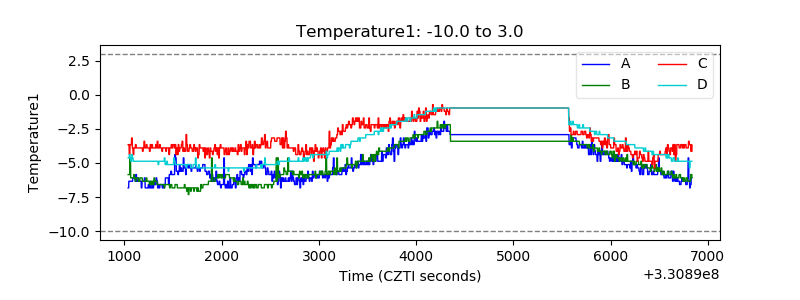 |
| Veto HV Monitor | 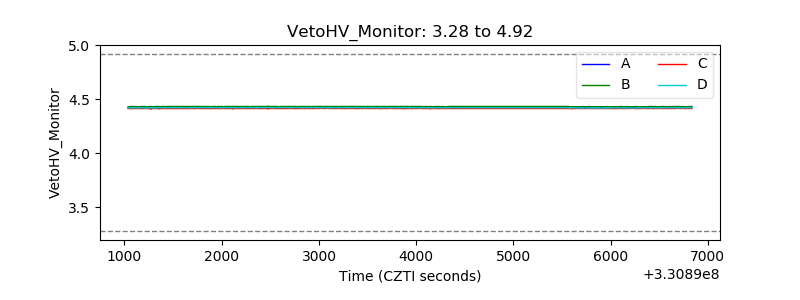 |
| Veto LLD | 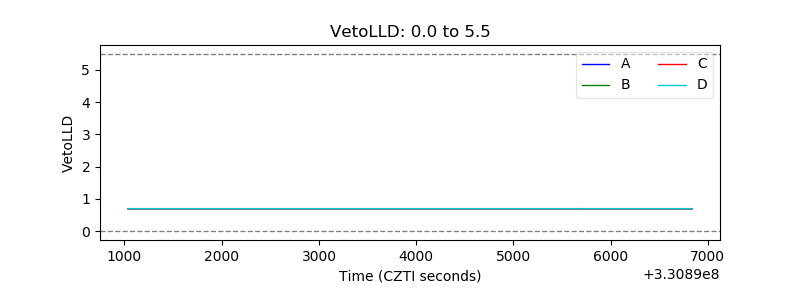 |
| Alpha Counter |  |
| _CPM_Rate |  |
| CZT Counter | 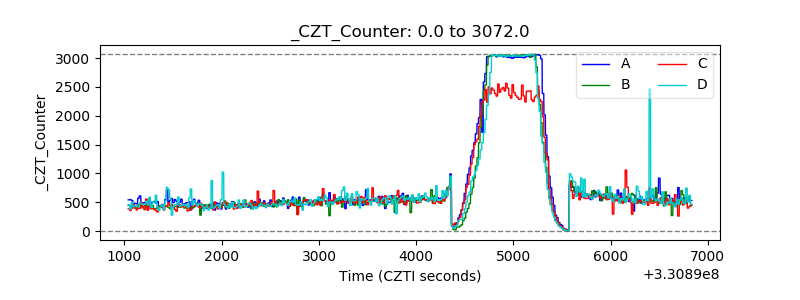 |
| +2.5 Volts monitor |  |
| +5 Volts monitor |  |
| _ROLL_ROT | 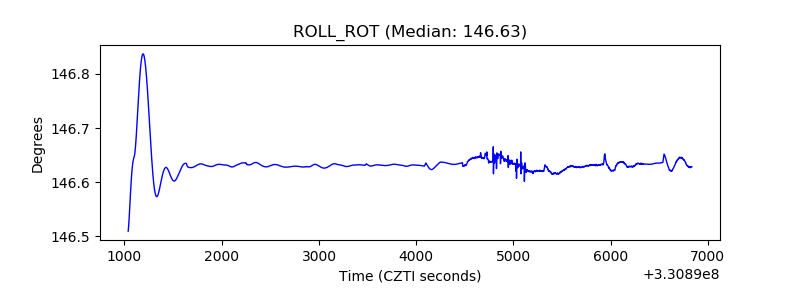 |
| _Roll_DEC | 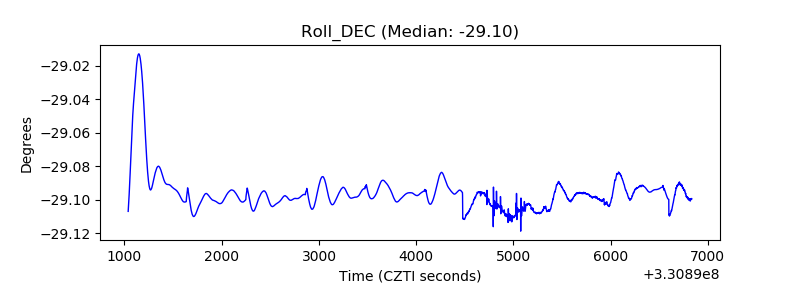 |
| _Roll_RA | 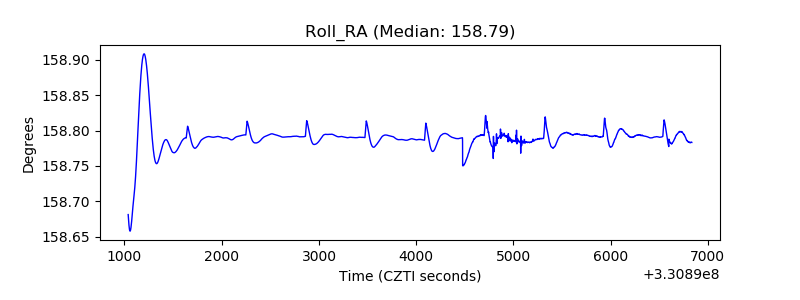 |
| Veto Counter | 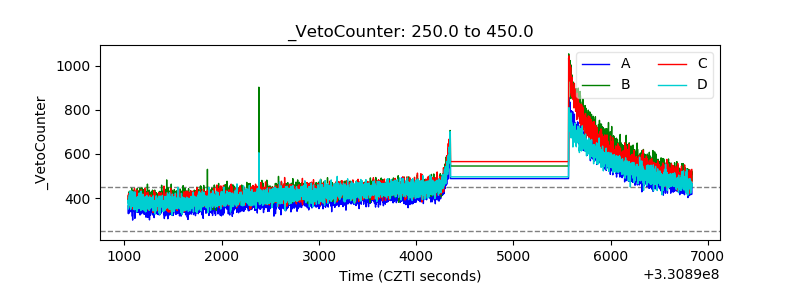 |