| Param | Original file | Final file |
|---|---|---|
| Filename | modeM0/AS1A09_006T04_9000003738_25662cztM0_level2.evt | modeM0/AS1A09_006T04_9000003738_25662cztM0_level2_quad_clean.evt |
| Size (bytes) | 480,510,720 | 88,871,040 |
| Size | 458.3 MB | 84.8 MB |
| Events in quadrant A | 3,690,230 | 582,095 |
| Events in quadrant B | 3,271,176 | 601,205 |
| Events in quadrant C | 3,220,234 | 554,267 |
| Events in quadrant D | 3,955,965 | 527,007 |
| Mode M0 | |||
|---|---|---|---|
| Quadrant | BADHDUFLAG | Total packets | Discarded packets |
| A | 0 | 15171 | 0 |
| B | 0 | 13376 | 0 |
| C | 0 | 13202 | 0 |
| D | 0 | 15765 | 0 |
| Mode M9 | |||
|---|---|---|---|
| Quadrant | BADHDUFLAG | Total packets | Discarded packets |
| A | 0 | 21 | 0 |
| B | 0 | 22 | 0 |
| C | 0 | 22 | 0 |
| D | 0 | 22 | 0 |
| Quadrant | Total seconds | Saturated seconds | Saturation percentage |
|---|---|---|---|
| A | 6108 | 12 | 0.196464% |
| B | 6108 | 17 | 0.278324% |
| C | 6108 | 47 | 0.769483% |
| D | 6108 | 120 | 1.964637% |
Noise dominated data is calculated using 1-second bins in cleaned event files. If a bin has >2000 counts, and if more than 50% of those come from <1% of pixels, then it is considered to be noise-dominated and hence unusable.
| Quadrant | # 1 sec bins | Bins with >0 counts | Bins with >2000 counts | High rate bins dominated by noise | Noise dominated (total time) | Noise dominated (detector-on time) | Marked lightcurve |
|---|---|---|---|---|---|---|---|
| A | 7418 | 6109 | 1 | 1 | 0.01% | 0.02% | 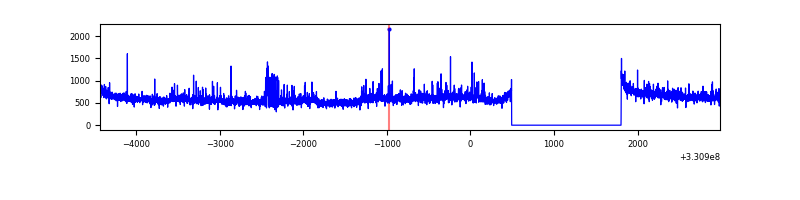 |
| B | 7418 | 6109 | 0 | 0 | 0.00% | 0.00% | 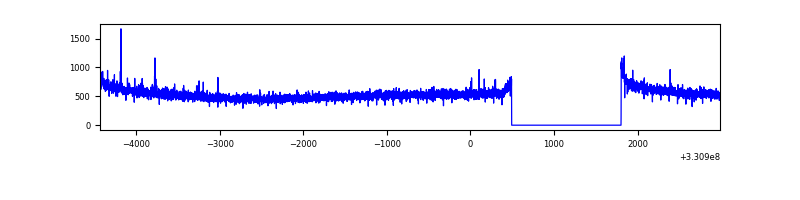 |
| C | 7418 | 6109 | 1 | 1 | 0.01% | 0.02% | 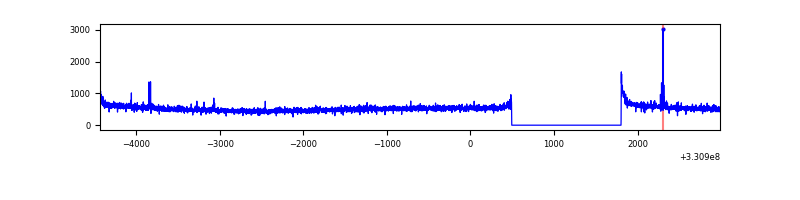 |
| D | 7418 | 6109 | 107 | 107 | 1.44% | 1.75% | 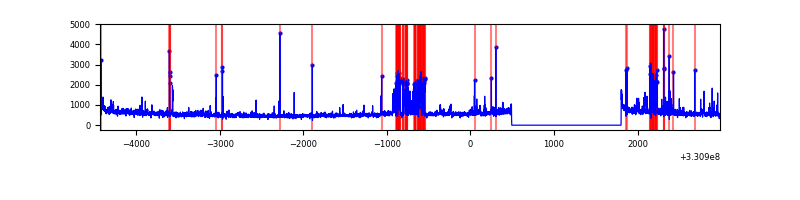 |
Top three noisy pixels from each quadrant. If the there are fewer than three noisy pixels in the level2.evt file, extra rows are filled as -1
| Pixel properties | Quadrant properties | ||||||
|---|---|---|---|---|---|---|---|
| Quadrant | DetID | PixID | Counts | Sigma | Mean | Median | Sigma |
| A | 8 | 192 | 486467 | 2936.9 | 828 | 817 | 165.4 |
| A | 6 | 16 | 14682 | 83.85 | 828 | 817 | 165.4 |
| A | 13 | 254 | 9556 | 52.85 | 828 | 817 | 165.4 |
| B | 12 | 111 | 18326 | 112.38 | 829 | 811 | 155.9 |
| B | 0 | 245 | 16429 | 100.21 | 829 | 811 | 155.9 |
| B | 11 | 111 | 16409 | 100.08 | 829 | 811 | 155.9 |
| C | 14 | 238 | 127256 | 701.27 | 780 | 788 | 180.3 |
| C | 3 | 233 | 29885 | 161.34 | 780 | 788 | 180.3 |
| C | 5 | 112 | 11873 | 61.47 | 780 | 788 | 180.3 |
| D | 1 | 52 | 775999 | 4112.02 | 777 | 756 | 188.5 |
| D | 8 | 195 | 201776 | 1066.24 | 777 | 756 | 188.5 |
| D | 13 | 104 | 29114 | 150.42 | 777 | 756 | 188.5 |
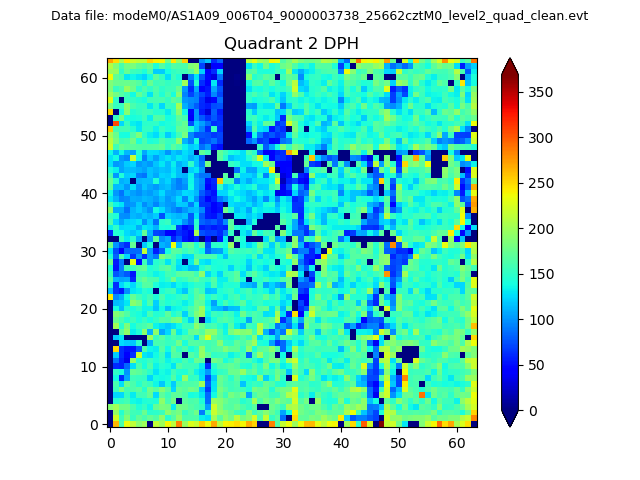
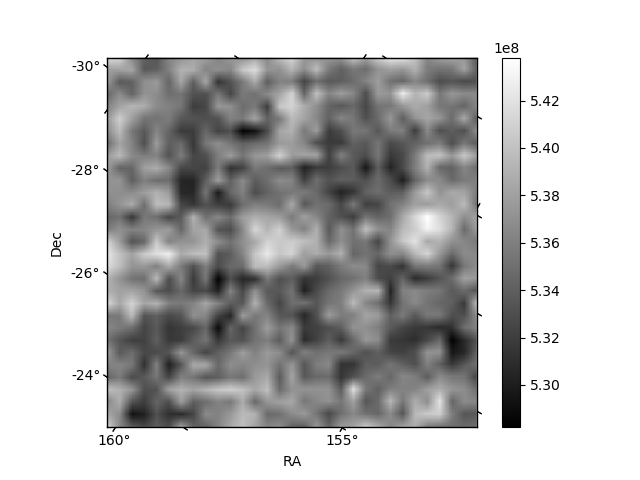
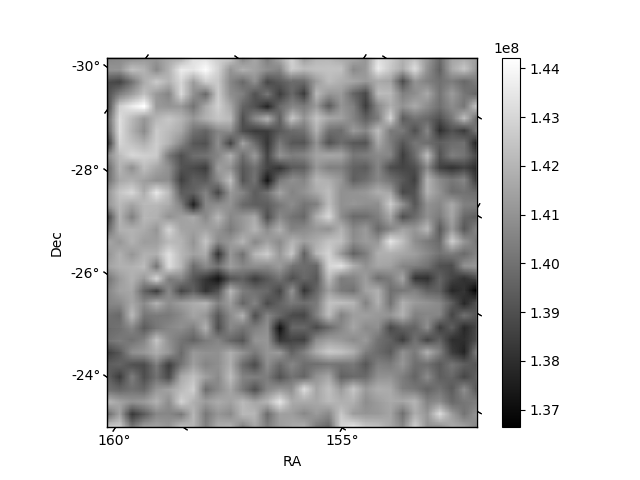
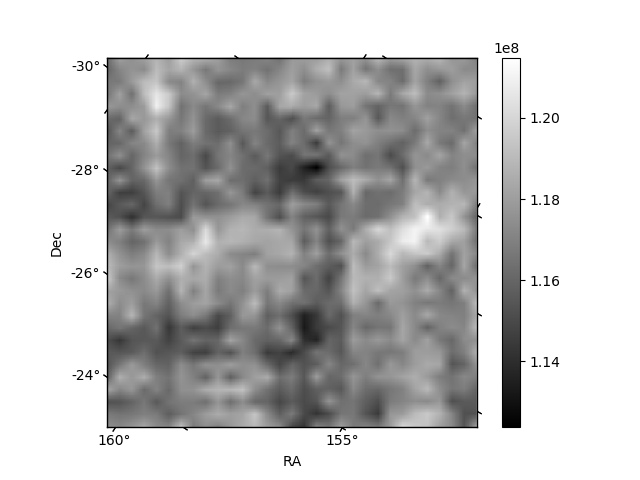
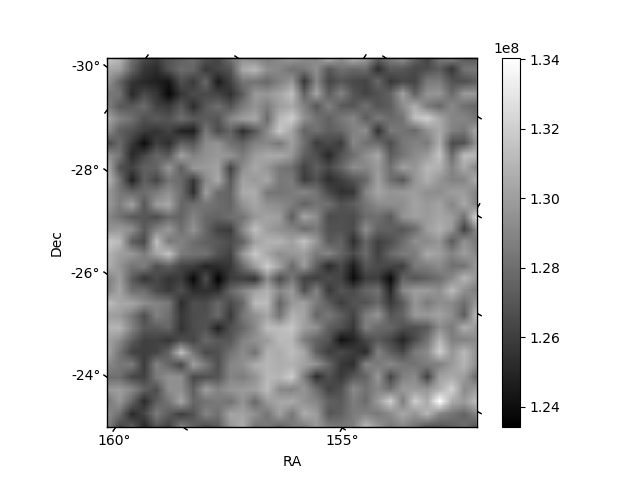
Histogram calculated using DETX and DETY for each event in the final _common_clean file
| Quadrant A | 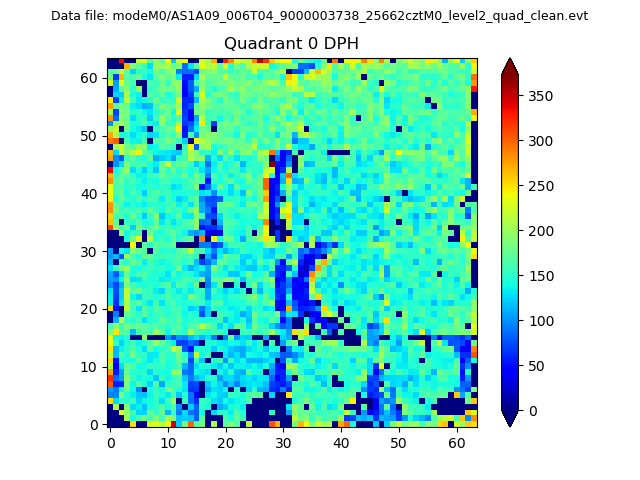 |
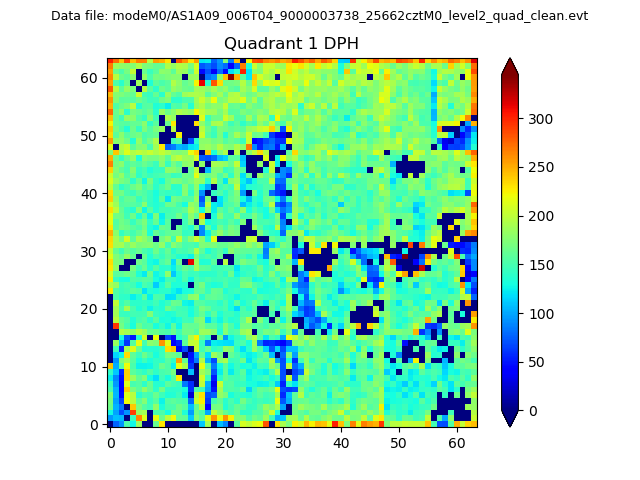 |
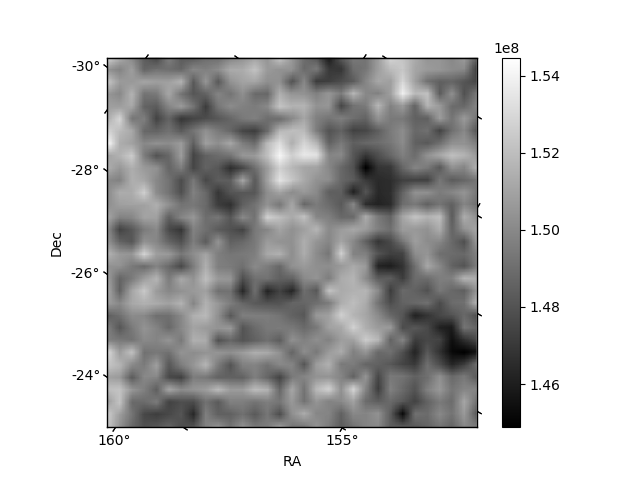
Quadrant B |
|---|---|---|---|
| Quadrant D | 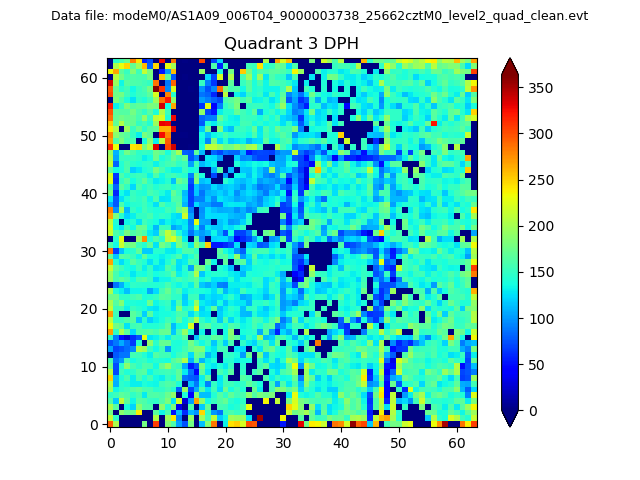 |
 |
Quadrant C |
| Plot type | Count rate plots | Images |
|---|---|---|
| Comparison with Poisson distribution Blue bars denote a histogram of data divided into 1 sec bins. Red curve is a Poisson curve with rate = median count rate of data. |
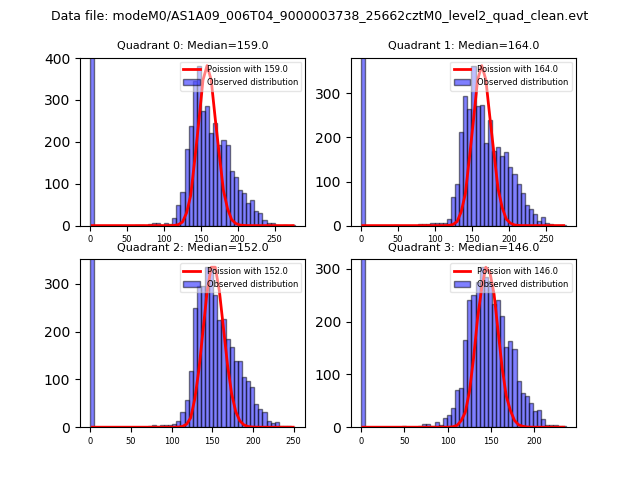 |
 |
| Quadrant-wise count rates Data is divided into 100 sec bins |
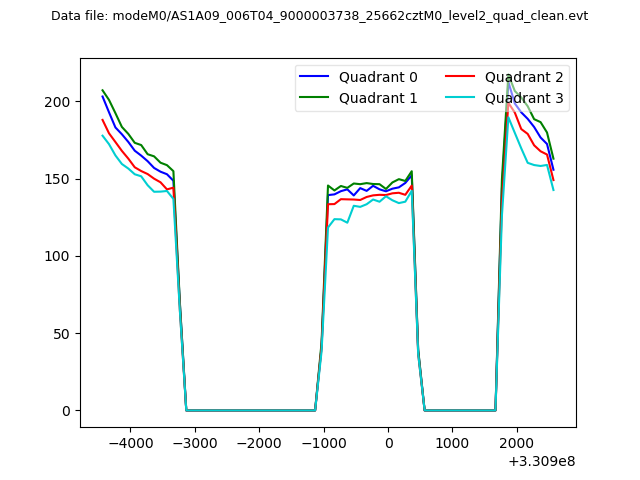 |
|
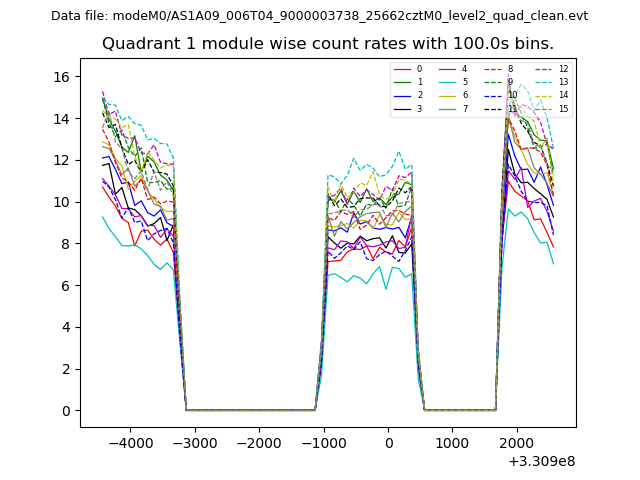
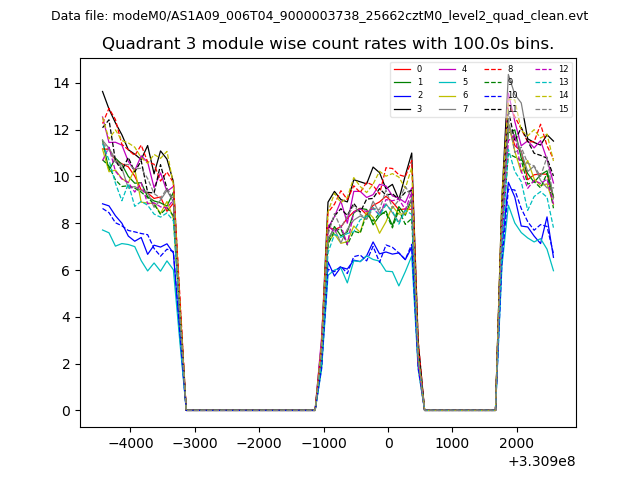
| Module-wise count rates for Quadrant A Data is divided into 100 sec bins |
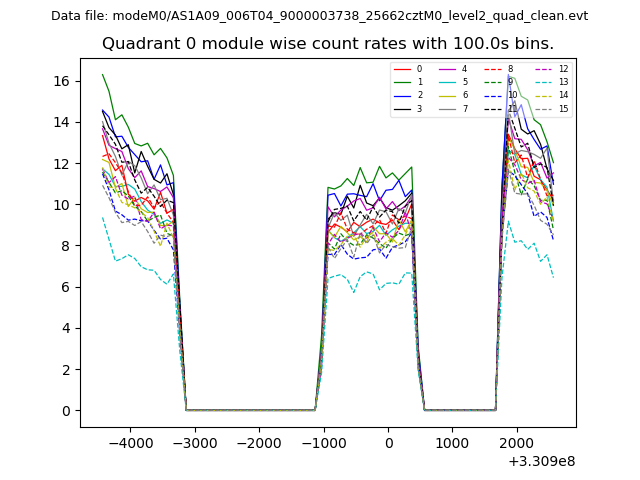 |
 |
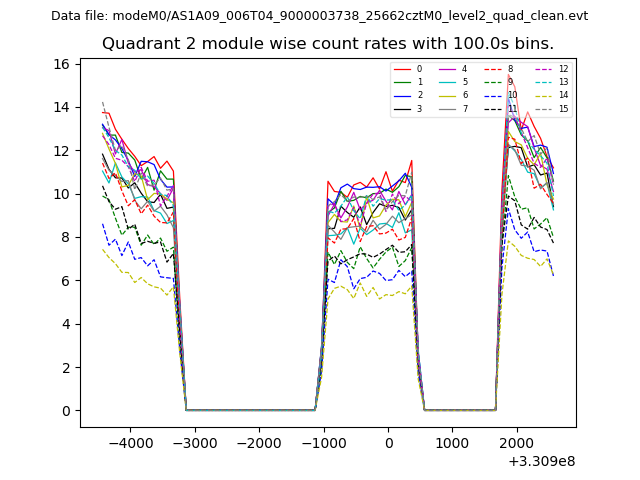
| Module-wise count rates for Quadrant B Data is divided into 100 sec bins |
 |
 |
| Module-wise count rates for Quadrant C Data is divided into 100 sec bins |
 |
 |
| Module-wise count rates for Quadrant D Data is divided into 100 sec bins |
 |
 |
| Parameter | Plot |
|---|---|
| CZT HV Monitor | 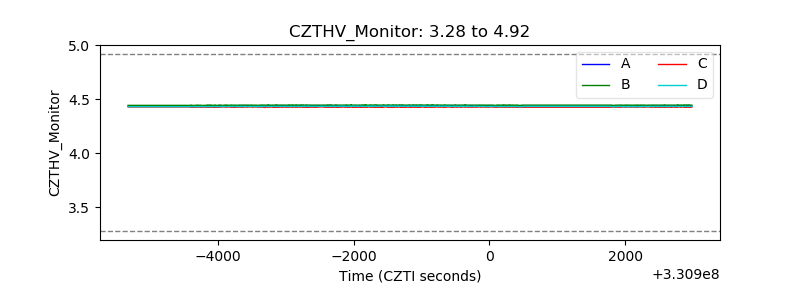 |
| D_VDD | 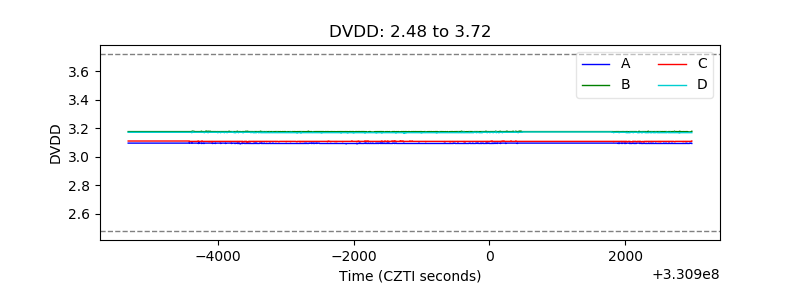 |
| Temperature 1 | 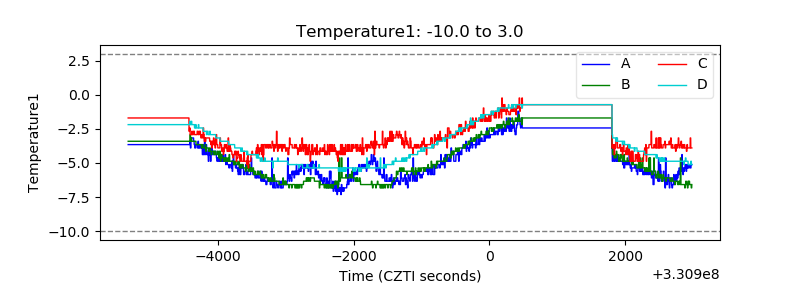 |
| Veto HV Monitor | 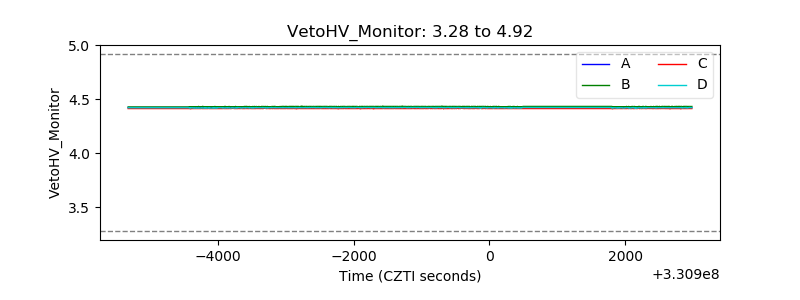 |
| Veto LLD | 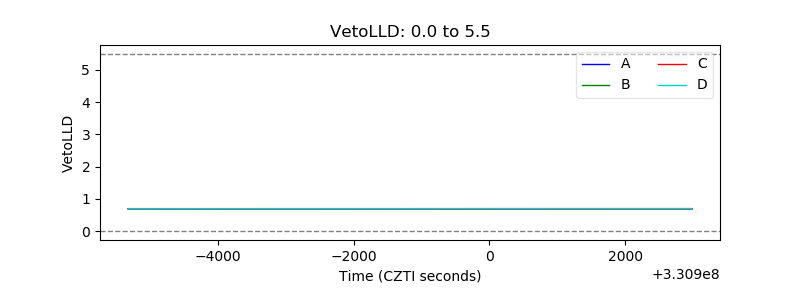 |
| Alpha Counter |  |
| _CPM_Rate |  |
| CZT Counter | 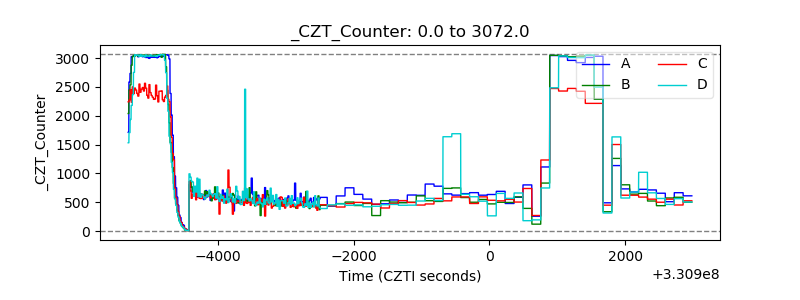 |
| +2.5 Volts monitor |  |
| +5 Volts monitor |  |
| _ROLL_ROT | 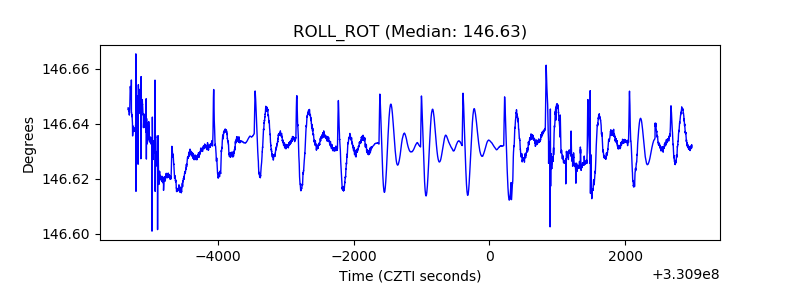 |
| _Roll_DEC | 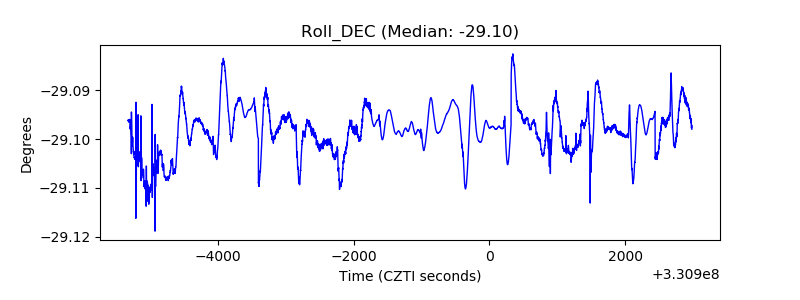 |
| _Roll_RA | 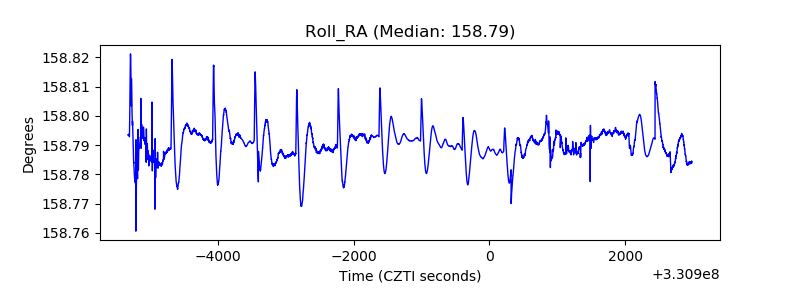 |
| Veto Counter | 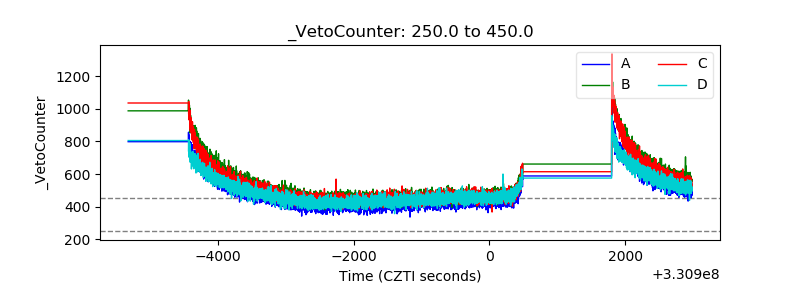 |