| Param | Original file | Final file |
|---|---|---|
| Filename | modeM0/AS1A09_006T04_9000003738_25664cztM0_level2.evt | modeM0/AS1A09_006T04_9000003738_25664cztM0_level2_quad_clean.evt |
| Size (bytes) | 382,014,720 | 65,050,560 |
| Size | 364.3 MB | 62.0 MB |
| Events in quadrant A | 2,807,841 | 418,214 |
| Events in quadrant B | 2,687,152 | 428,121 |
| Events in quadrant C | 2,623,741 | 399,217 |
| Events in quadrant D | 3,122,280 | 385,173 |
| Mode M0 | |||
|---|---|---|---|
| Quadrant | BADHDUFLAG | Total packets | Discarded packets |
| A | 0 | 11350 | 0 |
| B | 0 | 10714 | 0 |
| C | 0 | 10444 | 0 |
| D | 0 | 12493 | 0 |
| Mode M9 | |||
|---|---|---|---|
| Quadrant | BADHDUFLAG | Total packets | Discarded packets |
| A | 0 | 14 | 0 |
| B | 0 | 15 | 0 |
| C | 0 | 15 | 0 |
| D | 0 | 15 | 0 |
| Quadrant | Total seconds | Saturated seconds | Saturation percentage |
|---|---|---|---|
| A | 4830 | 18 | 0.372671% |
| B | 4830 | 29 | 0.600414% |
| C | 4830 | 45 | 0.931677% |
| D | 4830 | 63 | 1.304348% |
Noise dominated data is calculated using 1-second bins in cleaned event files. If a bin has >2000 counts, and if more than 50% of those come from <1% of pixels, then it is considered to be noise-dominated and hence unusable.
| Quadrant | # 1 sec bins | Bins with >0 counts | Bins with >2000 counts | High rate bins dominated by noise | Noise dominated (total time) | Noise dominated (detector-on time) | Marked lightcurve |
|---|---|---|---|---|---|---|---|
| A | 4830 | 4830 | 1 | 1 | 0.02% | 0.02% | 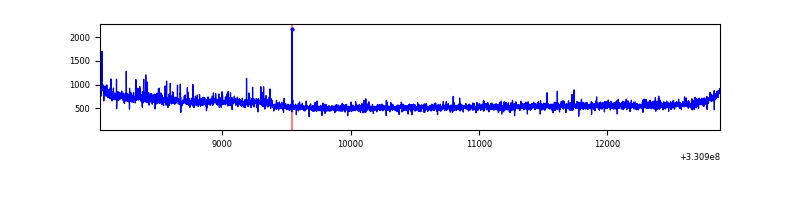 |
| B | 4830 | 4830 | 5 | 5 | 0.10% | 0.10% | 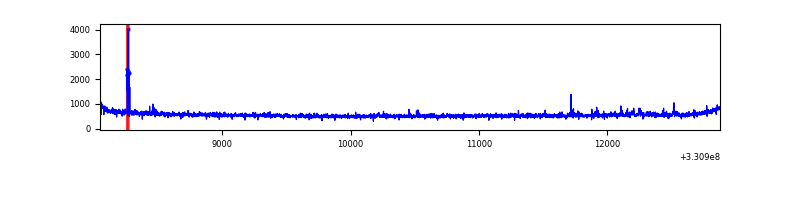 |
| C | 4830 | 4830 | 0 | 0 | 0.00% | 0.00% | 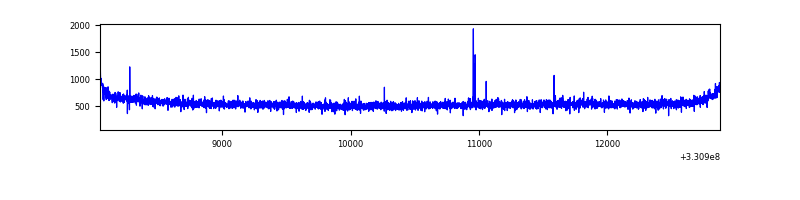 |
| D | 4830 | 4830 | 37 | 37 | 0.77% | 0.77% | 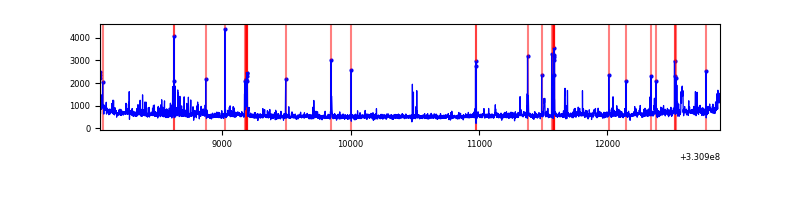 |
Top three noisy pixels from each quadrant. If the there are fewer than three noisy pixels in the level2.evt file, extra rows are filled as -1
| Pixel properties | Quadrant properties | ||||||
|---|---|---|---|---|---|---|---|
| Quadrant | DetID | PixID | Counts | Sigma | Mean | Median | Sigma |
| A | 8 | 192 | 199134 | 1478.42 | 673 | 664 | 134.2 |
| A | 12 | 96 | 11530 | 80.94 | 673 | 664 | 134.2 |
| A | 13 | 254 | 7035 | 47.46 | 673 | 664 | 134.2 |
| B | 0 | 245 | 32121 | 250.57 | 671 | 656 | 125.6 |
| B | 0 | 229 | 19043 | 146.43 | 671 | 656 | 125.6 |
| B | 12 | 111 | 14652 | 111.46 | 671 | 656 | 125.6 |
| C | 14 | 238 | 105194 | 702.32 | 639 | 643 | 148.9 |
| C | 3 | 233 | 15306 | 98.5 | 639 | 643 | 148.9 |
| C | 5 | 112 | 10744 | 67.85 | 639 | 643 | 148.9 |
| D | 1 | 52 | 433450 | 2791.53 | 638 | 622 | 155.1 |
| D | 8 | 195 | 205090 | 1318.72 | 638 | 622 | 155.1 |
| D | 13 | 104 | 52150 | 332.33 | 638 | 622 | 155.1 |
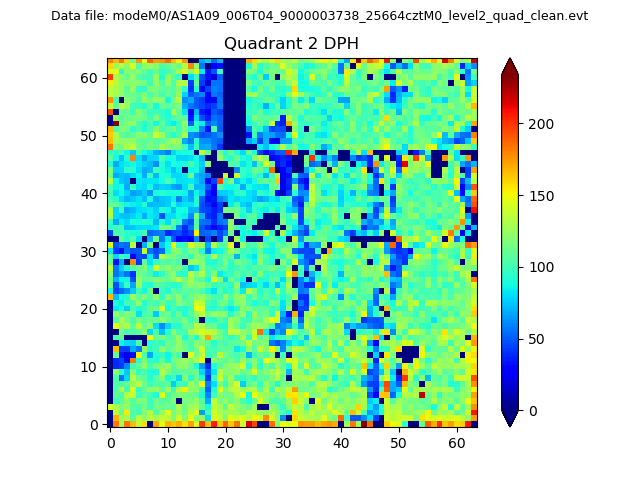
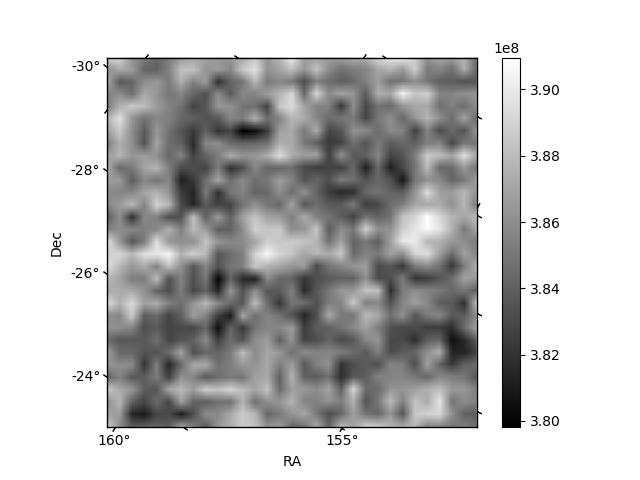
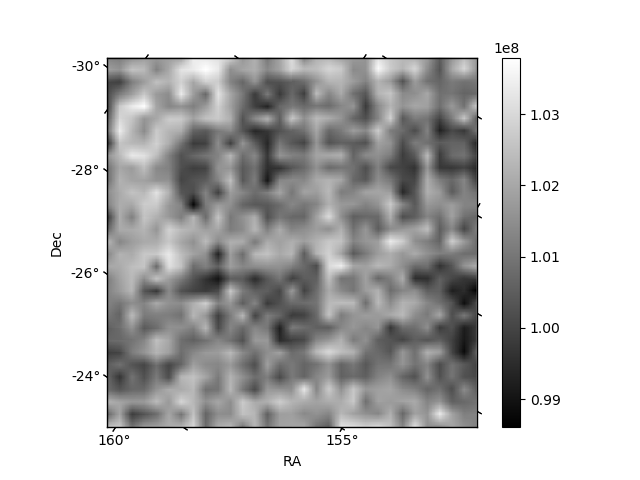
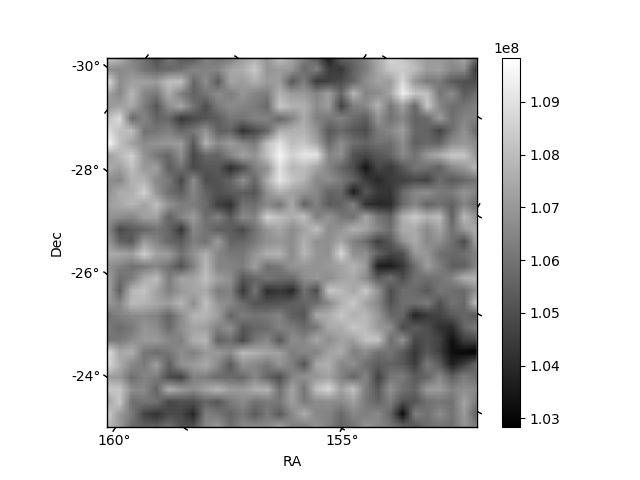
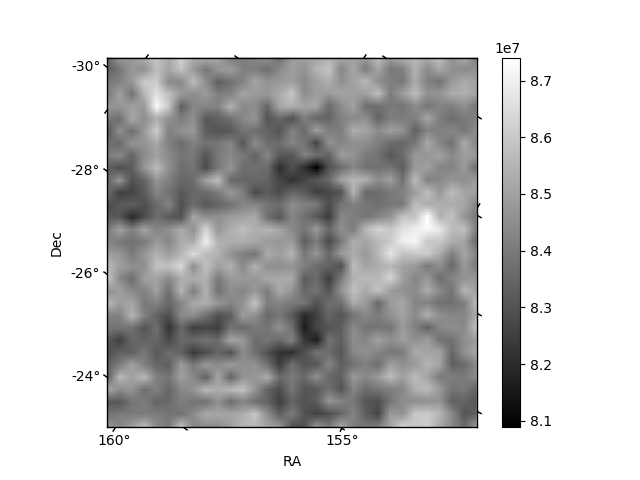
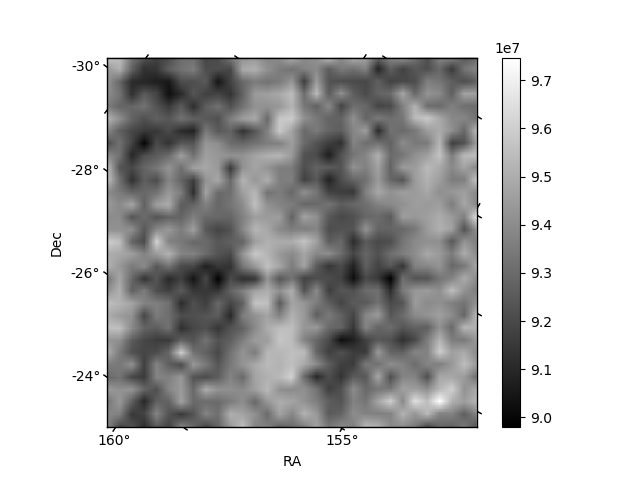
Histogram calculated using DETX and DETY for each event in the final _common_clean file
| Quadrant A | 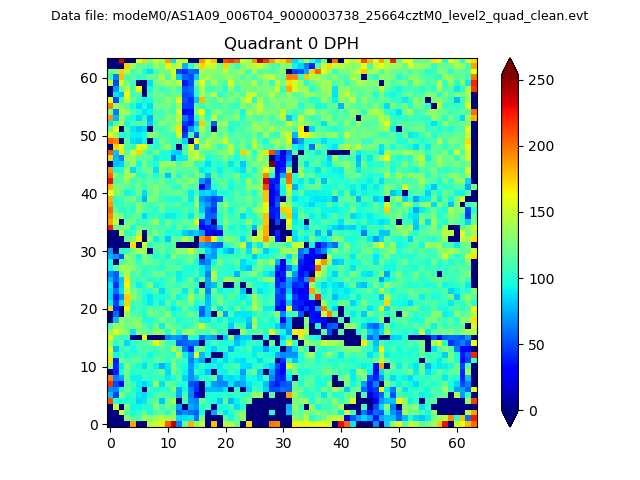 |
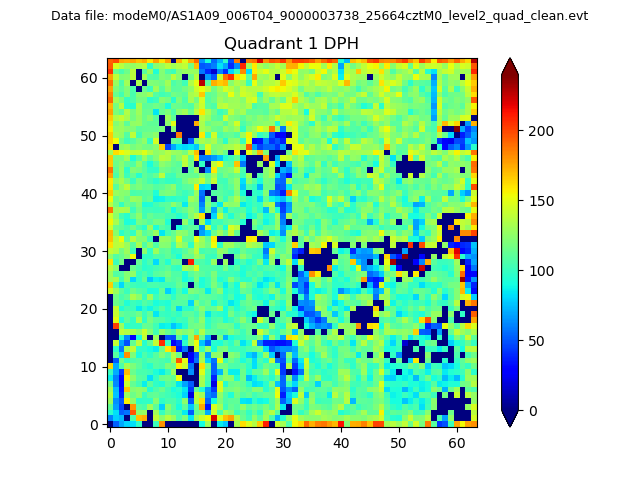 |
Quadrant B |
|---|---|---|---|
| Quadrant D | 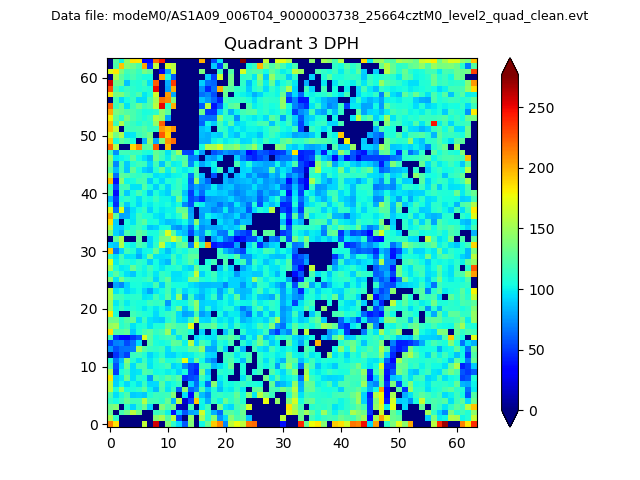 |
 |
Quadrant C |
| Plot type | Count rate plots | Images |
|---|---|---|
| Comparison with Poisson distribution Blue bars denote a histogram of data divided into 1 sec bins. Red curve is a Poisson curve with rate = median count rate of data. |
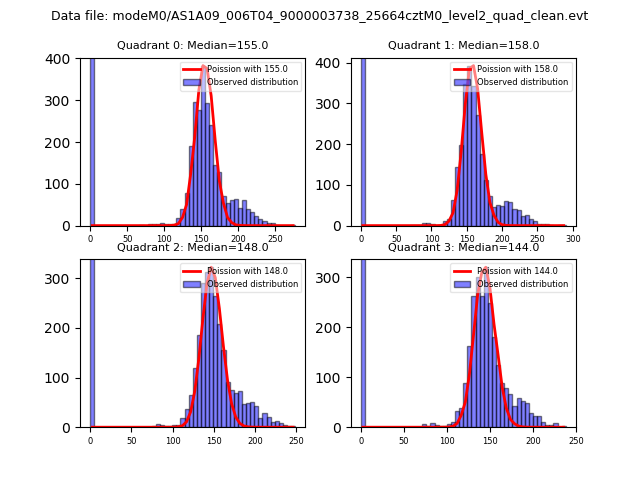 |
 |
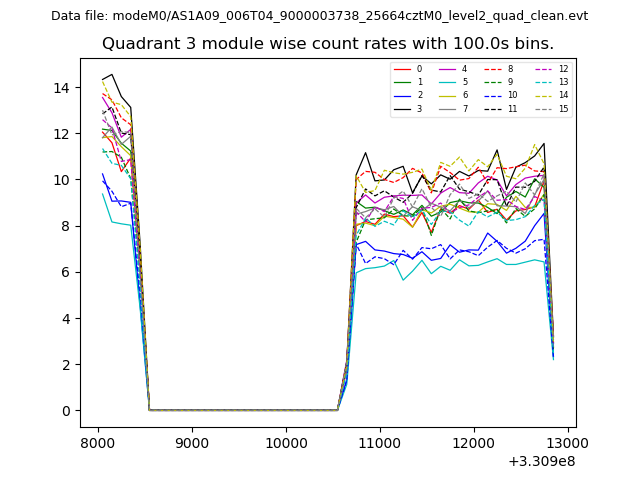
| Quadrant-wise count rates Data is divided into 100 sec bins |
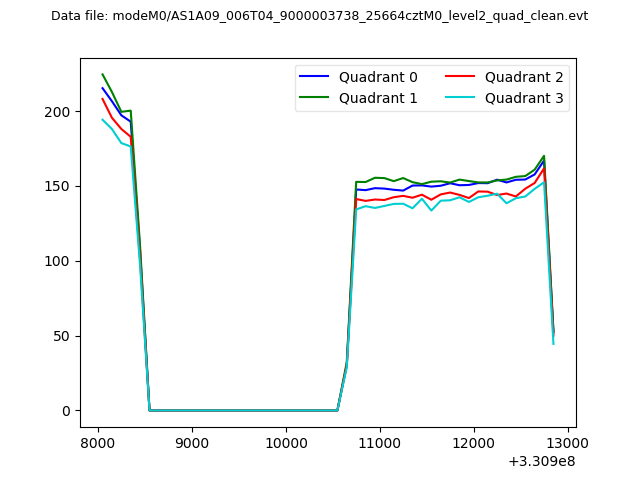 |
|
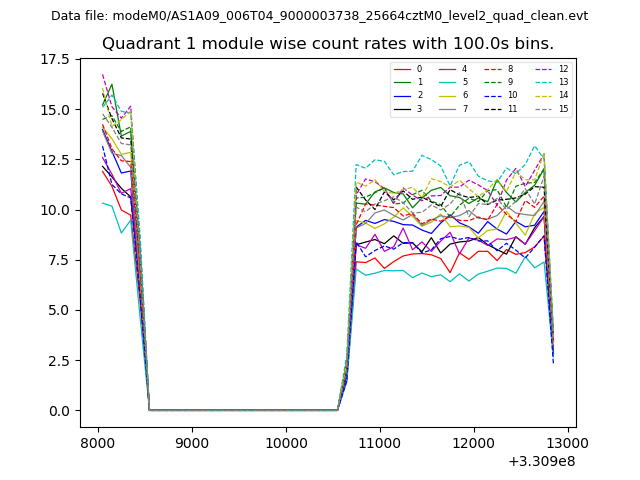
| Module-wise count rates for Quadrant A Data is divided into 100 sec bins |
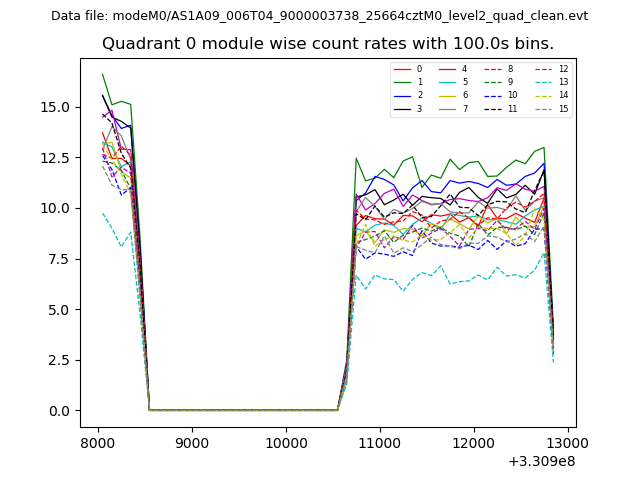 |
 |
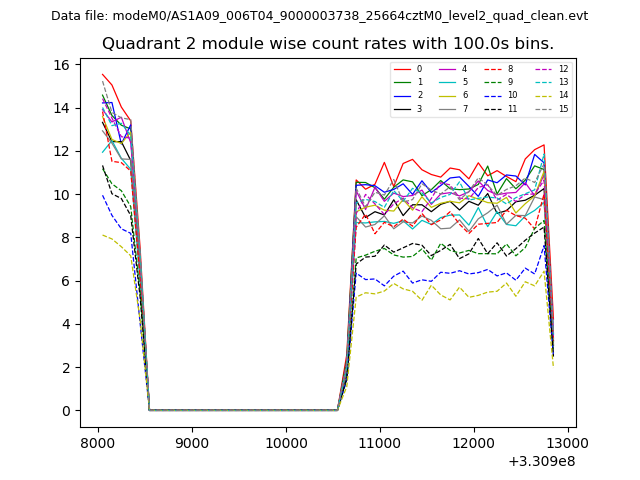
| Module-wise count rates for Quadrant B Data is divided into 100 sec bins |
 |
 |
| Module-wise count rates for Quadrant C Data is divided into 100 sec bins |
 |
 |
| Module-wise count rates for Quadrant D Data is divided into 100 sec bins |
 |
 |
| Parameter | Plot |
|---|---|
| CZT HV Monitor | 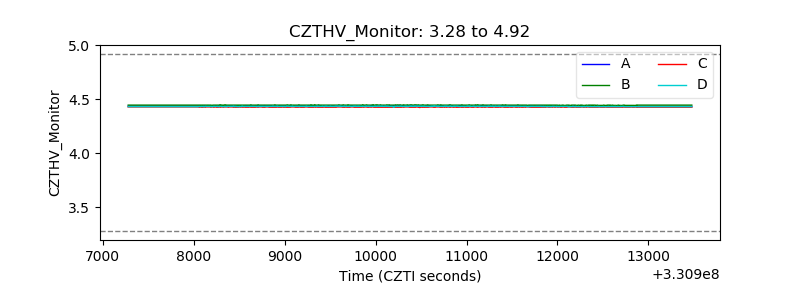 |
| D_VDD | 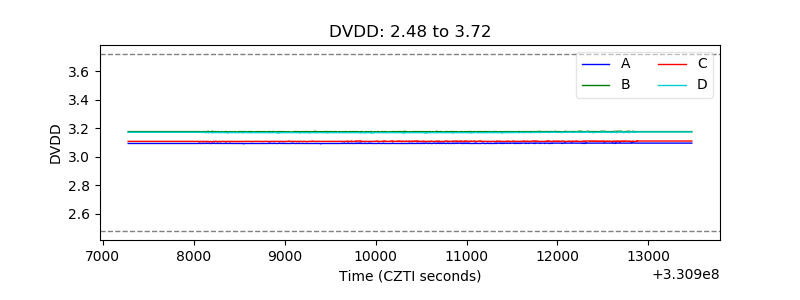 |
| Temperature 1 | 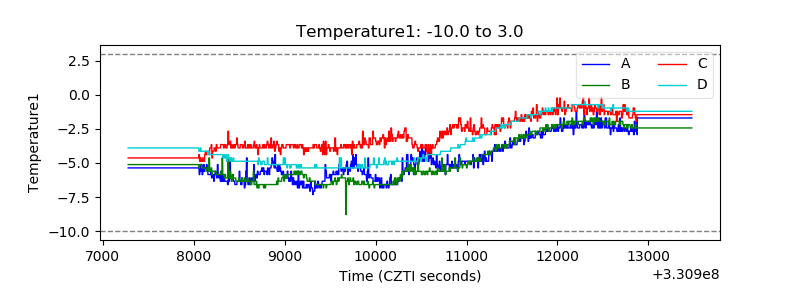 |
| Veto HV Monitor | 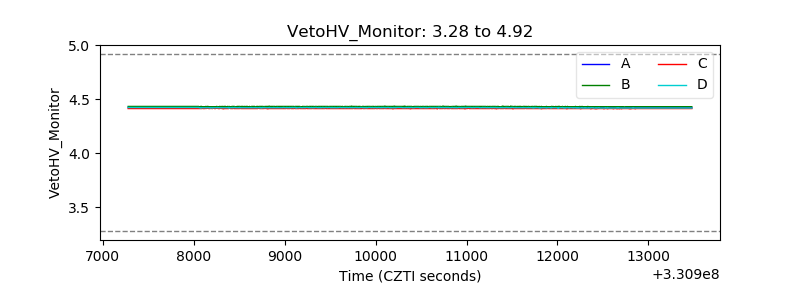 |
| Veto LLD | 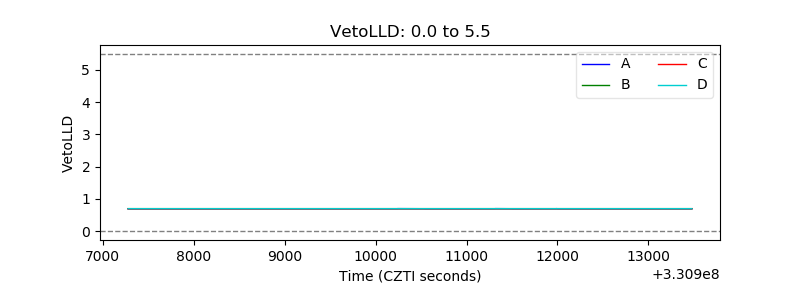 |
| Alpha Counter | 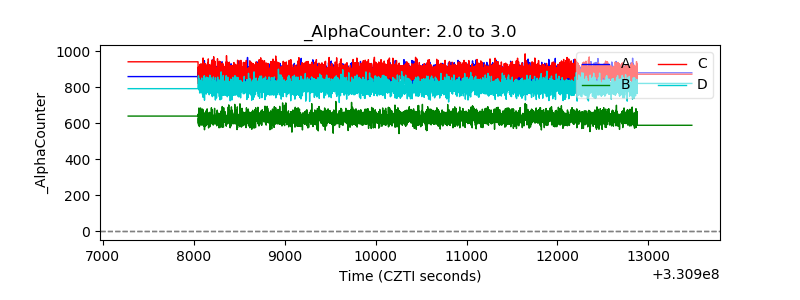 |
| _CPM_Rate | 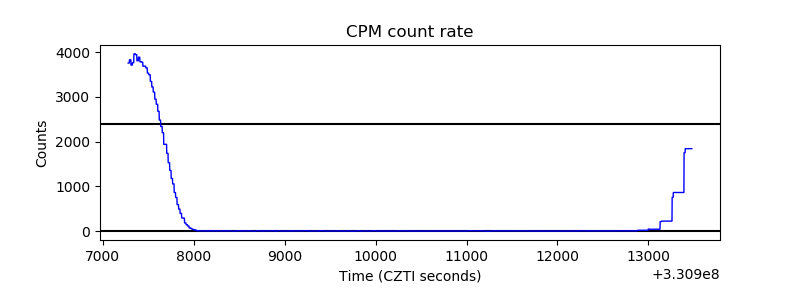 |
| CZT Counter | 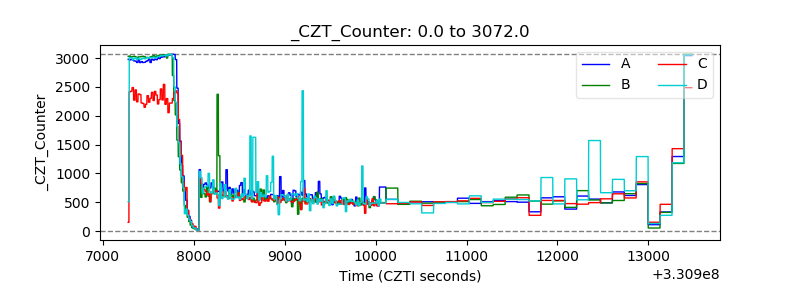 |
| +2.5 Volts monitor | 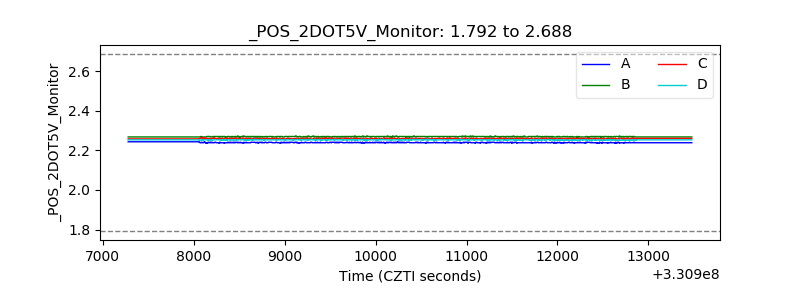 |
| +5 Volts monitor |  |
| _ROLL_ROT | 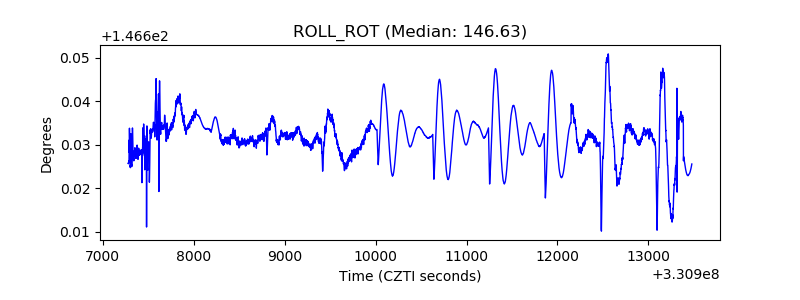 |
| _Roll_DEC | 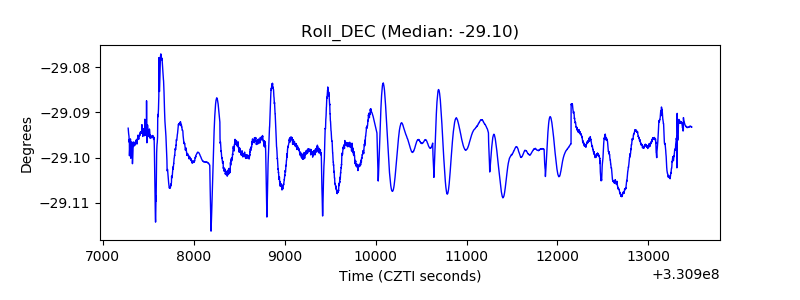 |
| _Roll_RA | 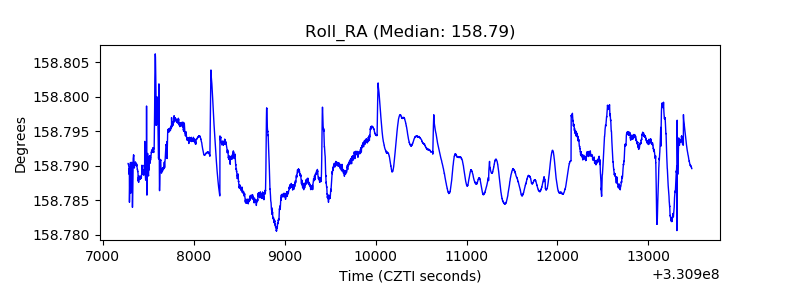 |
| Veto Counter | 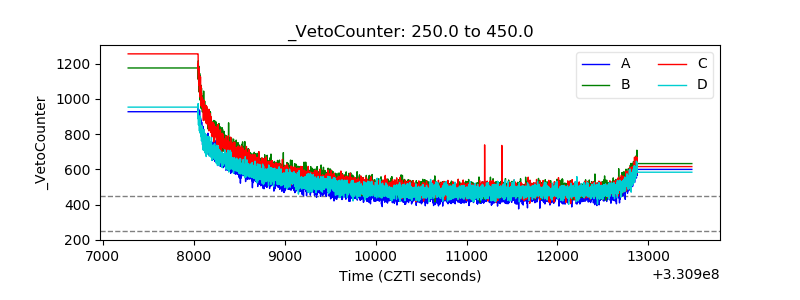 |