| Param | Original file | Final file |
|---|---|---|
| Filename | modeM0/AS1A09_006T05_9000003736_25657cztM0_level2.evt | modeM0/AS1A09_006T05_9000003736_25657cztM0_level2_quad_clean.evt |
| Size (bytes) | 560,125,440 | 100,532,160 |
| Size | 534.2 MB | 95.9 MB |
| Events in quadrant A | 4,069,884 | 647,053 |
| Events in quadrant B | 3,731,547 | 651,990 |
| Events in quadrant C | 3,648,598 | 620,902 |
| Events in quadrant D | 5,002,951 | 601,084 |
| Mode M9 | |||
|---|---|---|---|
| Quadrant | BADHDUFLAG | Total packets | Discarded packets |
| A | 0 | 13 | 0 |
| B | 0 | 13 | 0 |
| C | 0 | 13 | 0 |
| D | 0 | 13 | 0 |
| Mode M0 | |||
|---|---|---|---|
| Quadrant | BADHDUFLAG | Total packets | Discarded packets |
| A | 0 | 17005 | 0 |
| B | 0 | 15790 | 0 |
| C | 0 | 15611 | 0 |
| D | 0 | 19832 | 0 |
| Quadrant | Total seconds | Saturated seconds | Saturation percentage |
|---|---|---|---|
| A | 7524 | 131 | 1.741095% |
| B | 7524 | 132 | 1.754386% |
| C | 7524 | 163 | 2.166401% |
| D | 7524 | 341 | 4.532164% |
Noise dominated data is calculated using 1-second bins in cleaned event files. If a bin has >2000 counts, and if more than 50% of those come from <1% of pixels, then it is considered to be noise-dominated and hence unusable.
| Quadrant | # 1 sec bins | Bins with >0 counts | Bins with >2000 counts | High rate bins dominated by noise | Noise dominated (total time) | Noise dominated (detector-on time) | Marked lightcurve |
|---|---|---|---|---|---|---|---|
| A | 8759 | 7524 | 0 | 0 | 0.00% | 0.00% | 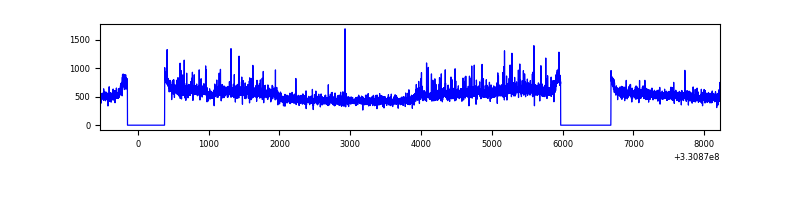 |
| B | 8759 | 7524 | 1 | 1 | 0.01% | 0.01% | 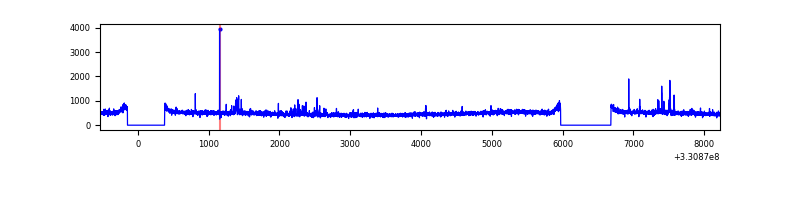 |
| C | 8759 | 7526 | 0 | 0 | 0.00% | 0.00% | 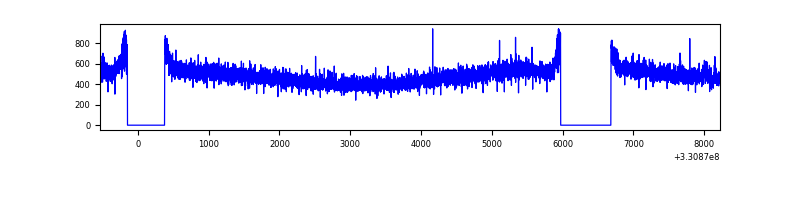 |
| D | 8759 | 7524 | 202 | 202 | 2.31% | 2.68% | 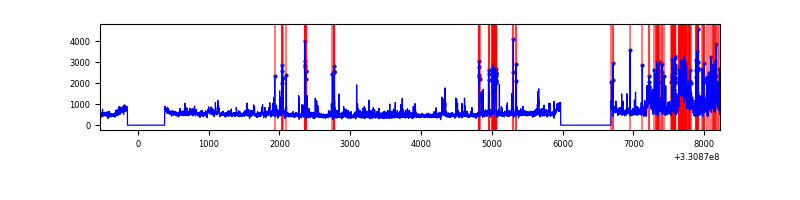 |
Top three noisy pixels from each quadrant. If the there are fewer than three noisy pixels in the level2.evt file, extra rows are filled as -1
| Pixel properties | Quadrant properties | ||||||
|---|---|---|---|---|---|---|---|
| Quadrant | DetID | PixID | Counts | Sigma | Mean | Median | Sigma |
| A | 8 | 192 | 453882 | 2394.31 | 936 | 912 | 189.2 |
| A | 13 | 254 | 11749 | 57.28 | 936 | 912 | 189.2 |
| A | 3 | 137 | 8944 | 42.45 | 936 | 912 | 189.2 |
| B | 0 | 245 | 48044 | 262.33 | 925 | 899 | 179.7 |
| B | 0 | 190 | 35400 | 191.97 | 925 | 899 | 179.7 |
| B | 12 | 111 | 22319 | 119.19 | 925 | 899 | 179.7 |
| C | 14 | 238 | 141195 | 665.8 | 891 | 892 | 210.7 |
| C | 3 | 233 | 28907 | 132.94 | 891 | 892 | 210.7 |
| C | 2 | 16 | 10028 | 43.35 | 891 | 892 | 210.7 |
| D | 1 | 52 | 1118269 | 5089.53 | 899 | 871 | 219.5 |
| D | 8 | 195 | 346496 | 1574.25 | 899 | 871 | 219.5 |
| D | 13 | 104 | 58634 | 263.1 | 899 | 871 | 219.5 |
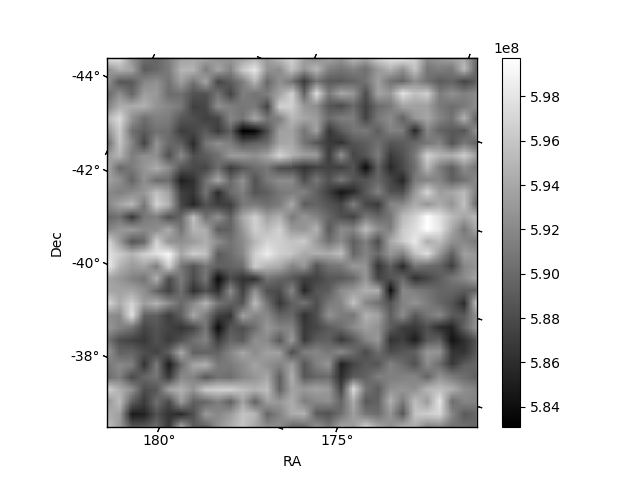
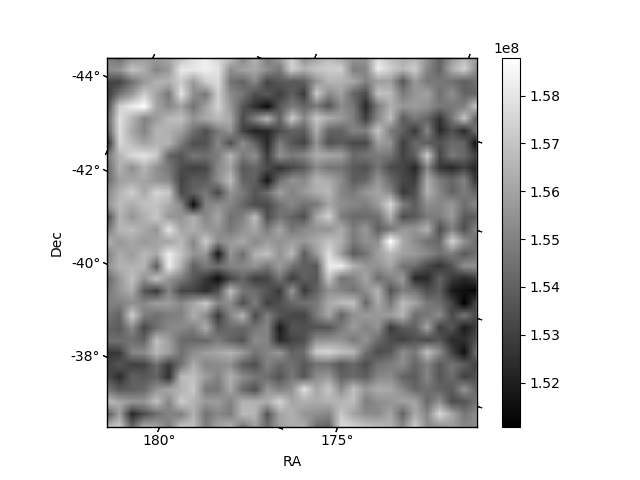
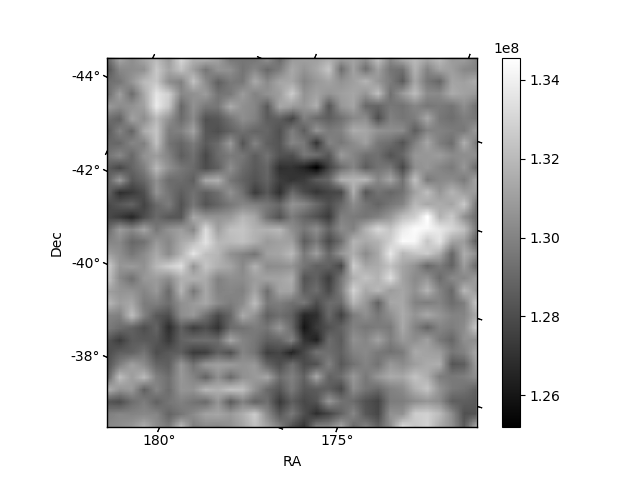
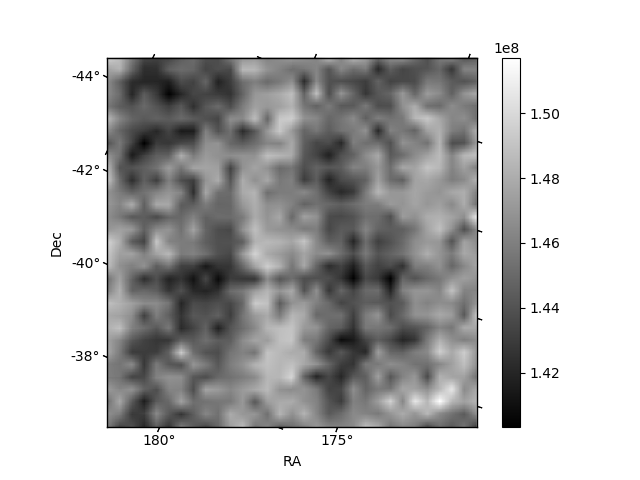
Histogram calculated using DETX and DETY for each event in the final _common_clean file
| Quadrant A | 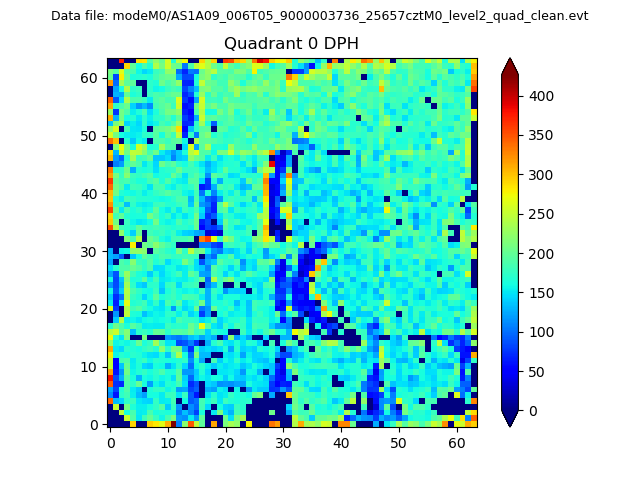 |
 |
Quadrant B |
|---|---|---|---|
| Quadrant D | 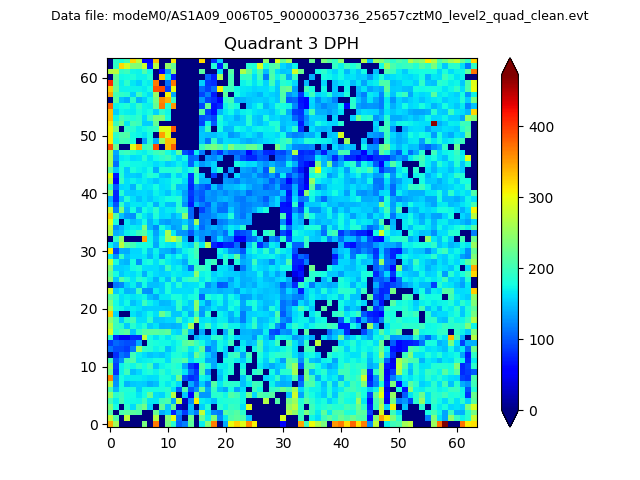 |
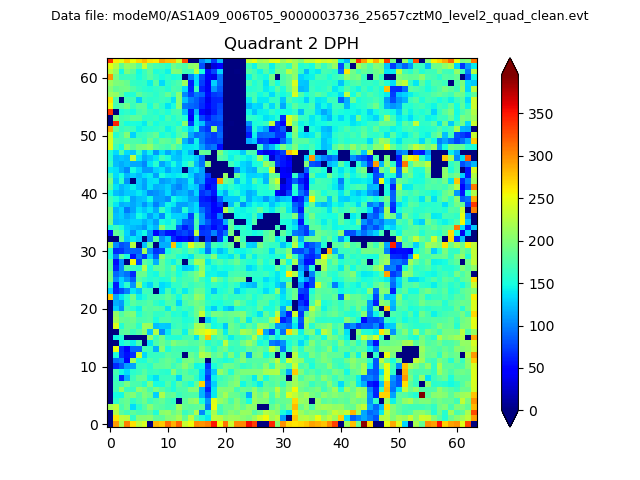 |
Quadrant C |
| Plot type | Count rate plots | Images |
|---|---|---|
| Comparison with Poisson distribution Blue bars denote a histogram of data divided into 1 sec bins. Red curve is a Poisson curve with rate = median count rate of data. |
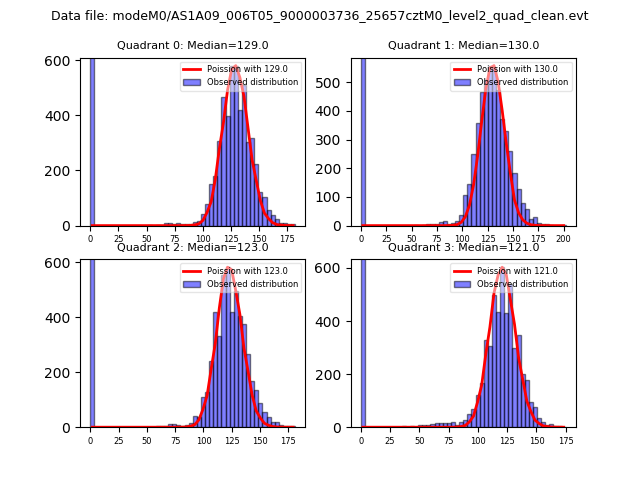 |
 |
| Quadrant-wise count rates Data is divided into 100 sec bins |
 |
|
| Module-wise count rates for Quadrant A Data is divided into 100 sec bins |
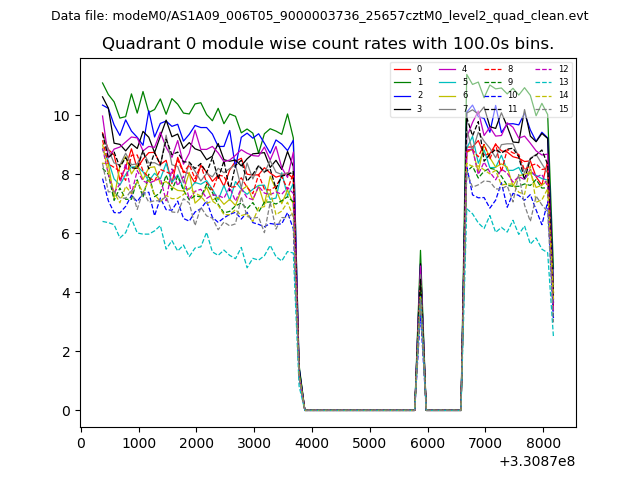 |
 |
| Module-wise count rates for Quadrant B Data is divided into 100 sec bins |
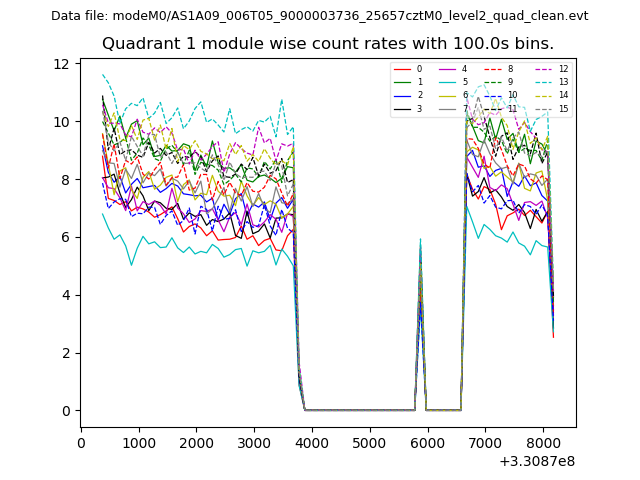 |
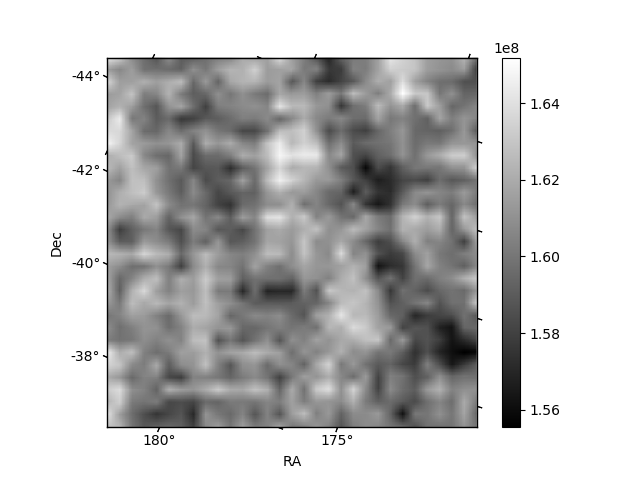 |
| Module-wise count rates for Quadrant C Data is divided into 100 sec bins |
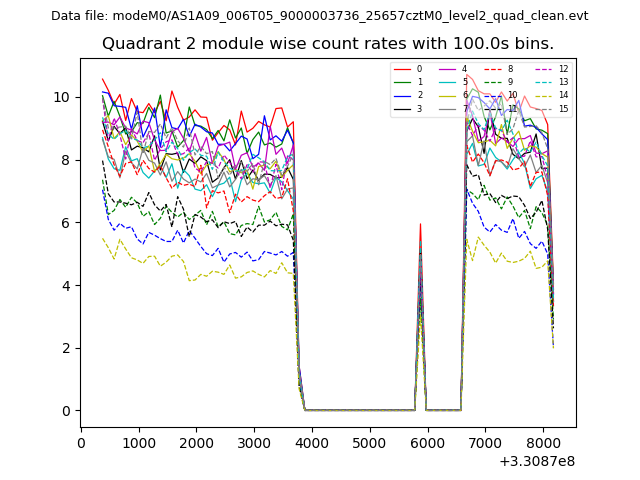 |
 |
| Module-wise count rates for Quadrant D Data is divided into 100 sec bins |
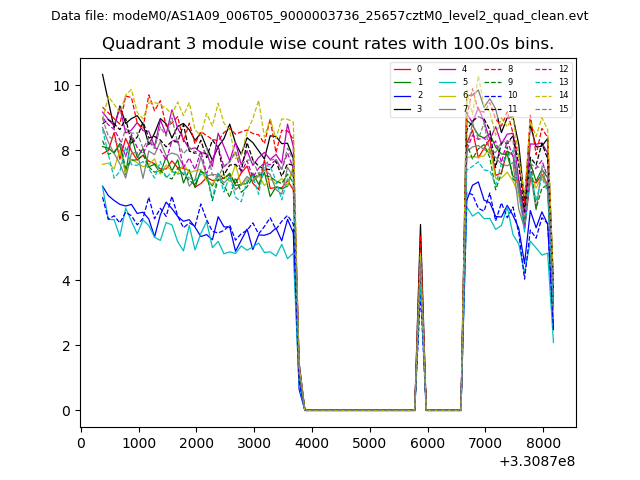 |
 |
| Parameter | Plot |
|---|---|
| CZT HV Monitor |  |
| D_VDD | 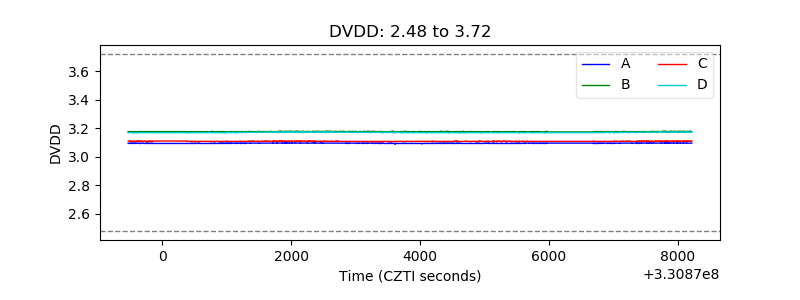 |
| Temperature 1 | 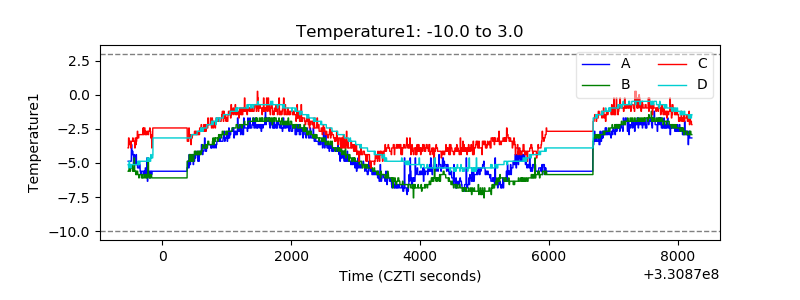 |
| Veto HV Monitor | 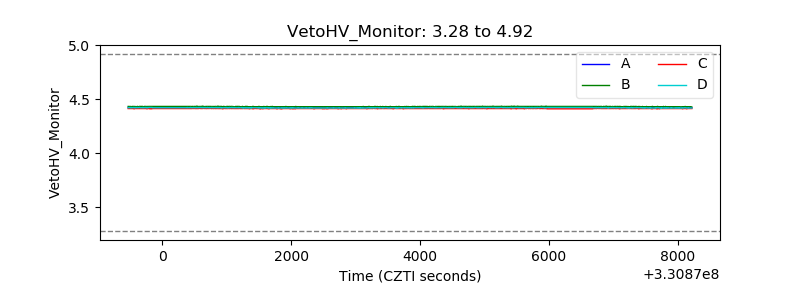 |
| Veto LLD | 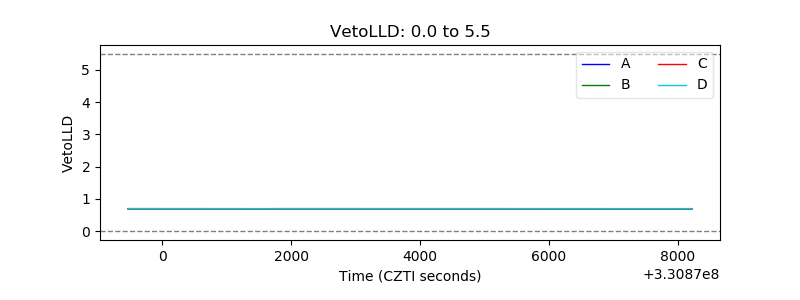 |
| Alpha Counter | 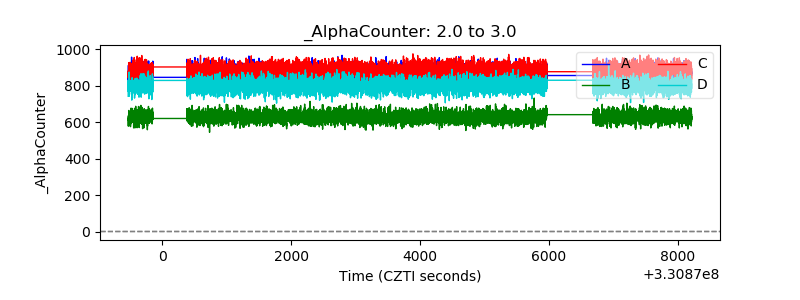 |
| _CPM_Rate | 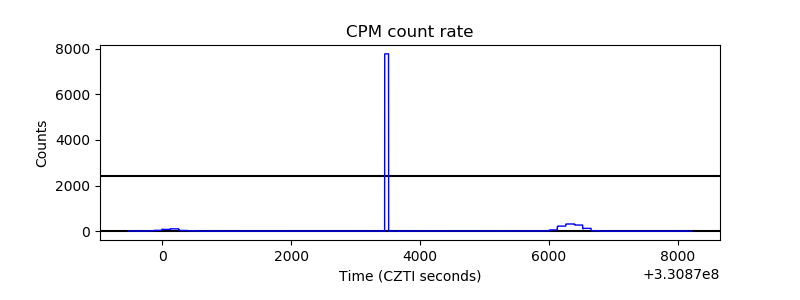 |
| CZT Counter | 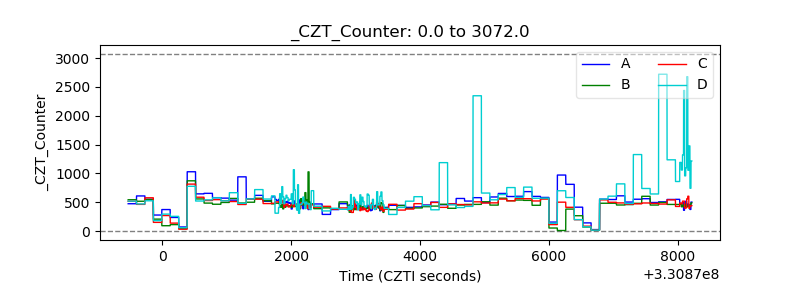 |
| +2.5 Volts monitor |  |
| +5 Volts monitor |  |
| _ROLL_ROT | 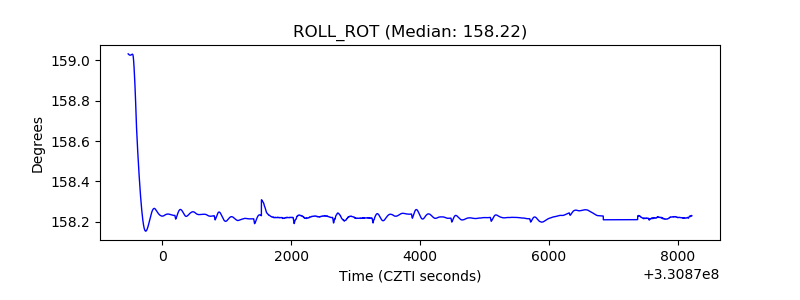 |
| _Roll_DEC | 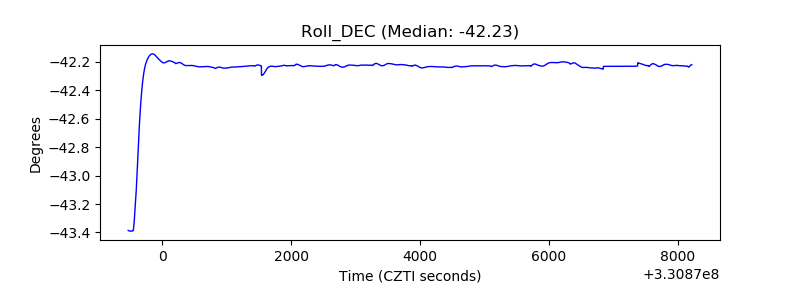 |
| _Roll_RA | 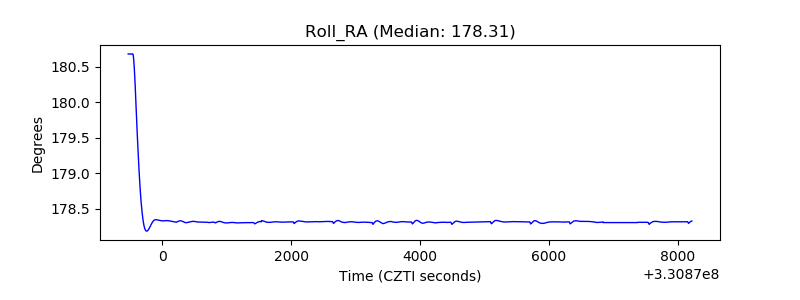 |
| Veto Counter | 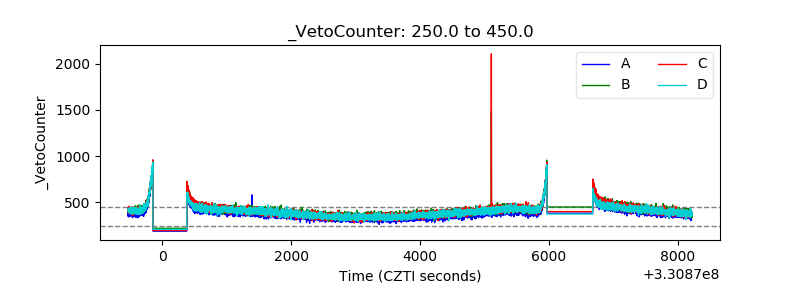 |