| Param | Original file | Final file |
|---|---|---|
| Filename | modeM0/AS1A09_006T05_9000003736_25658cztM0_level2.evt | modeM0/AS1A09_006T05_9000003736_25658cztM0_level2_quad_clean.evt |
| Size (bytes) | 510,249,600 | 87,727,680 |
| Size | 486.6 MB | 83.7 MB |
| Events in quadrant A | 3,212,798 | 572,940 |
| Events in quadrant B | 3,143,228 | 577,408 |
| Events in quadrant C | 3,298,121 | 543,822 |
| Events in quadrant D | 5,360,476 | 511,657 |
| Mode M9 | |||
|---|---|---|---|
| Quadrant | BADHDUFLAG | Total packets | Discarded packets |
| A | 0 | 9 | 0 |
| B | 0 | 9 | 0 |
| C | 0 | 9 | 0 |
| D | 0 | 9 | 0 |
| Mode M0 | |||
|---|---|---|---|
| Quadrant | BADHDUFLAG | Total packets | Discarded packets |
| A | 0 | 13552 | 0 |
| B | 0 | 13406 | 0 |
| C | 0 | 14011 | 0 |
| D | 0 | 20314 | 0 |
| Quadrant | Total seconds | Saturated seconds | Saturation percentage |
|---|---|---|---|
| A | 6464 | 38 | 0.587871% |
| B | 6465 | 41 | 0.634184% |
| C | 6465 | 104 | 1.608662% |
| D | 6464 | 459 | 7.100866% |
Noise dominated data is calculated using 1-second bins in cleaned event files. If a bin has >2000 counts, and if more than 50% of those come from <1% of pixels, then it is considered to be noise-dominated and hence unusable.
| Quadrant | # 1 sec bins | Bins with >0 counts | Bins with >2000 counts | High rate bins dominated by noise | Noise dominated (total time) | Noise dominated (detector-on time) | Marked lightcurve |
|---|---|---|---|---|---|---|---|
| A | 7379 | 6465 | 0 | 0 | 0.00% | 0.00% | 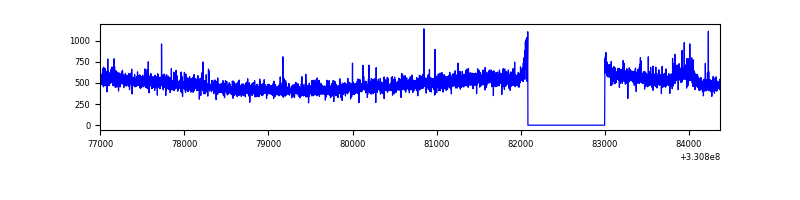 |
| B | 7380 | 6466 | 1 | 1 | 0.01% | 0.02% | 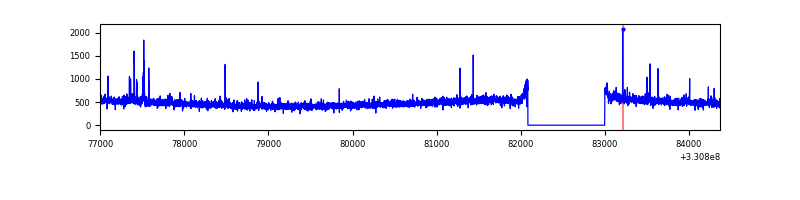 |
| C | 7380 | 6466 | 6 | 6 | 0.08% | 0.09% | 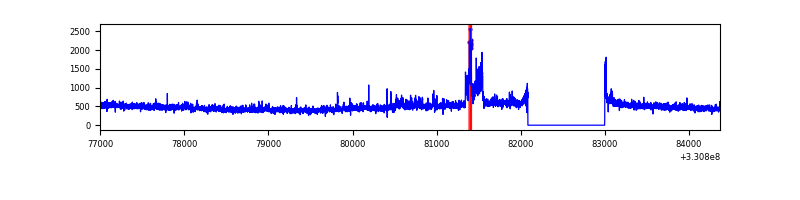 |
| D | 7378 | 6464 | 411 | 411 | 5.57% | 6.36% | 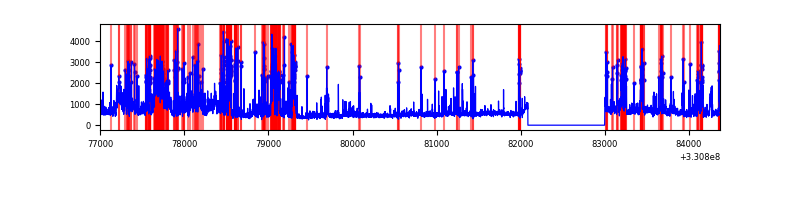 |
Top three noisy pixels from each quadrant. If the there are fewer than three noisy pixels in the level2.evt file, extra rows are filled as -1
| Pixel properties | Quadrant properties | ||||||
|---|---|---|---|---|---|---|---|
| Quadrant | DetID | PixID | Counts | Sigma | Mean | Median | Sigma |
| A | 8 | 192 | 155538 | 967.76 | 791 | 773 | 159.9 |
| A | 13 | 254 | 10509 | 60.88 | 791 | 773 | 159.9 |
| A | 3 | 137 | 7284 | 40.71 | 791 | 773 | 159.9 |
| B | 0 | 245 | 31847 | 205.16 | 783 | 764 | 151.5 |
| B | 12 | 111 | 18468 | 116.85 | 783 | 764 | 151.5 |
| B | 0 | 190 | 16678 | 105.04 | 783 | 764 | 151.5 |
| C | 3 | 233 | 273641 | 1557.24 | 745 | 748 | 175.2 |
| C | 14 | 238 | 118974 | 674.64 | 745 | 748 | 175.2 |
| C | 13 | 61 | 5327 | 26.13 | 745 | 748 | 175.2 |
| D | 1 | 52 | 2053390 | 11423.63 | 742 | 721 | 179.7 |
| D | 8 | 195 | 282606 | 1568.76 | 742 | 721 | 179.7 |
| D | 13 | 104 | 176020 | 975.58 | 742 | 721 | 179.7 |
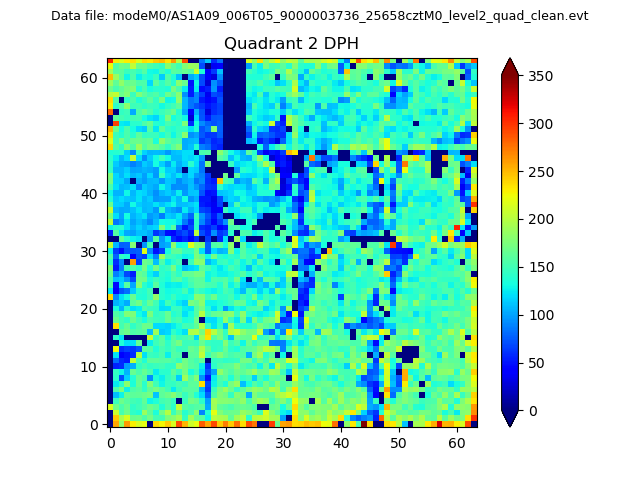
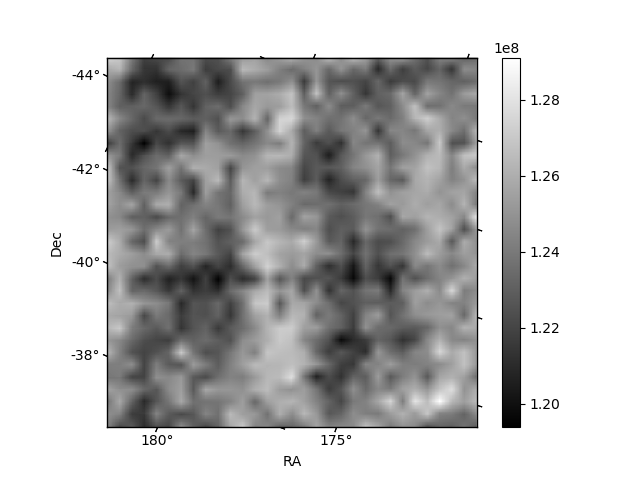
Histogram calculated using DETX and DETY for each event in the final _common_clean file
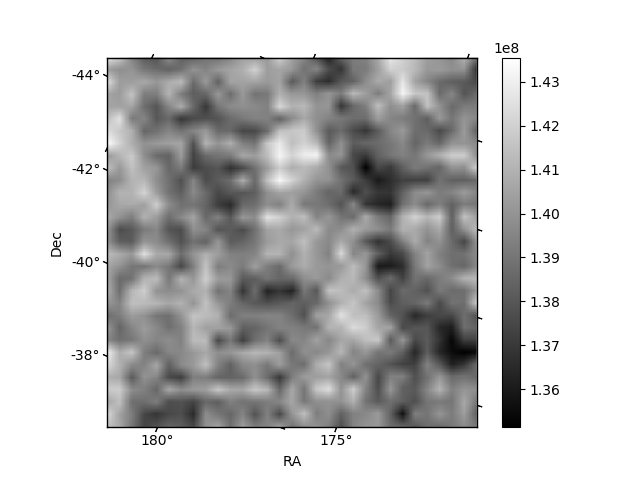
| Quadrant A | 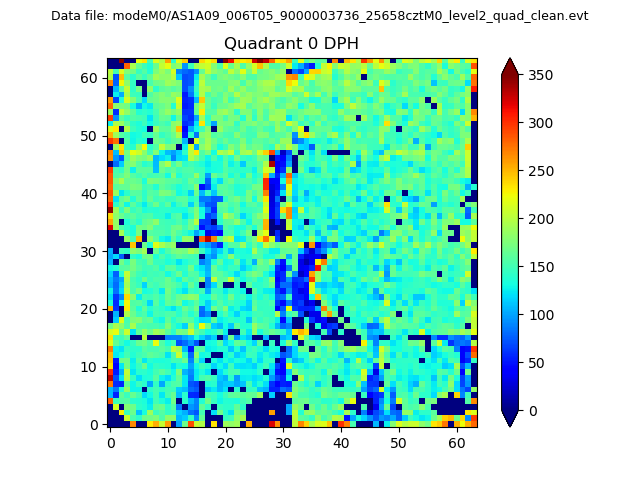 |
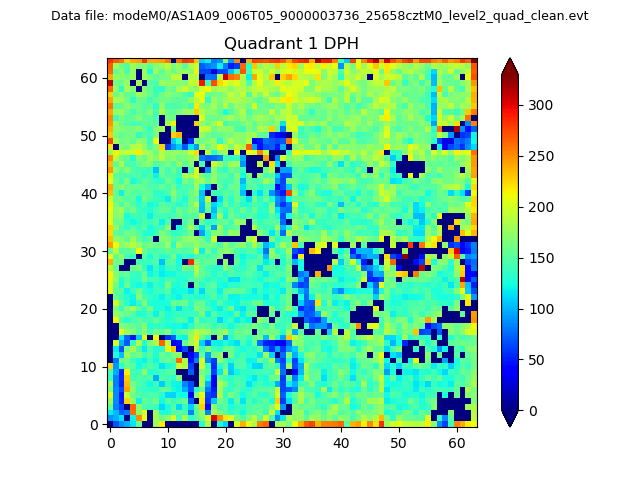 |
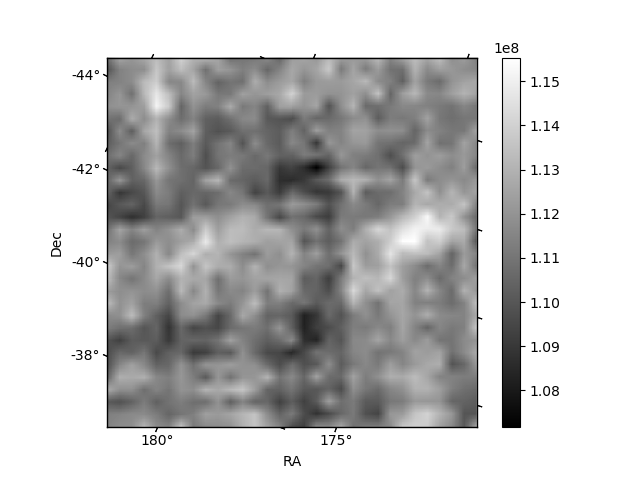
Quadrant B |
|---|---|---|---|
| Quadrant D | 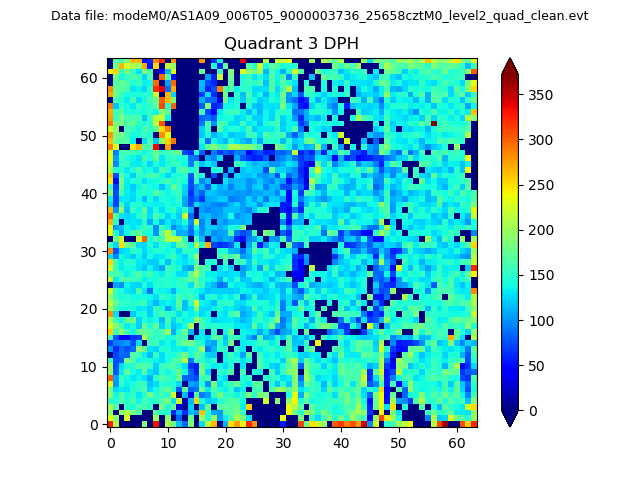 |
 |
Quadrant C |
| Plot type | Count rate plots | Images |
|---|---|---|
| Comparison with Poisson distribution Blue bars denote a histogram of data divided into 1 sec bins. Red curve is a Poisson curve with rate = median count rate of data. |
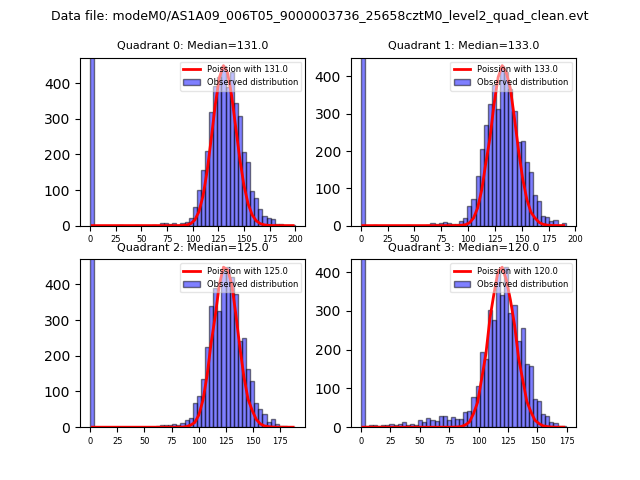 |
 |
| Quadrant-wise count rates Data is divided into 100 sec bins |
 |
|
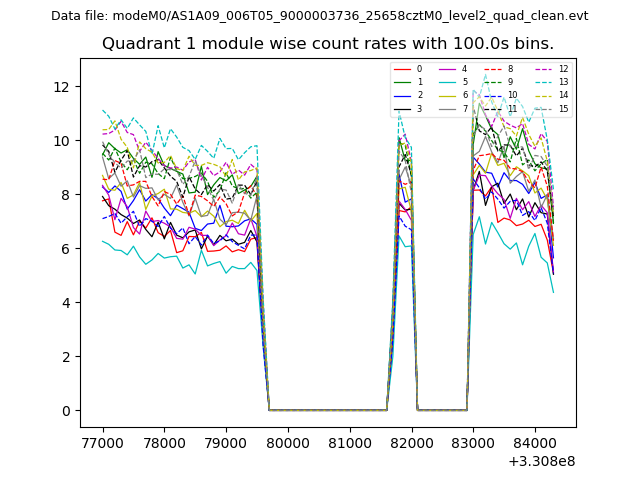
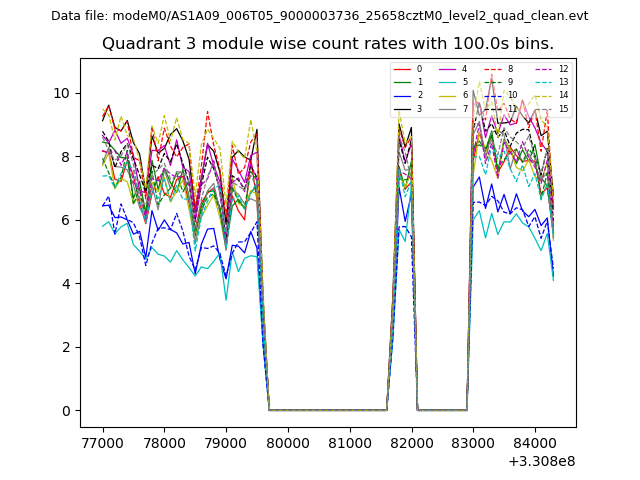
| Module-wise count rates for Quadrant A Data is divided into 100 sec bins |
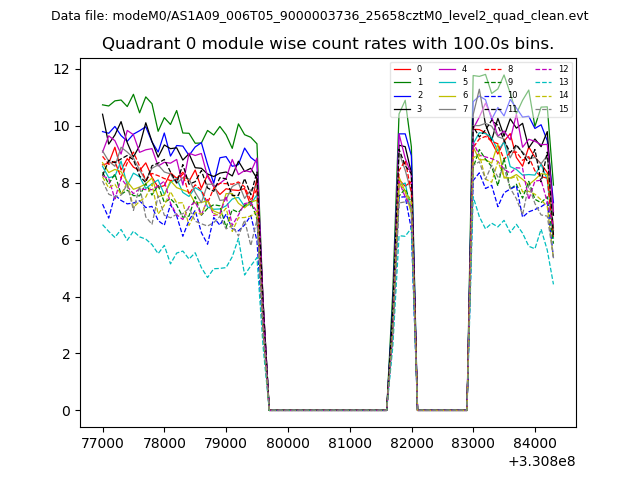 |
 |
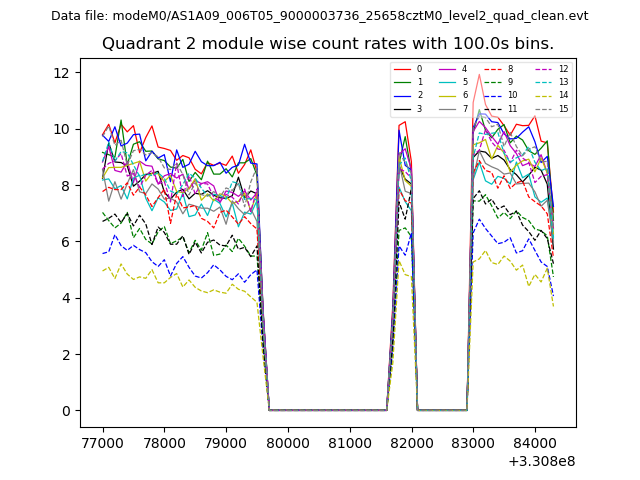
| Module-wise count rates for Quadrant B Data is divided into 100 sec bins |
 |
 |
| Module-wise count rates for Quadrant C Data is divided into 100 sec bins |
 |
 |
| Module-wise count rates for Quadrant D Data is divided into 100 sec bins |
 |
 |
| Parameter | Plot |
|---|---|
| CZT HV Monitor | 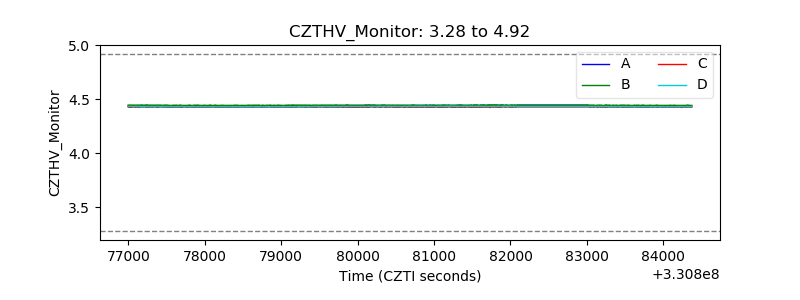 |
| D_VDD | 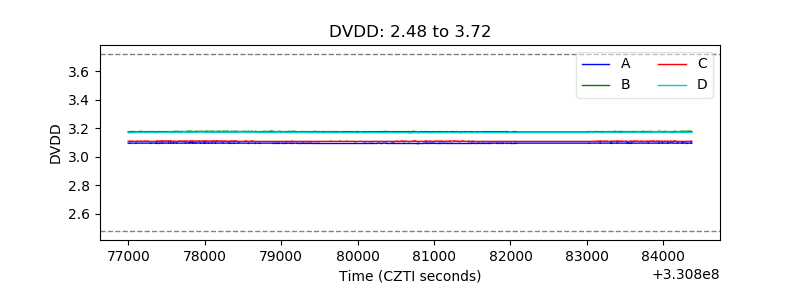 |
| Temperature 1 | 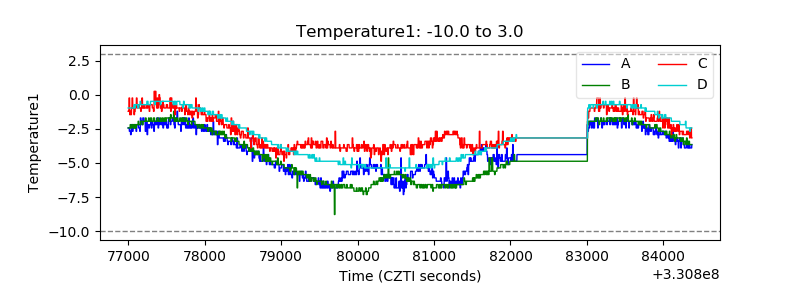 |
| Veto HV Monitor | 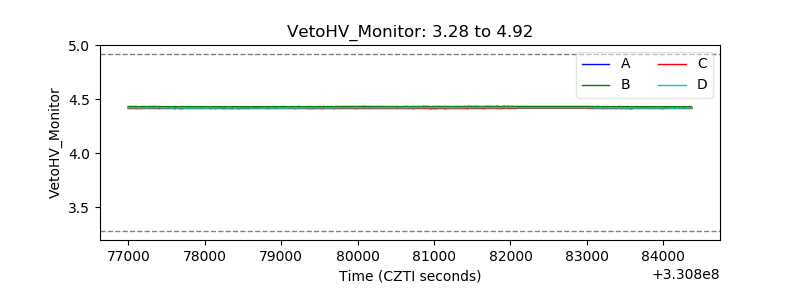 |
| Veto LLD | 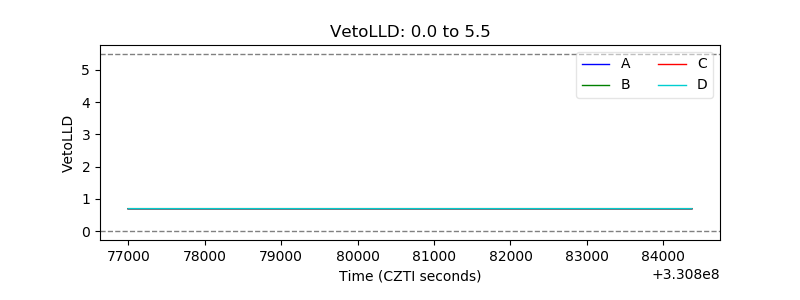 |
| Alpha Counter |  |
| _CPM_Rate | 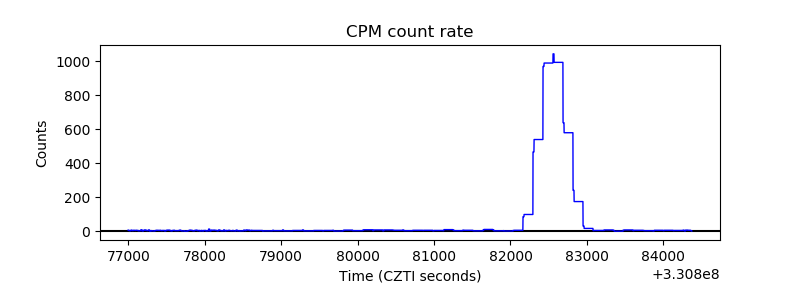 |
| CZT Counter | 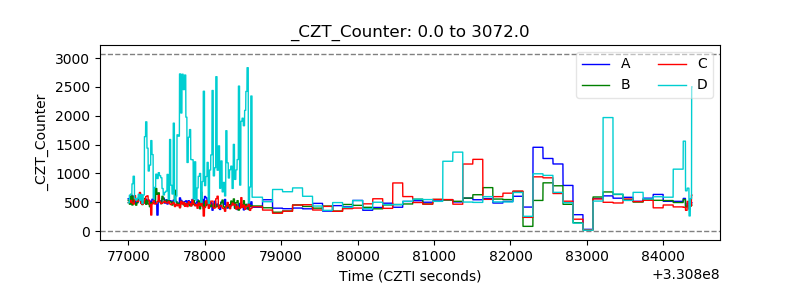 |
| +2.5 Volts monitor |  |
| +5 Volts monitor |  |
| _ROLL_ROT | 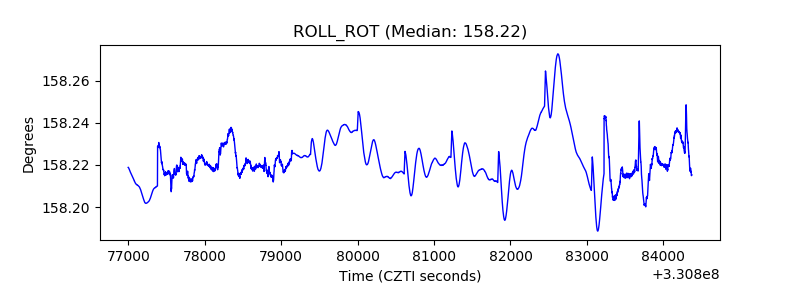 |
| _Roll_DEC | 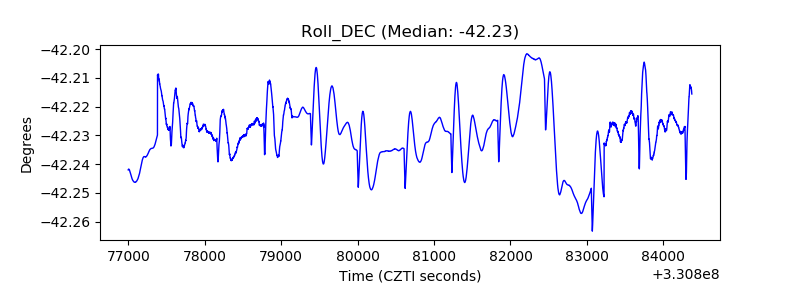 |
| _Roll_RA |  |
| Veto Counter | 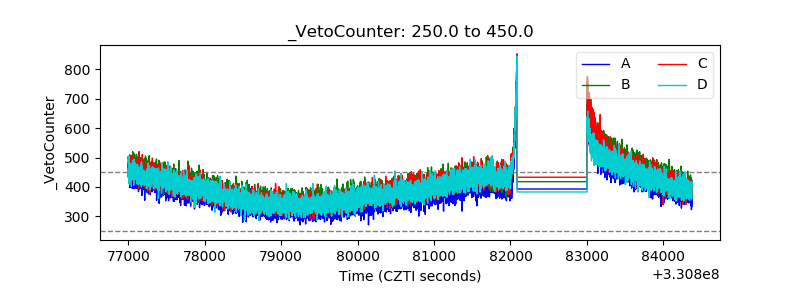 |