| Param | Original file | Final file |
|---|---|---|
| Filename | modeM0/AS1A09_006T05_9000003736_25661cztM0_level2.evt | modeM0/AS1A09_006T05_9000003736_25661cztM0_level2_quad_clean.evt |
| Size (bytes) | 116,320,320 | 31,184,640 |
| Size | 110.9 MB | 29.7 MB |
| Events in quadrant A | 836,335 | 216,122 |
| Events in quadrant B | 796,401 | 220,213 |
| Events in quadrant C | 757,362 | 204,567 |
| Events in quadrant D | 1,033,190 | 197,156 |
| Mode M9 | |||
|---|---|---|---|
| Quadrant | BADHDUFLAG | Total packets | Discarded packets |
| A | 0 | 11 | 0 |
| B | 0 | 11 | 0 |
| C | 0 | 11 | 0 |
| D | 0 | 11 | 0 |
| Mode M0 | |||
|---|---|---|---|
| Quadrant | BADHDUFLAG | Total packets | Discarded packets |
| A | 0 | 3388 | 0 |
| B | 0 | 3253 | 0 |
| C | 0 | 3121 | 0 |
| D | 0 | 4010 | 0 |
| Quadrant | Total seconds | Saturated seconds | Saturation percentage |
|---|---|---|---|
| A | 1423 | 33 | 2.319044% |
| B | 1424 | 38 | 2.668539% |
| C | 1424 | 32 | 2.247191% |
| D | 1424 | 50 | 3.511236% |
Noise dominated data is calculated using 1-second bins in cleaned event files. If a bin has >2000 counts, and if more than 50% of those come from <1% of pixels, then it is considered to be noise-dominated and hence unusable.
| Quadrant | # 1 sec bins | Bins with >0 counts | Bins with >2000 counts | High rate bins dominated by noise | Noise dominated (total time) | Noise dominated (detector-on time) | Marked lightcurve |
|---|---|---|---|---|---|---|---|
| A | 2478 | 1423 | 0 | 0 | 0.00% | 0.00% | 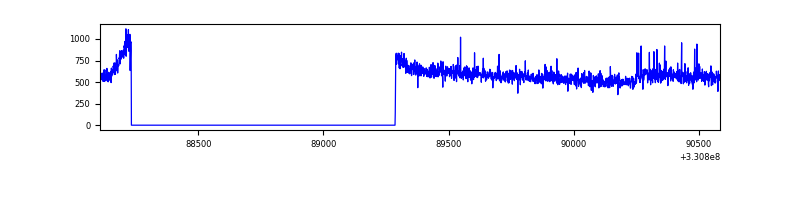 |
| B | 2479 | 1425 | 1 | 1 | 0.04% | 0.07% | 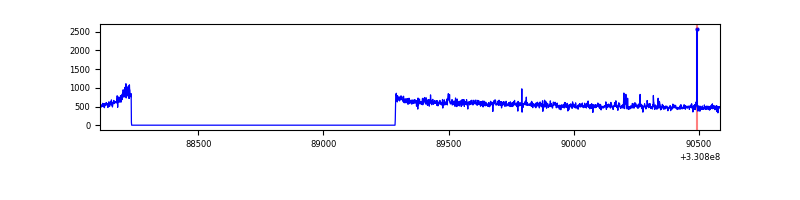 |
| C | 2479 | 1425 | 0 | 0 | 0.00% | 0.00% | 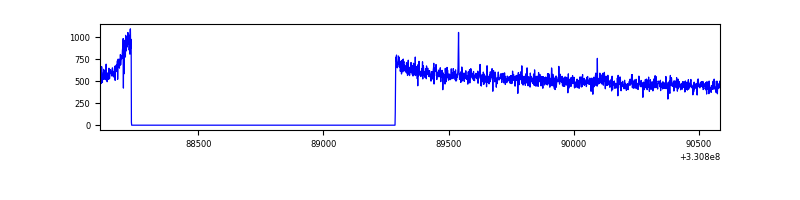 |
| D | 2479 | 1425 | 22 | 22 | 0.89% | 1.54% | 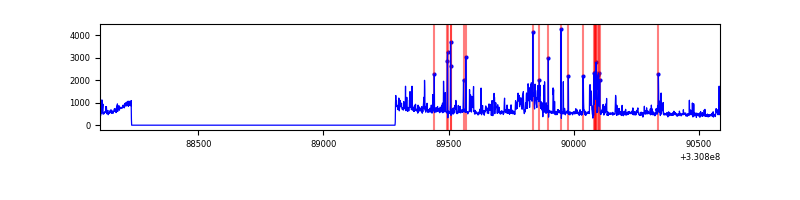 |
Top three noisy pixels from each quadrant. If the there are fewer than three noisy pixels in the level2.evt file, extra rows are filled as -1
| Pixel properties | Quadrant properties | ||||||
|---|---|---|---|---|---|---|---|
| Quadrant | DetID | PixID | Counts | Sigma | Mean | Median | Sigma |
| A | 8 | 192 | 63836 | 1541.25 | 200 | 196 | 41.3 |
| A | 13 | 254 | 2309 | 51.17 | 200 | 196 | 41.3 |
| A | 0 | 226 | 1742 | 37.44 | 200 | 196 | 41.3 |
| B | 0 | 245 | 6124 | 148.04 | 198 | 194 | 40.1 |
| B | 0 | 190 | 4401 | 105.03 | 198 | 194 | 40.1 |
| B | 12 | 111 | 4392 | 104.8 | 198 | 194 | 40.1 |
| C | 14 | 238 | 29515 | 654.43 | 185 | 185 | 44.8 |
| C | 3 | 233 | 5387 | 116.07 | 185 | 185 | 44.8 |
| C | 13 | 61 | 1301 | 24.9 | 185 | 185 | 44.8 |
| D | 1 | 52 | 266045 | 5690.23 | 188 | 183 | 46.7 |
| D | 8 | 195 | 34303 | 730.27 | 188 | 183 | 46.7 |
| D | 7 | 238 | 8800 | 184.43 | 188 | 183 | 46.7 |
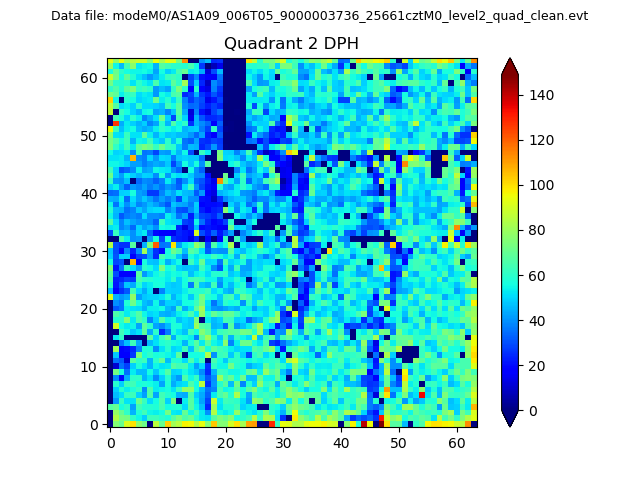
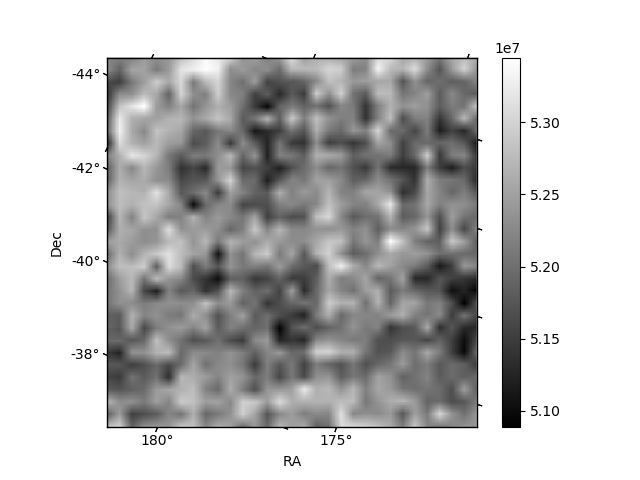
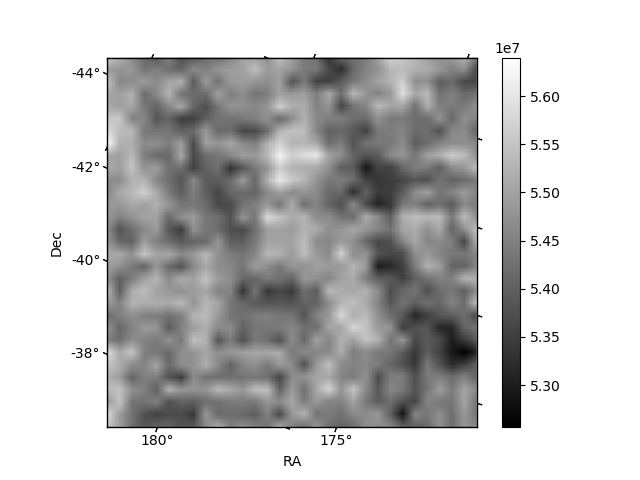
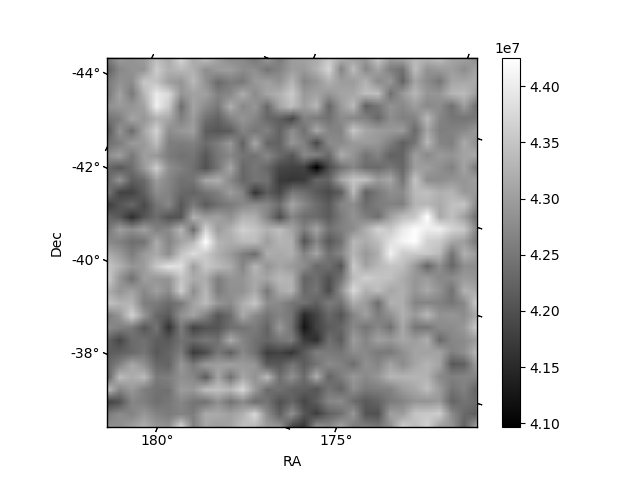
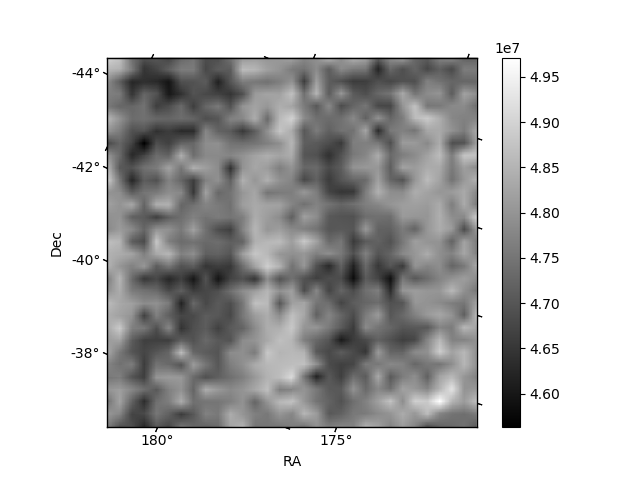
Histogram calculated using DETX and DETY for each event in the final _common_clean file
| Quadrant A | 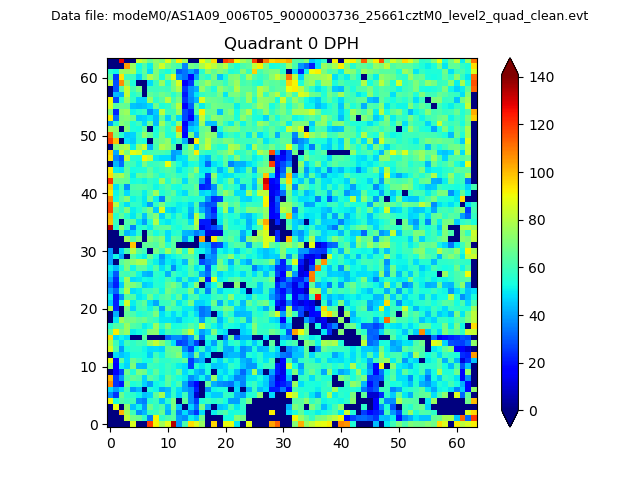 |
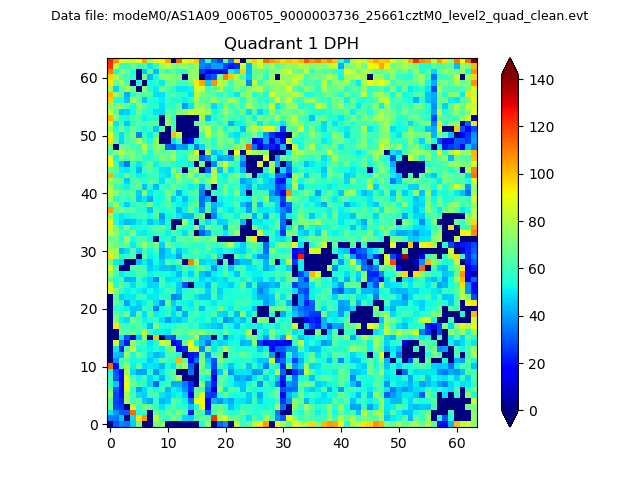 |
Quadrant B |
|---|---|---|---|
| Quadrant D | 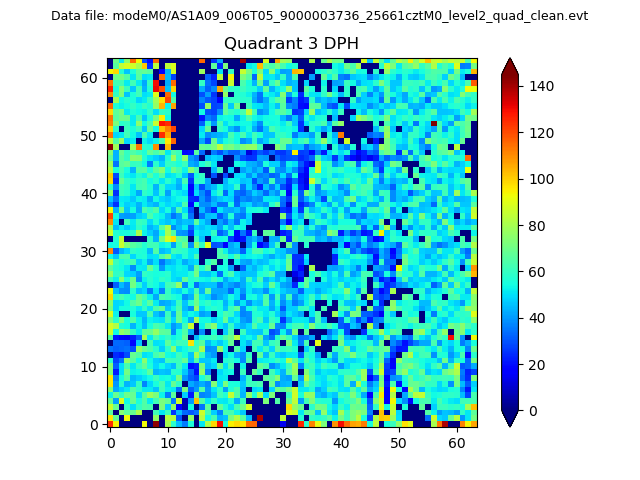 |
 |
Quadrant C |
| Plot type | Count rate plots | Images |
|---|---|---|
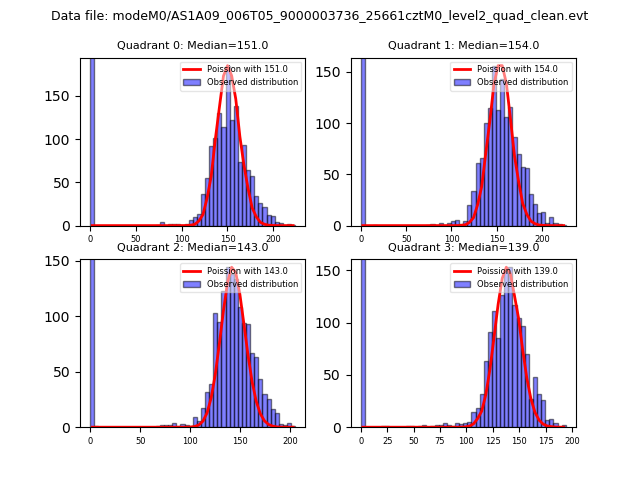
| Comparison with Poisson distribution Blue bars denote a histogram of data divided into 1 sec bins. Red curve is a Poisson curve with rate = median count rate of data. |
 |
 |
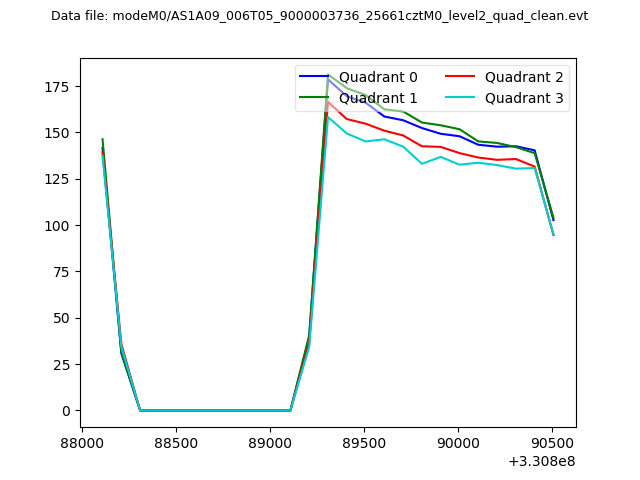
| Quadrant-wise count rates Data is divided into 100 sec bins |
 |
|
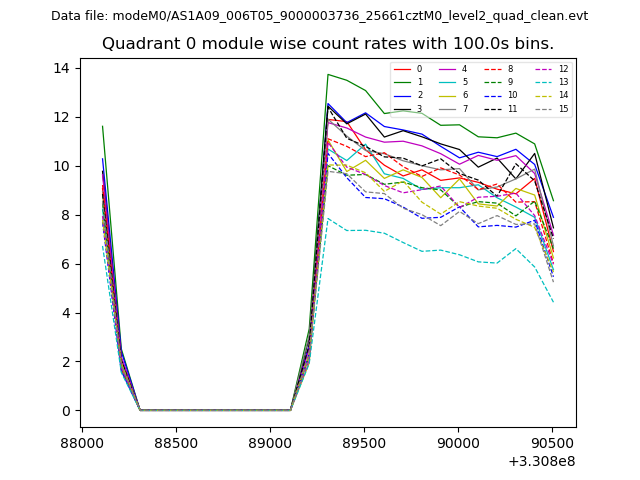
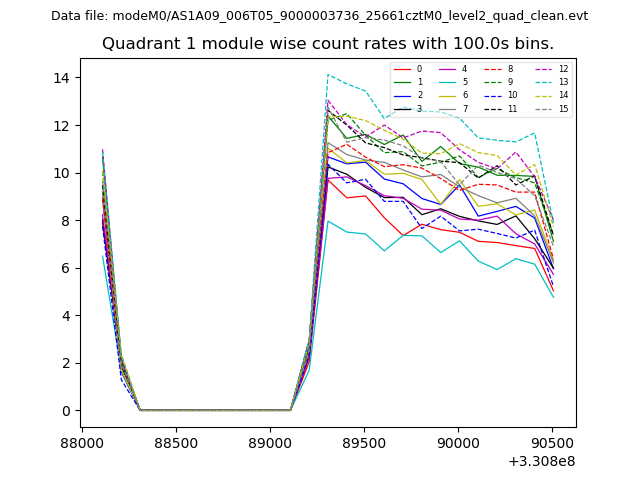
| Module-wise count rates for Quadrant A Data is divided into 100 sec bins |
 |
 |
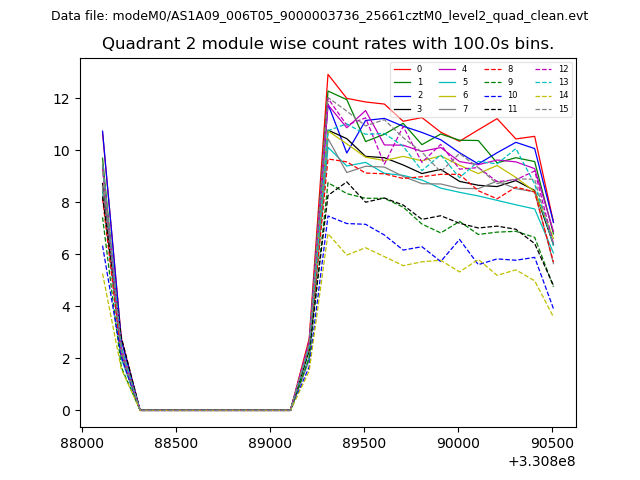
| Module-wise count rates for Quadrant B Data is divided into 100 sec bins |
 |
 |
| Module-wise count rates for Quadrant C Data is divided into 100 sec bins |
 |
 |
| Module-wise count rates for Quadrant D Data is divided into 100 sec bins |
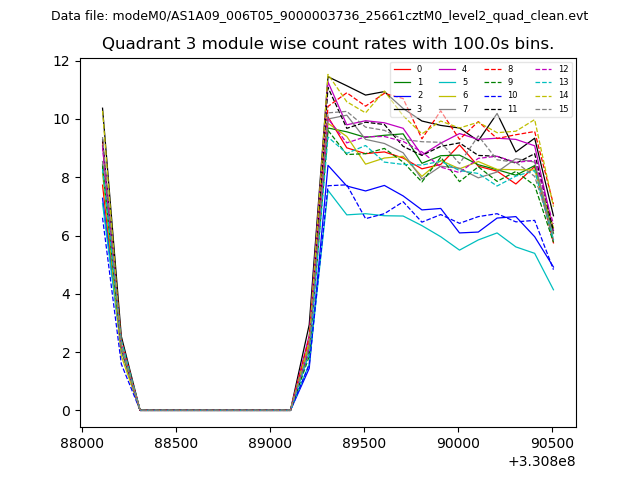 |
 |
| Parameter | Plot |
|---|---|
| CZT HV Monitor | 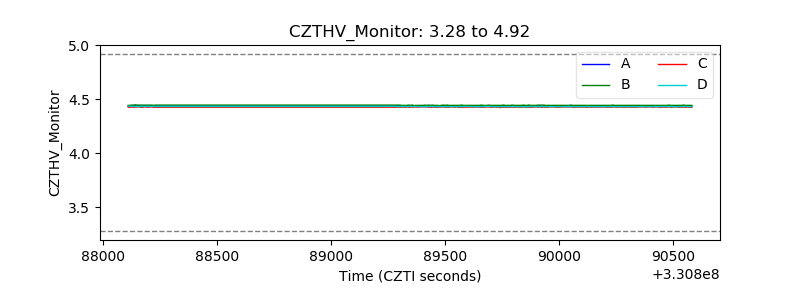 |
| D_VDD | 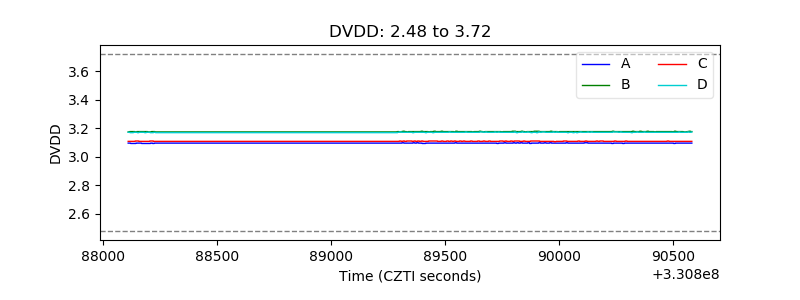 |
| Temperature 1 | 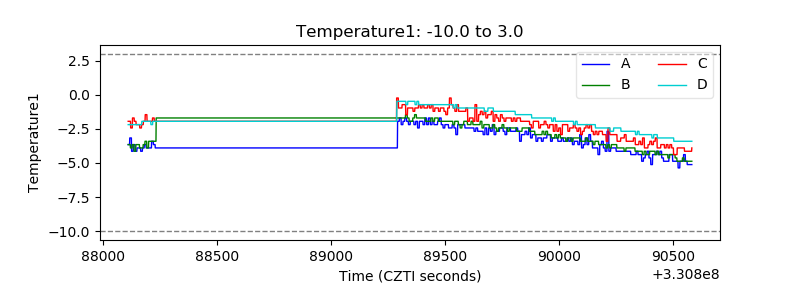 |
| Veto HV Monitor | 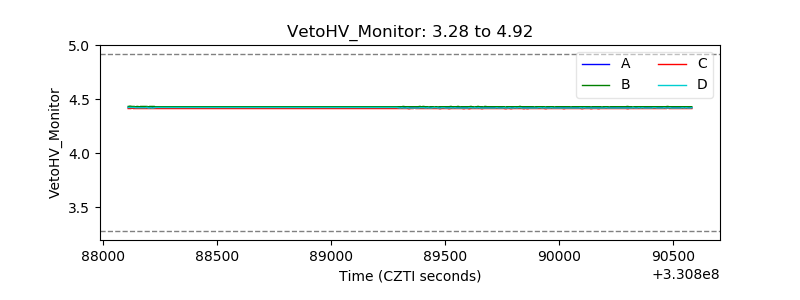 |
| Veto LLD | 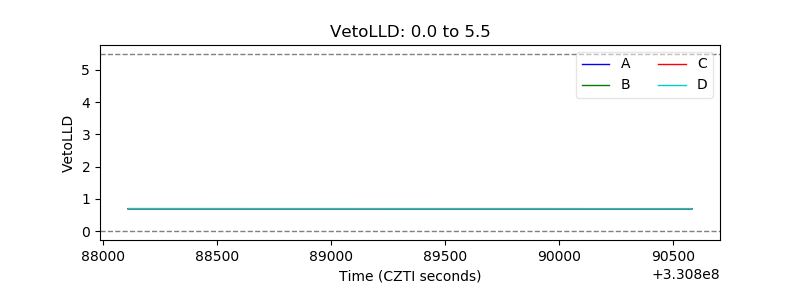 |
| Alpha Counter | 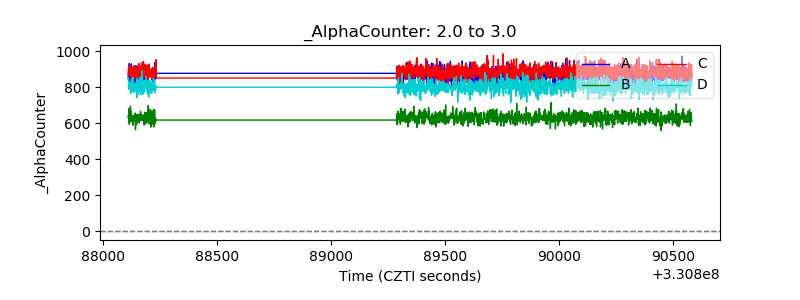 |
| _CPM_Rate |  |
| CZT Counter | 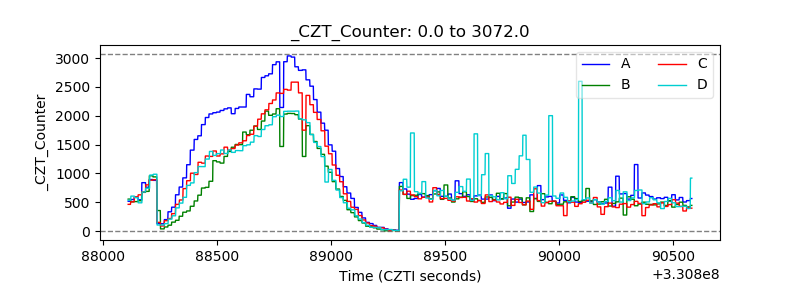 |
| +2.5 Volts monitor |  |
| +5 Volts monitor |  |
| _ROLL_ROT | 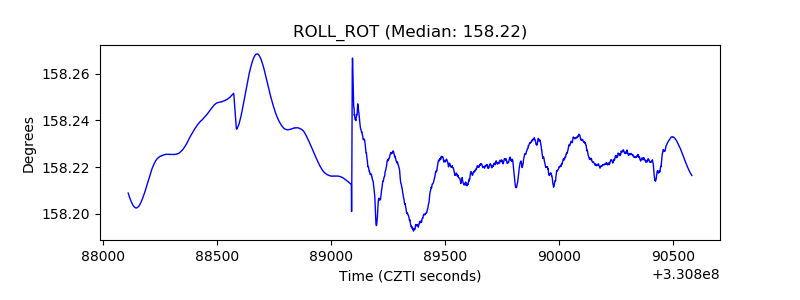 |
| _Roll_DEC | 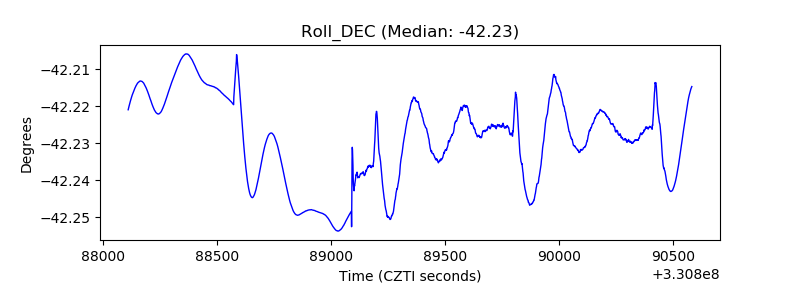 |
| _Roll_RA | 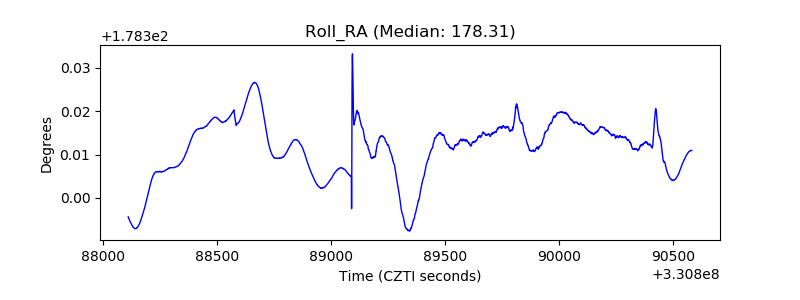 |
| Veto Counter |  |