| Param | Original file | Final file |
|---|---|---|
| Filename | modeM0/AS1A09_006T05_9000003736_25837cztM0_level2.evt | modeM0/AS1A09_006T05_9000003736_25837cztM0_level2_quad_clean.evt |
| Size (bytes) | 33,235,200 | 5,207,040 |
| Size | 31.7 MB | 5.0 MB |
| Events in quadrant A | 222,162 | 34,551 |
| Events in quadrant B | 217,669 | 30,773 |
| Events in quadrant C | 210,404 | 29,625 |
| Events in quadrant D | 324,714 | 25,294 |
| Mode M9 | |||
|---|---|---|---|
| Quadrant | BADHDUFLAG | Total packets | Discarded packets |
| A | 0 | 1 | 1 |
| B | 0 | 2 | 2 |
| C | 0 | 2 | 1 |
| D | 0 | 2 | 2 |
| Mode M0 | |||
|---|---|---|---|
| Quadrant | BADHDUFLAG | Total packets | Discarded packets |
| A | 0 | 880 | 0 |
| B | 0 | 886 | 0 |
| C | 0 | 832 | 0 |
| D | 0 | 1207 | 0 |
| Quadrant | Total seconds | Saturated seconds | Saturation percentage |
|---|---|---|---|
| A | 402 | 0 | 0.000000% |
| B | 372 | 1 | 0.268817% |
| C | 398 | 1 | 0.251256% |
| D | 341 | 22 | 6.451613% |
Noise dominated data is calculated using 1-second bins in cleaned event files. If a bin has >2000 counts, and if more than 50% of those come from <1% of pixels, then it is considered to be noise-dominated and hence unusable.
| Quadrant | # 1 sec bins | Bins with >0 counts | Bins with >2000 counts | High rate bins dominated by noise | Noise dominated (total time) | Noise dominated (detector-on time) | Marked lightcurve |
|---|---|---|---|---|---|---|---|
| A | 918 | 470 | 0 | 0 | 0.00% | 0.00% | 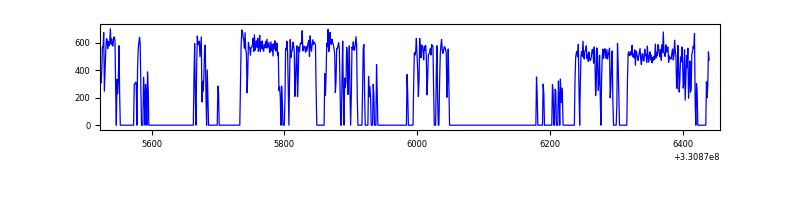 |
| B | 917 | 442 | 0 | 0 | 0.00% | 0.00% | 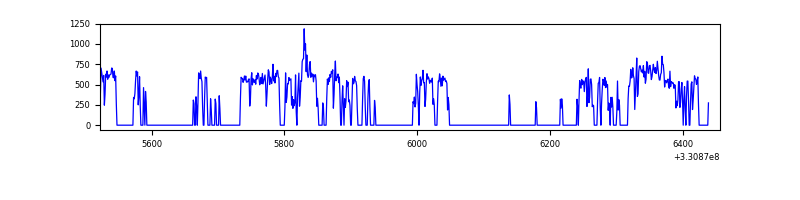 |
| C | 934 | 484 | 0 | 0 | 0.00% | 0.00% | 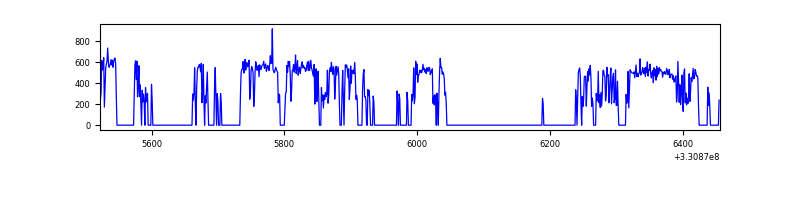 |
| D | 919 | 416 | 18 | 18 | 1.96% | 4.33% | 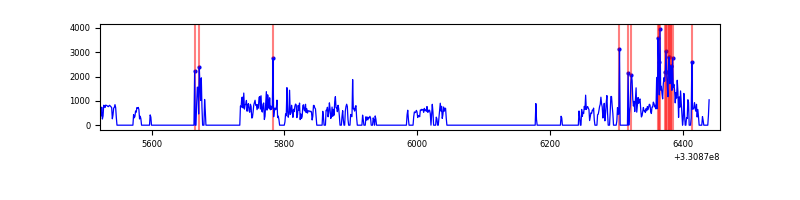 |
Top three noisy pixels from each quadrant. If the there are fewer than three noisy pixels in the level2.evt file, extra rows are filled as -1
| Pixel properties | Quadrant properties | ||||||
|---|---|---|---|---|---|---|---|
| Quadrant | DetID | PixID | Counts | Sigma | Mean | Median | Sigma |
| A | 6 | 16 | 2113 | 152.53 | 57 | 56 | 13.5 |
| A | 13 | 254 | 603 | 40.56 | 57 | 56 | 13.5 |
| A | 0 | 226 | 506 | 33.37 | 57 | 56 | 13.5 |
| B | 10 | 247 | 11402 | 948.35 | 51 | 50 | 12.0 |
| B | 0 | 219 | 4336 | 358.05 | 51 | 50 | 12.0 |
| B | 0 | 229 | 1566 | 126.65 | 51 | 50 | 12.0 |
| C | 14 | 238 | 8526 | 616.5 | 51 | 51 | 13.7 |
| C | 3 | 233 | 812 | 55.36 | 51 | 51 | 13.7 |
| C | 10 | 23 | 468 | 30.33 | 51 | 51 | 13.7 |
| D | 7 | 80 | 71339 | 5664.91 | 44 | 43 | 12.6 |
| D | 12 | 233 | 70013 | 5559.55 | 44 | 43 | 12.6 |
| D | 1 | 52 | 8866 | 701.04 | 44 | 43 | 12.6 |
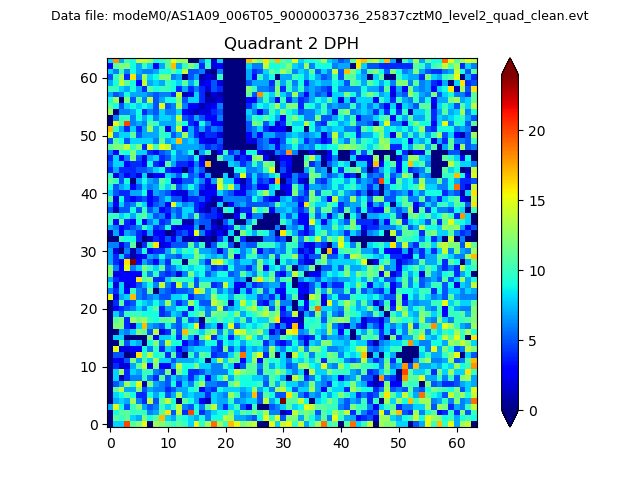
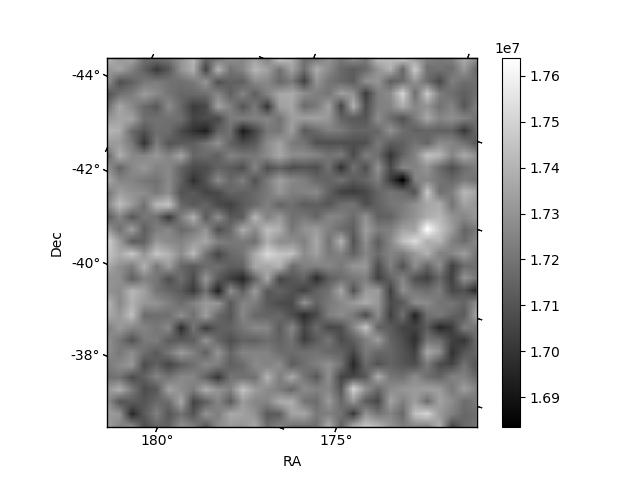
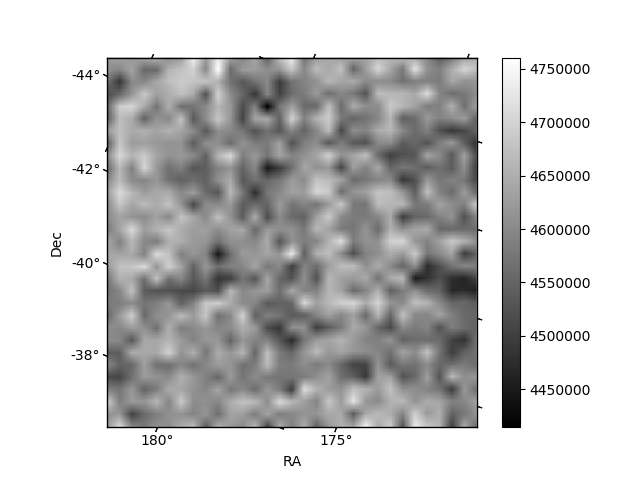
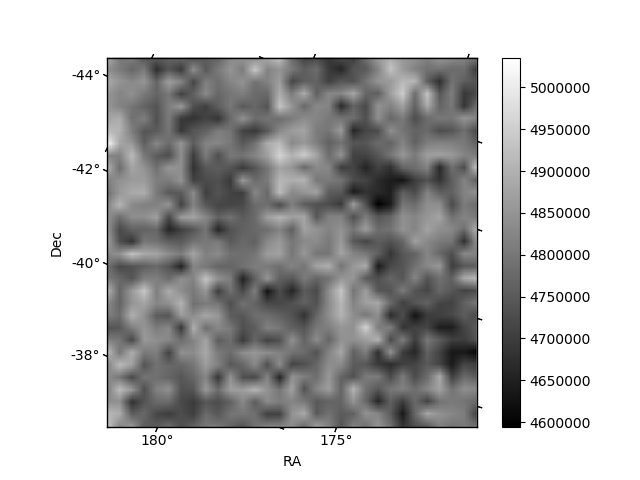
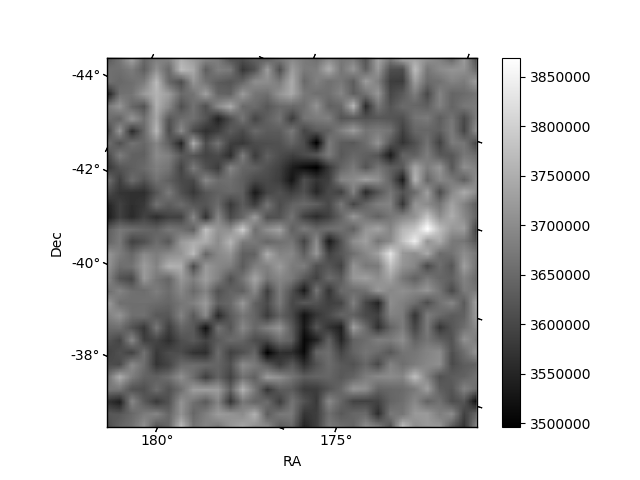
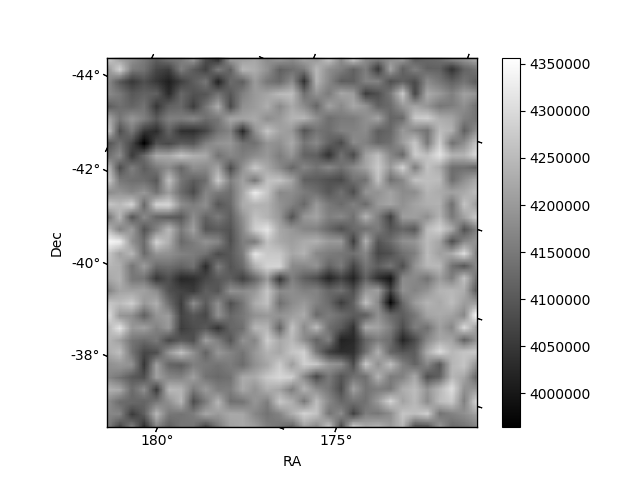
Histogram calculated using DETX and DETY for each event in the final _common_clean file
| Quadrant A | 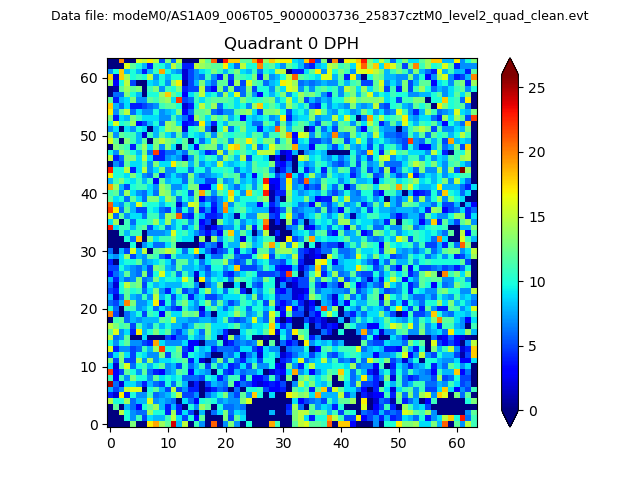 |
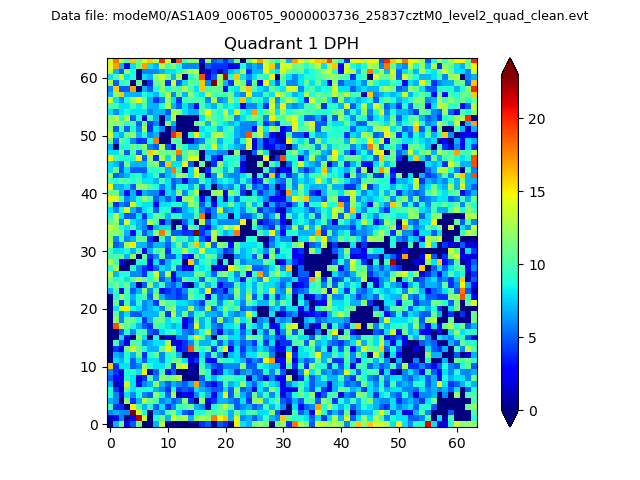 |
Quadrant B |
|---|---|---|---|
| Quadrant D | 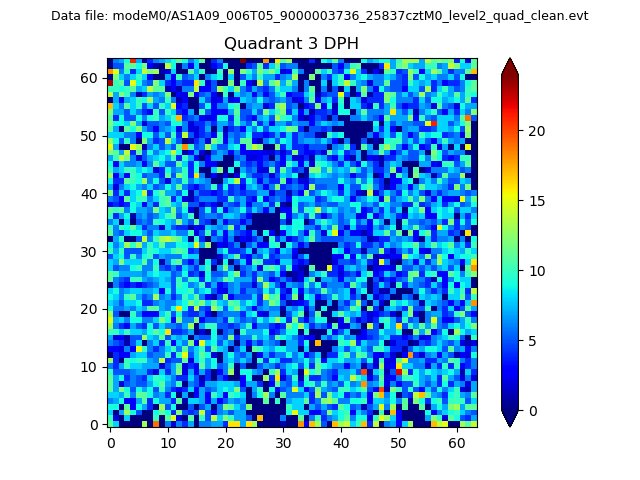 |
 |
Quadrant C |
| Plot type | Count rate plots | Images |
|---|---|---|
| Comparison with Poisson distribution Blue bars denote a histogram of data divided into 1 sec bins. Red curve is a Poisson curve with rate = median count rate of data. |
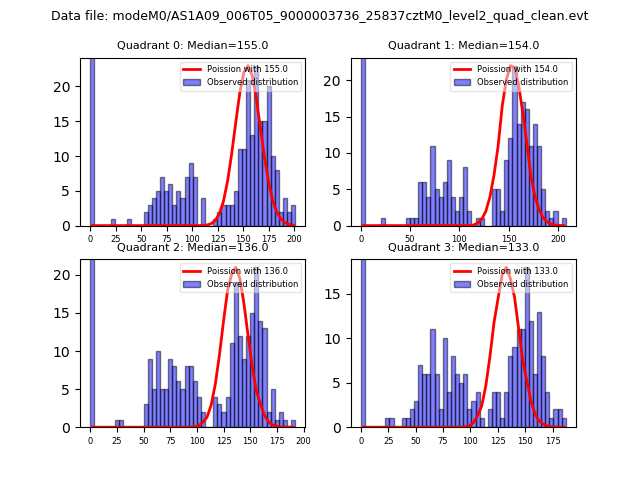 |
 |
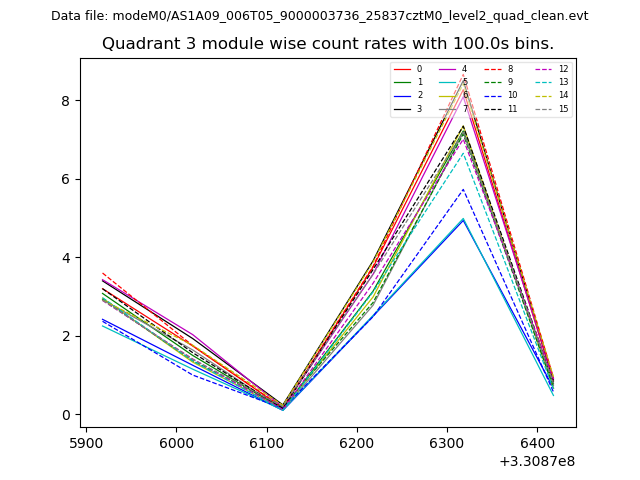
| Quadrant-wise count rates Data is divided into 100 sec bins |
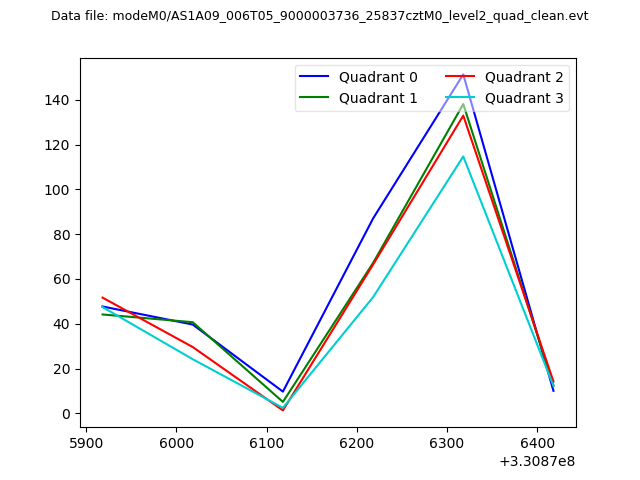 |
|
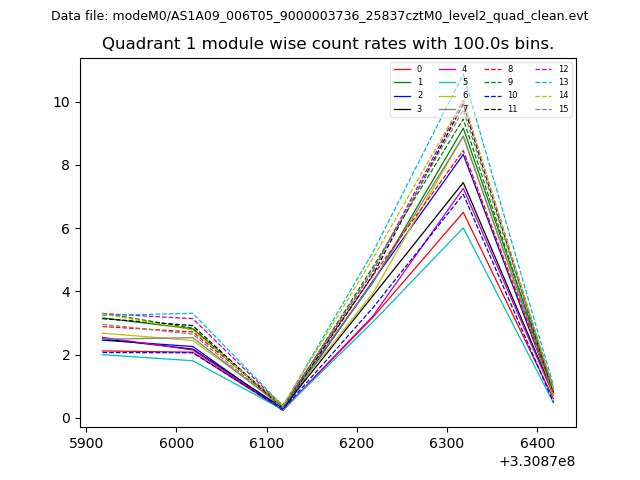
| Module-wise count rates for Quadrant A Data is divided into 100 sec bins |
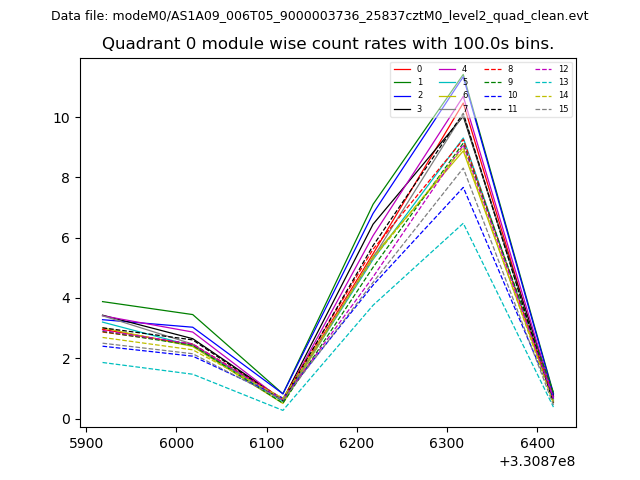 |
 |
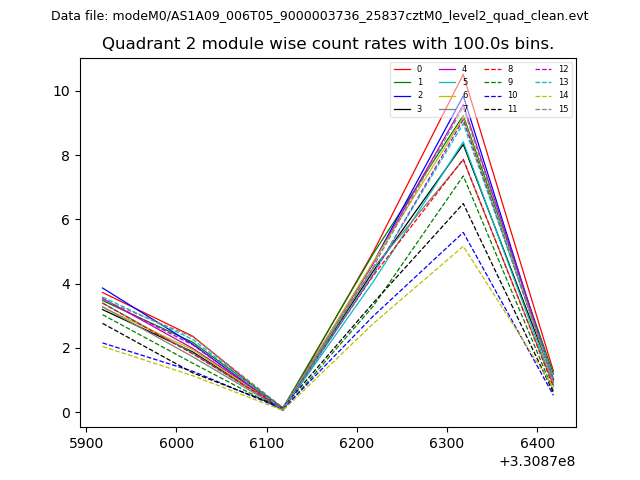
| Module-wise count rates for Quadrant B Data is divided into 100 sec bins |
 |
 |
| Module-wise count rates for Quadrant C Data is divided into 100 sec bins |
 |
 |
| Module-wise count rates for Quadrant D Data is divided into 100 sec bins |
 |
 |
| Parameter | Plot |
|---|---|
| CZT HV Monitor | 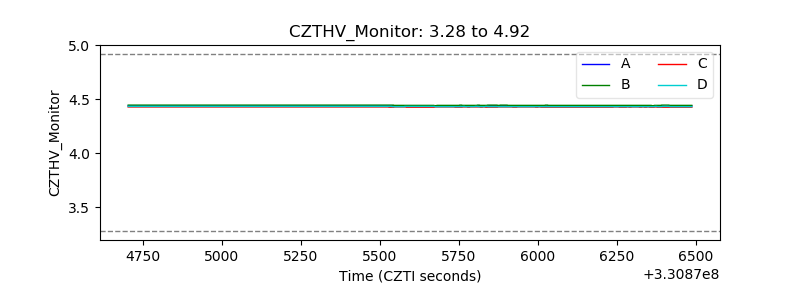 |
| D_VDD | 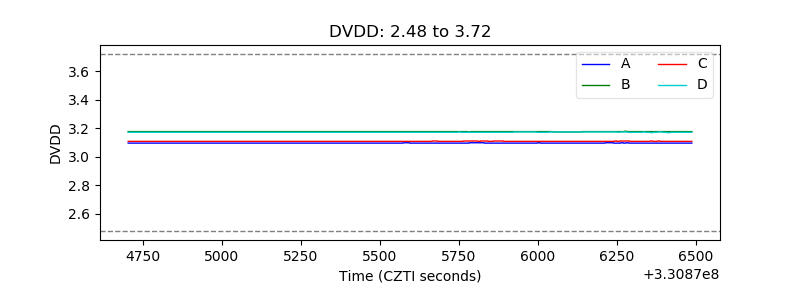 |
| Temperature 1 |  |
| Veto HV Monitor | 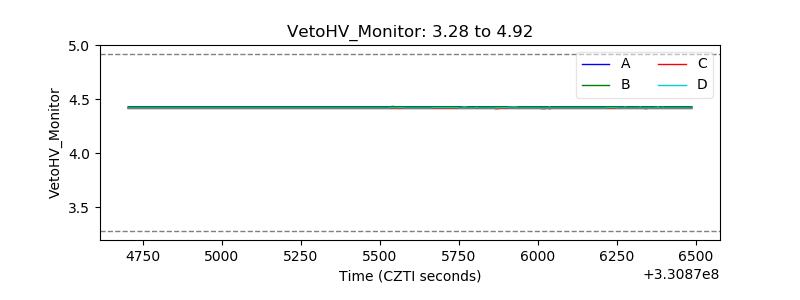 |
| Veto LLD | 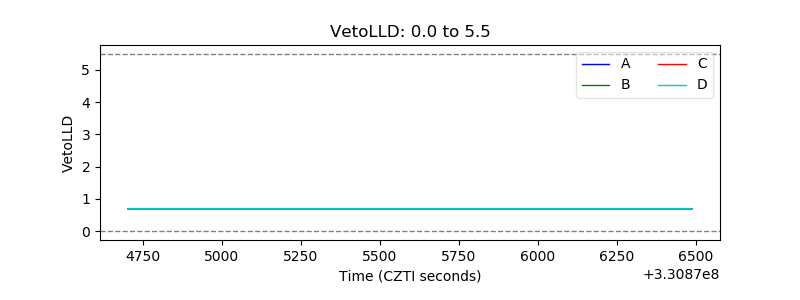 |
| Alpha Counter | 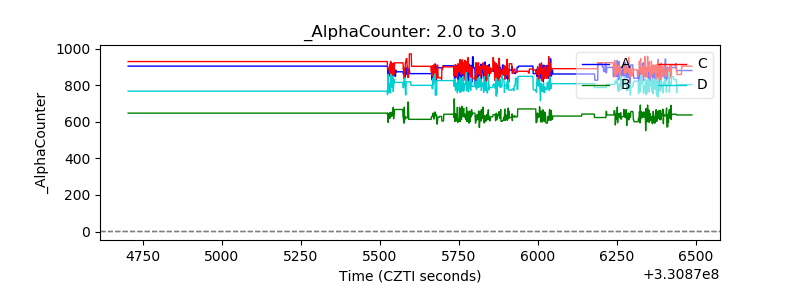 |
| _CPM_Rate | 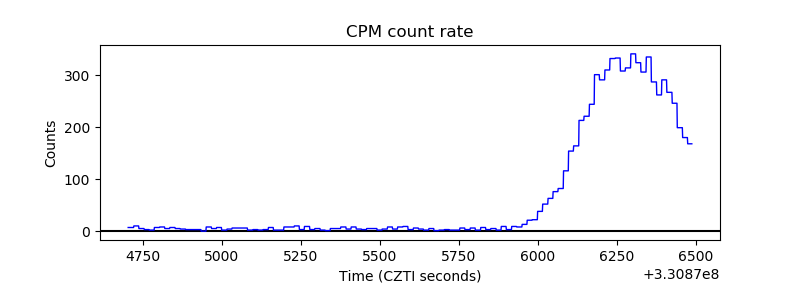 |
| CZT Counter | 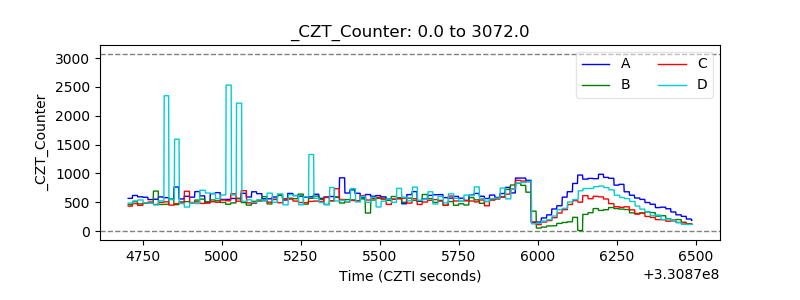 |
| +2.5 Volts monitor |  |
| +5 Volts monitor |  |
| _ROLL_ROT | 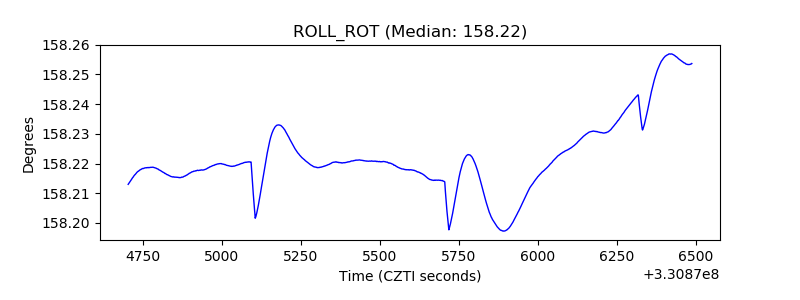 |
| _Roll_DEC | 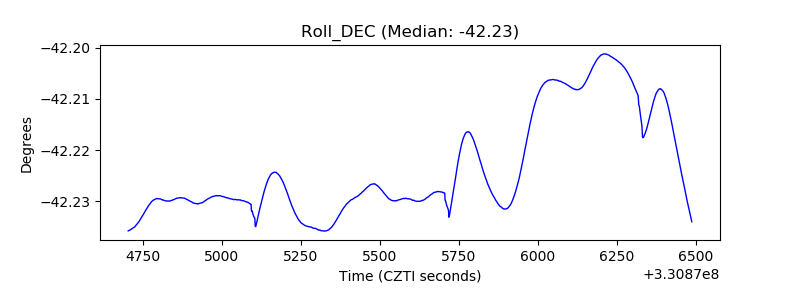 |
| _Roll_RA | 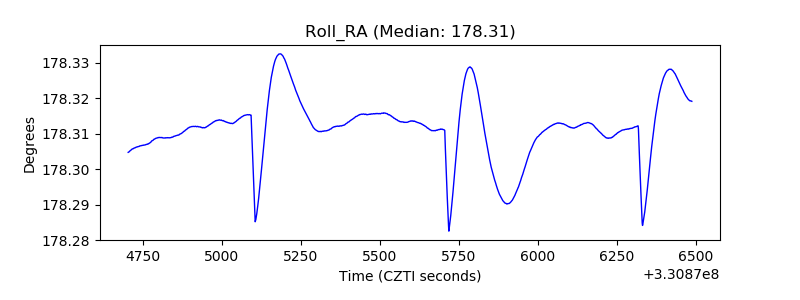 |
| Veto Counter | 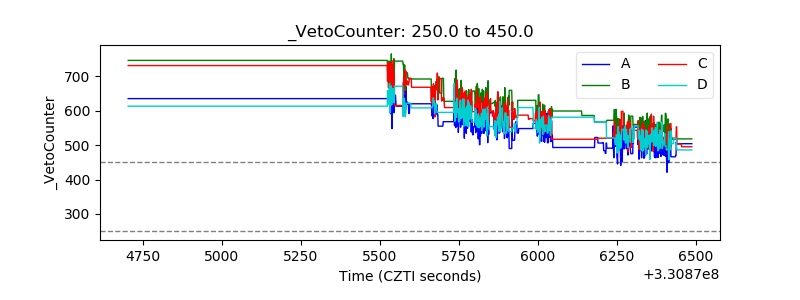 |