| Param | Original file | Final file |
|---|---|---|
| Filename | modeM0/AS1A09_016T03_9000003740cztM0_level2.fits | modeM0/AS1A09_016T03_9000003740cztM0_level2_quad_clean.evt |
| Size (bytes) | 318,672,000 | 267,088,320 |
| Size | 303.9 MB | 254.7 MB |
| Events in quadrant A | 1,981,128 | 1,551,227 |
| Events in quadrant B | 1,913,694 | 1,573,011 |
| Events in quadrant C | 1,911,902 | 1,455,581 |
| Events in quadrant D | 1,677,054 | 1,340,941 |
| Mode M0 | |||
|---|---|---|---|
| Quadrant | BADHDUFLAG | Total packets | Discarded packets |
| A | 0 | 68924 | 0 |
| B | 0 | 66149 | 0 |
| C | 0 | 65785 | 0 |
| D | 0 | 76434 | 0 |
| Mode M9 | |||
|---|---|---|---|
| Quadrant | BADHDUFLAG | Total packets | Discarded packets |
| A | 0 | 31 | 0 |
| B | 0 | 31 | 0 |
| C | 0 | 31 | 0 |
| D | 0 | 31 | 0 |
| Mode SS | |||
|---|---|---|---|
| Quadrant | BADHDUFLAG | Total packets | Discarded packets |
| A | 0 | 642 | 0 |
| B | 0 | 642 | 0 |
| C | 0 | 642 | 0 |
| D | 0 | 642 | 0 |
| Quadrant | Total seconds | Saturated seconds | Saturation percentage |
|---|---|---|---|
| A | 31528 | 864 | 2.740421% |
| B | 31528 | 755 | 2.394697% |
| C | 31528 | 786 | 2.493022% |
| D | 31528 | 639 | 2.026770% |
Noise dominated data is calculated using 1-second bins in cleaned event files. If a bin has >2000 counts, and if more than 50% of those come from <1% of pixels, then it is considered to be noise-dominated and hence unusable.
| Quadrant | # 1 sec bins | Bins with >0 counts | Bins with >2000 counts | High rate bins dominated by noise | Noise dominated (total time) | Noise dominated (detector-on time) | Marked lightcurve |
|---|---|---|---|---|---|---|---|
| A | 34627 | 31523 | 0 | 0 | 0.00% | 0.00% |  |
| B | 34627 | 31524 | 0 | 0 | 0.00% | 0.00% |  |
| C | 34627 | 31525 | 0 | 0 | 0.00% | 0.00% |  |
| D | 34627 | 31525 | 0 | 0 | 0.00% | 0.00% | 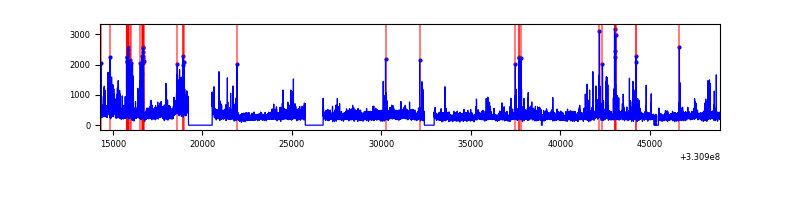 |
Top three noisy pixels from each quadrant. If the there are fewer than three noisy pixels in the level2.evt file, extra rows are filled as -1
| Pixel properties | Quadrant properties | ||||||
|---|---|---|---|---|---|---|---|
| Quadrant | DetID | PixID | Counts | Sigma | Mean | Median | Sigma |
| A | 0 | 29 | 1955 | 11.68 | 515 | 483 | 126.0 |
| A | 7 | 110 | 1586 | 8.75 | 515 | 483 | 126.0 |
| A | 0 | 30 | 1511 | 8.16 | 515 | 483 | 126.0 |
| B | 2 | 9 | 1430 | 9.57 | 505 | 484 | 98.8 |
| B | 3 | 17 | 1289 | 8.15 | 505 | 484 | 98.8 |
| B | 2 | 8 | 1265 | 7.9 | 505 | 484 | 98.8 |
| C | 1 | 81 | 1448 | 7.51 | 505 | 473 | 129.8 |
| C | 1 | 80 | 1419 | 7.28 | 505 | 473 | 129.8 |
| C | 12 | 241 | 1355 | 6.79 | 505 | 473 | 129.8 |
| D | 3 | 14 | 1238 | 6.19 | 478 | 435 | 129.7 |
| D | 6 | 231 | 1183 | 5.77 | 478 | 435 | 129.7 |
| D | 7 | 3 | 1172 | 5.68 | 478 | 435 | 129.7 |
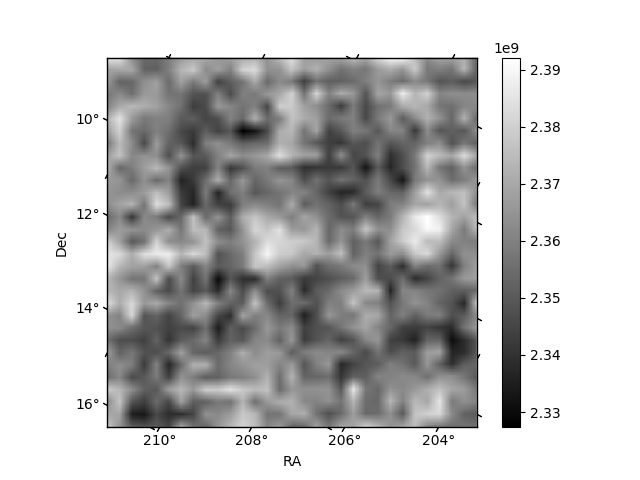
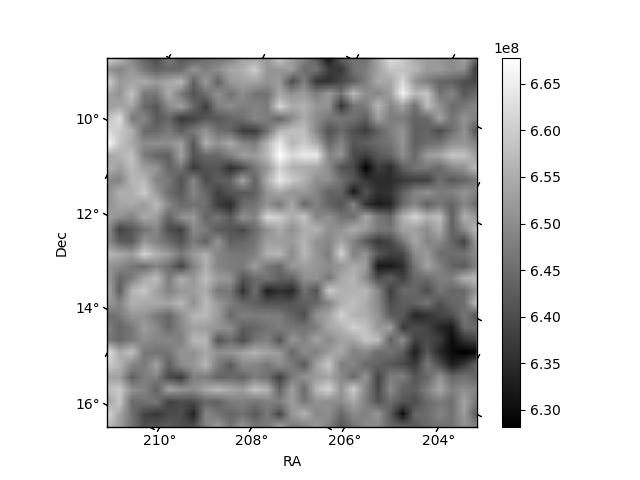
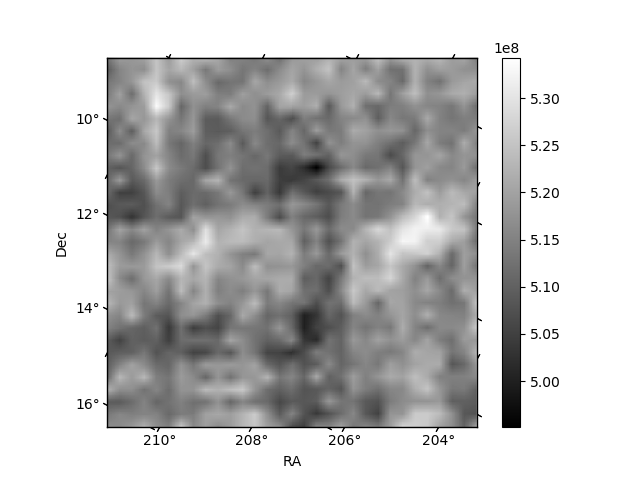
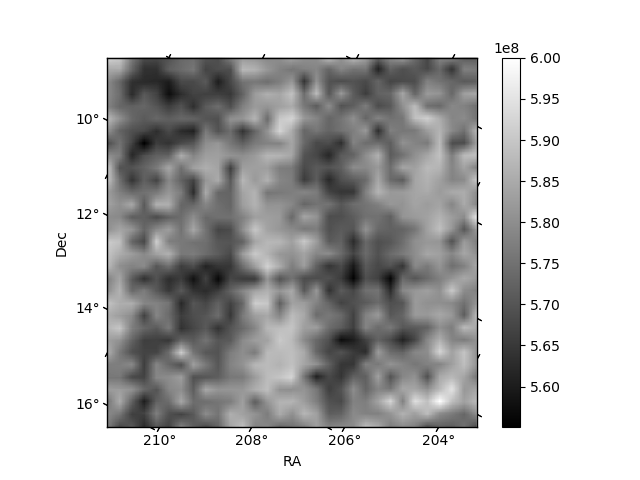
Histogram calculated using DETX and DETY for each event in the final _common_clean file
| Quadrant A | 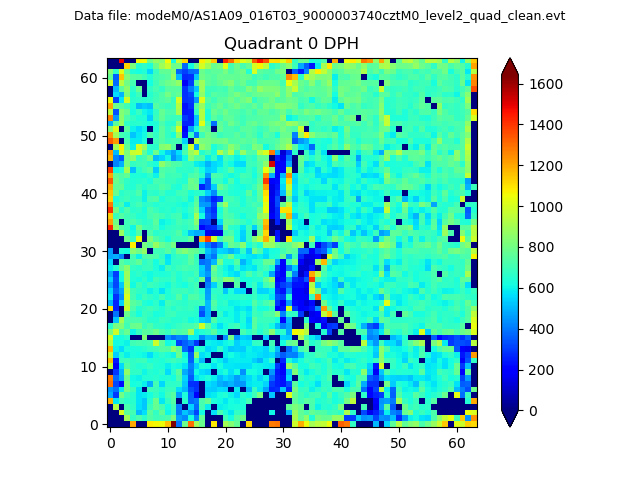 |
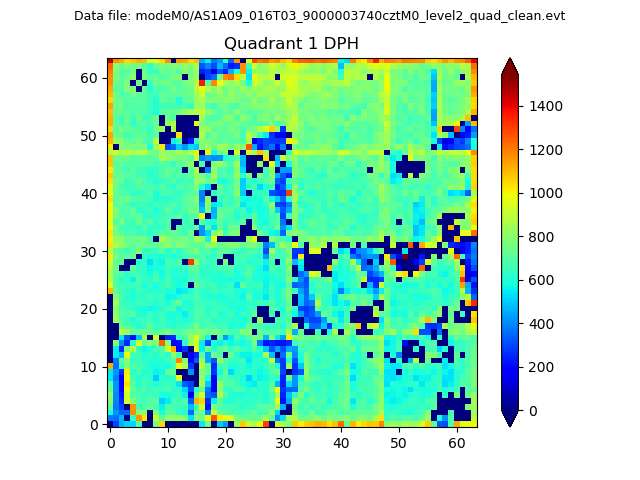 |
Quadrant B |
|---|---|---|---|
| Quadrant D |  |
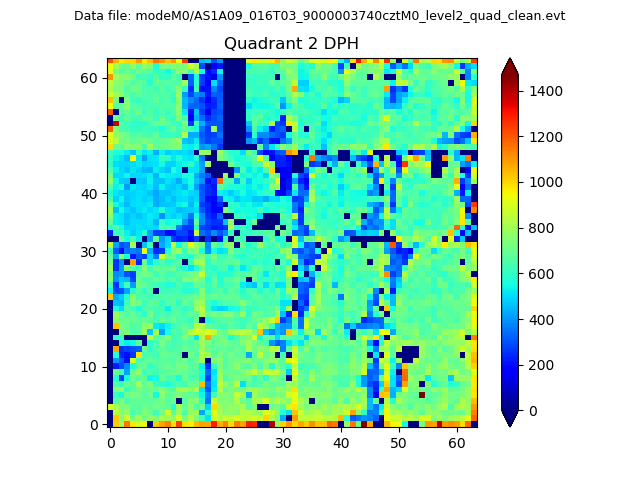 |
Quadrant C |
| Plot type | Count rate plots | Images |
|---|---|---|
| Comparison with Poisson distribution Blue bars denote a histogram of data divided into 1 sec bins. Red curve is a Poisson curve with rate = median count rate of data. |
 |
 |
| Quadrant-wise count rates Data is divided into 100 sec bins |
 |
|
| Module-wise count rates for Quadrant A Data is divided into 100 sec bins |
 |
 |
| Module-wise count rates for Quadrant B Data is divided into 100 sec bins |
 |
 |
| Module-wise count rates for Quadrant C Data is divided into 100 sec bins |
 |
 |
| Module-wise count rates for Quadrant D Data is divided into 100 sec bins |
 |
 |
| Parameter | Plot |
|---|---|
| CZT HV Monitor |  |
| D_VDD | 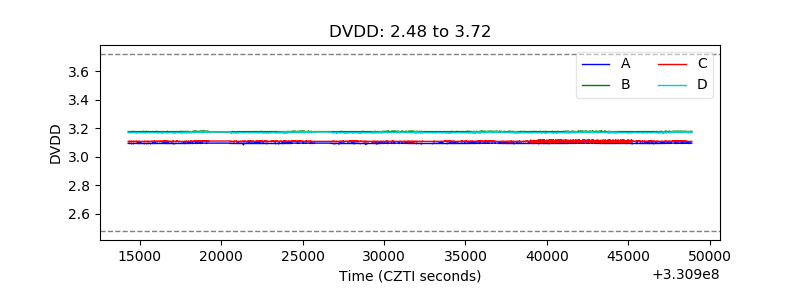 |
| Temperature 1 |  |
| Veto HV Monitor |  |
| Veto LLD |  |
| Alpha Counter | 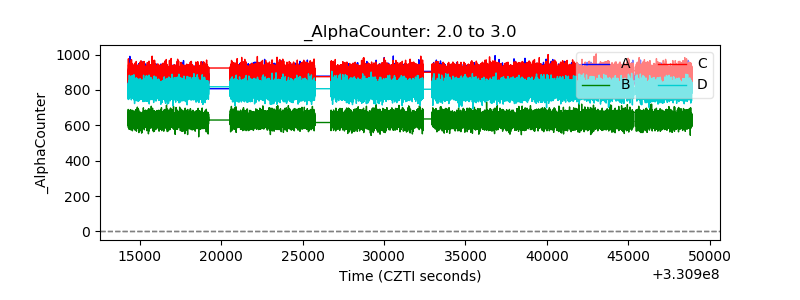 |
| _CPM_Rate |  |
| CZT Counter |  |
| +2.5 Volts monitor |  |
| +5 Volts monitor |  |
| _ROLL_ROT | 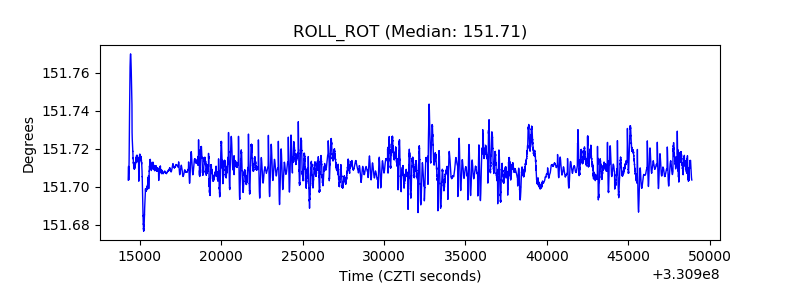 |
| _Roll_DEC |  |
| _Roll_RA |  |
| Veto Counter |  |